
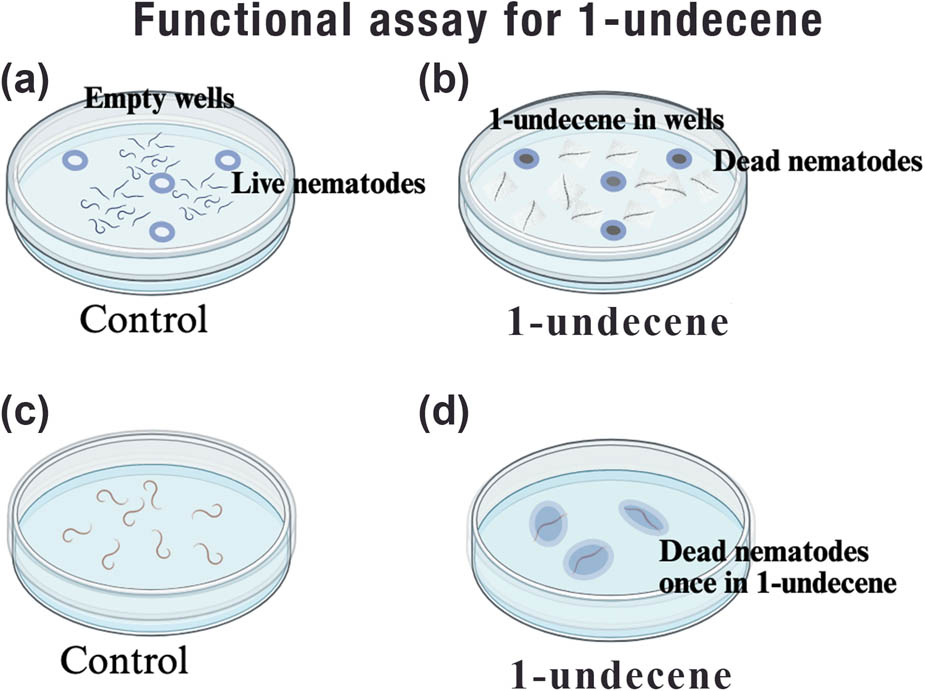
Figure 1
Functional bioassay demonstrating the nematicidal activity of 1-undecene produced by ‘Candidatus Pseudomonas auctus’ JDE115 (Ali et al., 2025). (a) Control: live free-living nematodes in 2% water agar with four empty wells. Nematodes exhibited normal, curved morphology, and active movement. (b) 1-Undecene treatment: bioassay plate containing 1-undecene in four wells. Exposed nematodes appeared straight and immobile, indicating mortality caused by the volatile compound. (c) Additional control: untreated nematodes in 2% water agar remained viable, confirming that agar and plate conditions did not influence nematode viability. (d) Direct in situ exposure: Nematodes exposure directly to 1-undecene on agar became immobile and adopted a straightened posture, demonstrating the compound’s rapid and irreversible toxic effect.
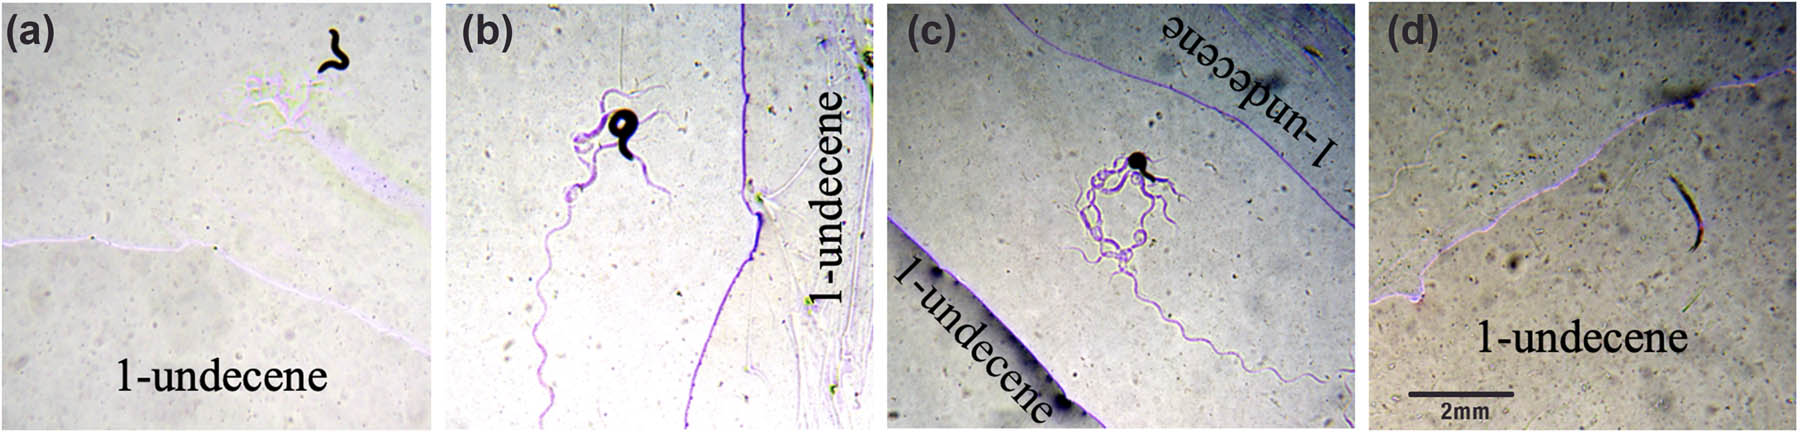
Figure 2
Repellent and nematicidal effects of 1-undecene on free-living nematodes. Microscopic images depict behavioral and lethal responses of nematodes exposed to pure 1-undecene. (a) Nematodes exhibited a characteristic “omega” turn upon sensing 1-undecene, indicating an attempt to reorient away from the source. (b) Continued exposure triggered a second “omega” turn in the opposite direction, confirming sustained avoidance behavior. (c) A third directional change was observed, demonstrating consistent three-directional repulsion and heightened sensitivity to 1-undecene. (d) Nematodes directly exposed to 1-undecene became immobile, adopting a straight posture with internal vacuolization, indicative of complete mortality.
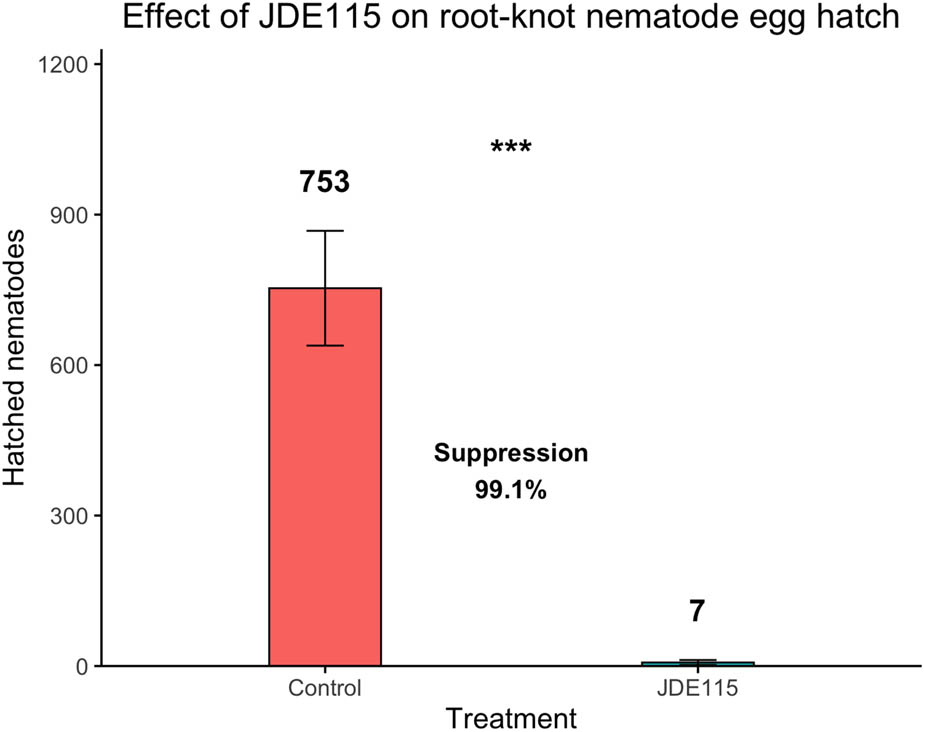
Figure 3
Effect of ‘Candidatus Pseudomonas auctus’ JDE115 (Ali et al., 2025) on root-knot nematode, Meloidogyne incognita (Kofoid & White, 1919; Chitwood, 1949), egg hatching. The bar plot shows the mean number of hatched second-stage juveniles in the JDE115 treated group compared to the untreated control. The error bars represent standard deviation of the mean. A significant reduction in egg hatch was observed in the JDE115 treatment (P < 0.001), with a calculated suppression rate of 99% relative to the control. Numeric values adjacent to the bars indicate mean hatch counts. Data are from five biological replicates per experiment, and the assay was repeated twice independently. Sterile water was used as the negative control. LB-lite medium without JDE115 was confirmed to have no measurable effect on egg hatch, juvenile mortality, or SCN reproduction.
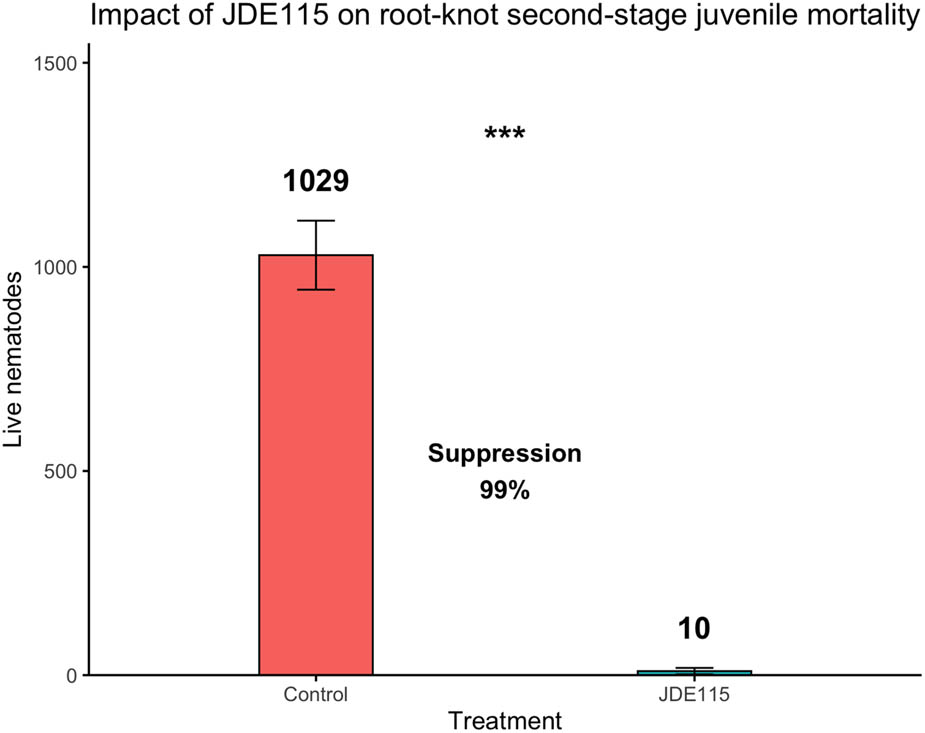
Figure 4
Root-knot nematode, Meloidogyne incognita (Kofoid & White, 1919 (Chitwood, 1949), mortality index following treatment with ‘Candidatus Pseudomonas auctus JDE115 (Ali et al., 2025). Bars represent the mean number of surviving nematodes in the JDE115-treated group compared with the untreated control. Error bars indicate standard deviation (n = 10 per treatment). A two-way linear model (Live Nematodes ∼ Treatment + Replication) revealed a highly significant reduction in nematode survival (P < 0.001), with model assumptions validated by the Shapiro–Wilk test (P = 0.987). Percent suppression by JDE115 was calculated at 99%. A Wilcoxon rank-sum test independently confirmed the result (p = 0.00018). Bar labels indicate mean nematode counts with significance levels (P < 0.001). Data are from five biological replicates per experiment pooled across two independent experiments. Sterile water was used as the negative control. LB-lite medium without JDE115 was confirmed to have no measurable effect on egg hatch, juvenile mortality, or SCN reproduction.
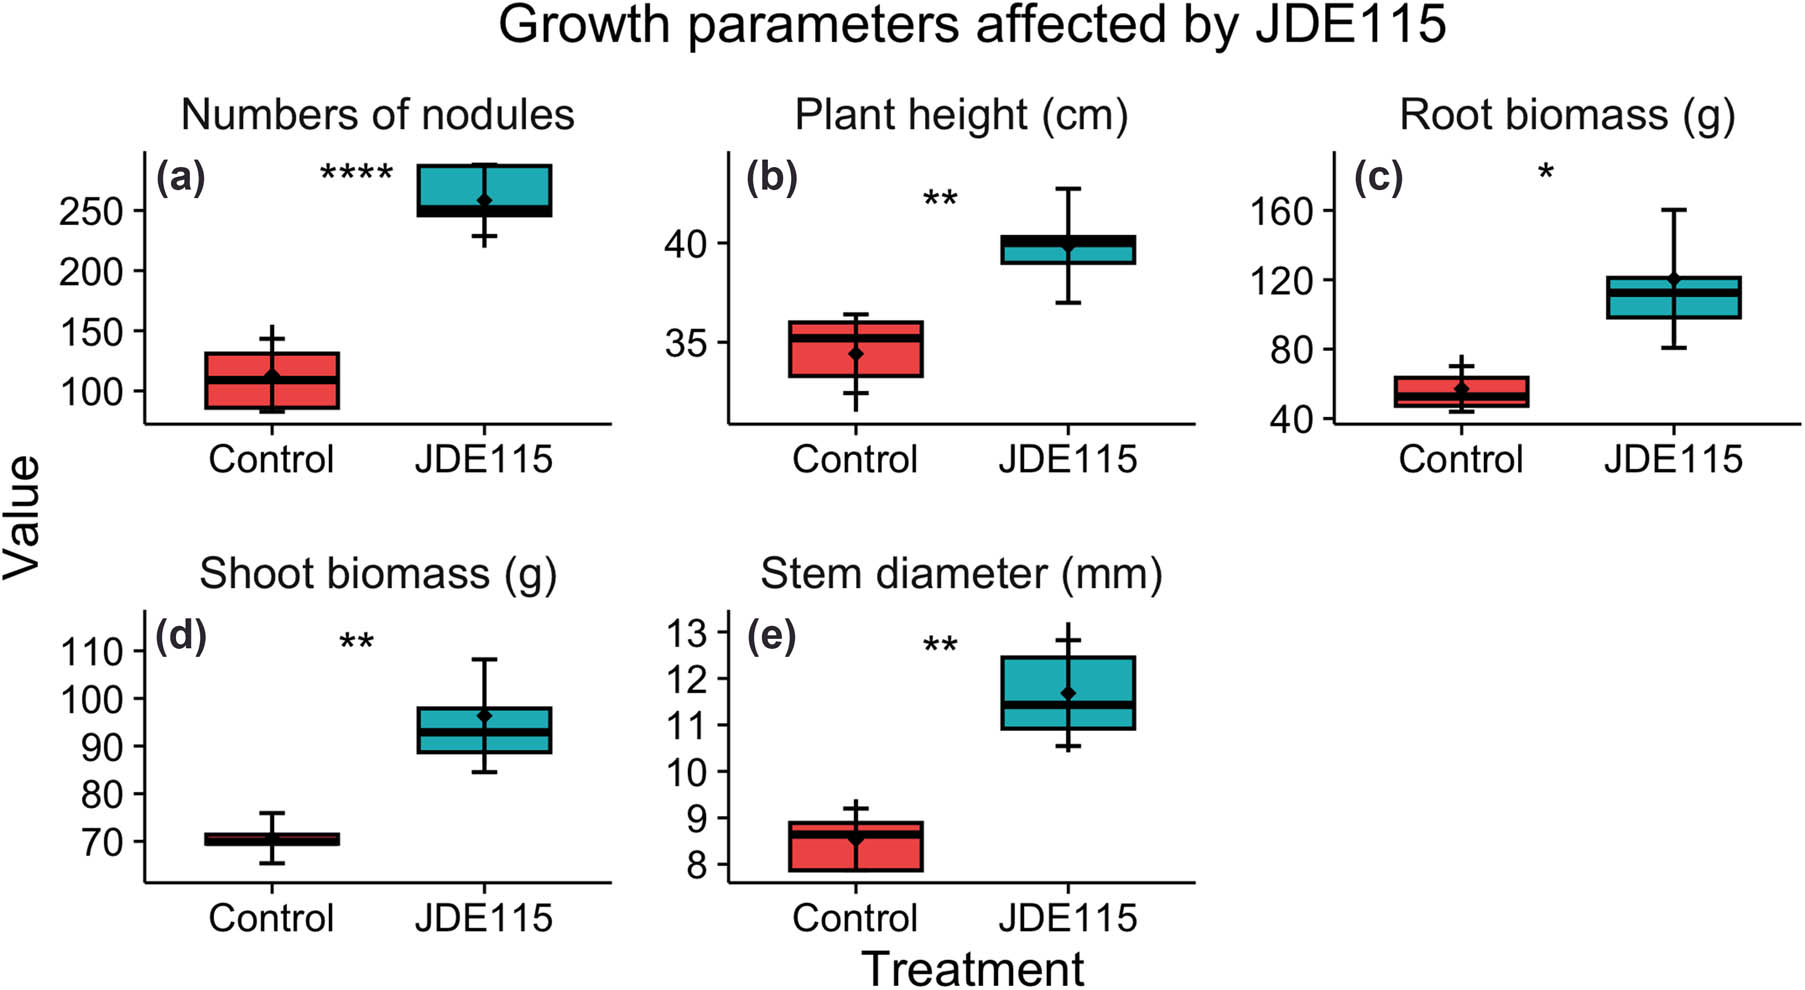
Figure 5
Local effects of ‘Candidatus Pseudomonas auctus’ JDE115 (Ali et al., 2025) on soybean growth. Boxplots illustrate the impact of JDE115 treatment on key soybean growth parameters measured 45 days after sowing, including (a) nodule number, (b) plant height (cm), (c) root biomass (g), (d) shoot biomass (g), and (e) stem diameter (mm). Soybean (Glycine max L.) seeds (cv. Lee) were soaked in JDE115 or LB lite broth (control) and grown in sterilized 3:1 field soil-to-sand mixture under greenhouse conditions. SCN (Heterodera glycines Ichinohe, 1952) eggs (5,000 per plant) were inoculated at the V3 growth stage. Asterisks indicate significant differences between treatments, using the student’s t-test (P ≤ 0.05 (*), P ≤ 0.01 (**), P ≤ 0.001 (***), P ≤ 0.0001 (****)). In each boxplot, the center line indicates the median, the box represents the interquartile range, whiskers show the data range, and the diamond denotes the mean. Data are from five biological replicates per experiment, and the experiment was repeated twice independently. LB lite was used as the negative control. LB-lite medium without JDE115 was confirmed to have no measurable effect on egg hatch, juvenile mortality, or SCN reproduction.
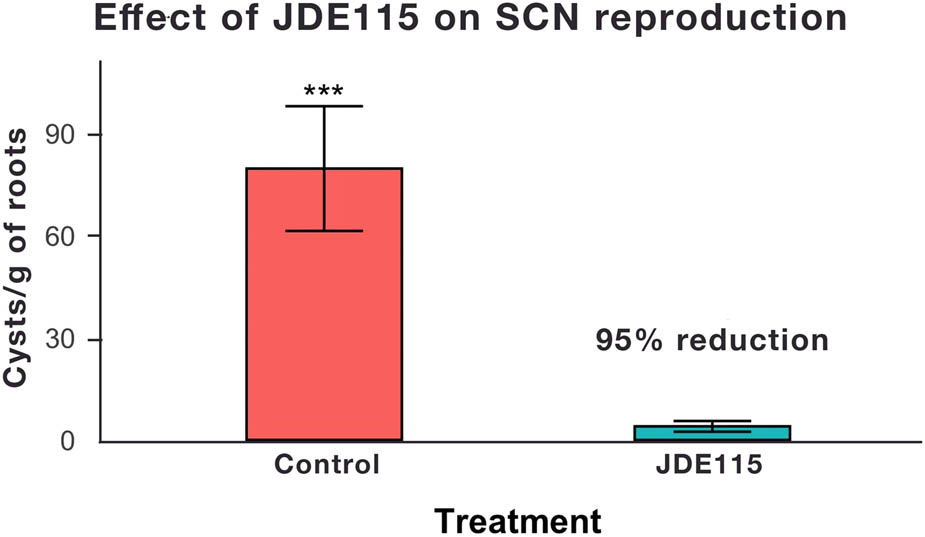
Figure 6
Local effects of ‘Candidatus Pseudomonas auctus’ JDE115 (Ali et al., 2025) on soybean cyst nematode (SCN) (Heterodera glycines Ichinohe, 1952) reproduction. Bar graph shows the number of SCN cysts per gram of root, revealing a 95% reduction in SCN reproduction in the JDE115-treated group compared to the control. Soybean seeds (cv. Lee) were soaked in JDE115 or LB lite broth (control) and grown in sterilized 3:1 field soil-to-sand mixture under greenhouse conditions. SCN eggs (5,000 per plant) were inoculated at the V3 growth stage. Asterisks indicate significant differences between treatments, using the student’s t-test (P ≤ 0.05 (*), P ≤ 0.01 (**), P ≤ 0.001 (***), P ≤ 0.0001 (****)). Bars show mean ± SD. Data are from five biological replicates per experiment, and the experiment was repeated twice independently. LB lite was used as the negative control. LB-lite medium without JDE115 was confirmed to have no measurable effect on egg hatch, juvenile mortality, or SCN reproduction.
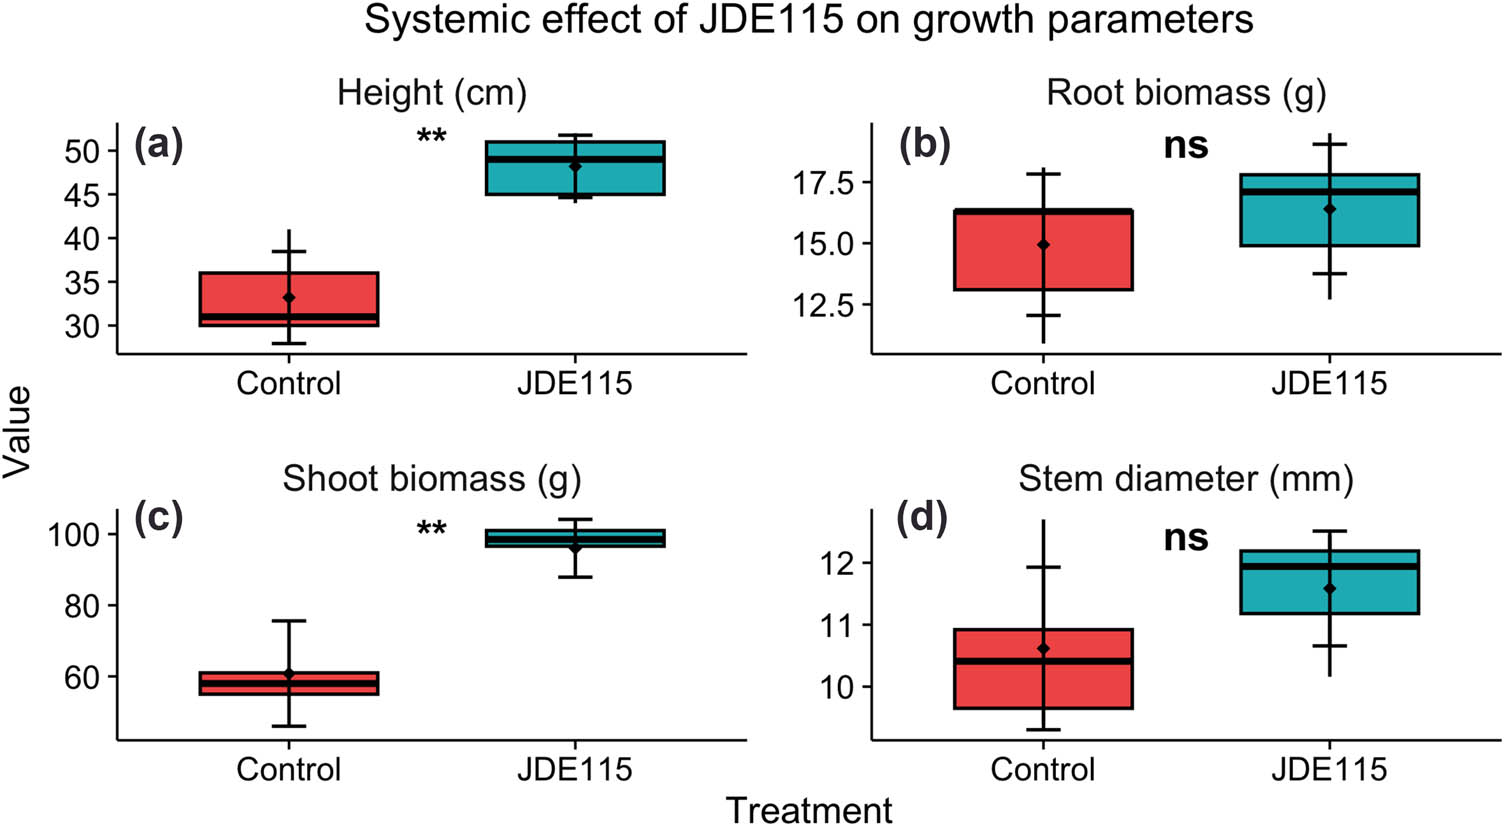
Figure 7
Systemic effects of ‘Candidatus Pseudomonas auctus’ JDE115 (Ali et al., 2025) on soybean (Glycine max L.) growth in a split-root system. Boxplots show (a) plant height (cm), (b) shoot biomass (g), (c) root biomass (g), and (d) stem diameter (mm) in soybean plants where only one root half was treated with JDE115. Asterisks indicate statistical significance as determined by Student’s t-test [P ≤ 0.05 (*), P ≤ 0.01 (**), P ≤ 0.001 (***)]. Error bars represent standard deviation. LB lite water was used as the negative control. In each boxplot, the center line indicates the median, the box represents the interquartile range, whiskers show the data range, and the diamond denotes the mean. Data are from five biological replicates per experiment, and the experiment was repeated twice independently.
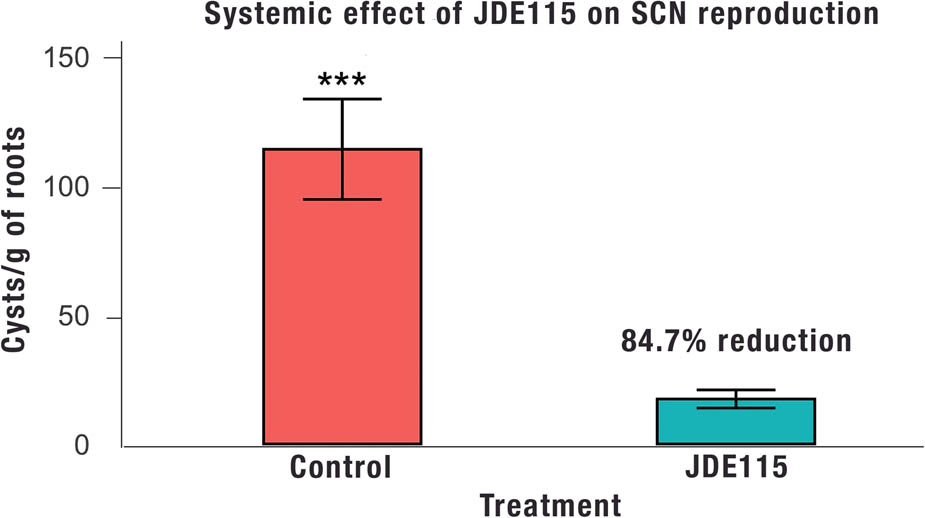
Figure 8
Systemic effects of ‘Candidatus Pseudomonas auctus’ JDE115 (Ali et al., 2025) on soybean cyst nematode (SCN) (Heterodera glycines Ichinohe, 1952) reproduction in a split-root system. Bar graph presents the number of SCN cysts per gram of root from the untreated root half demonstrating systemic suppression. JDE115 treatment reduced SCN cyst production by 84.7%, relative to the control. Asterisks indicate statistical significance as determined by Student’s t-test [P ≤ 0.05 (*), P ≤ 0.01 (**), P ≤ 0.001 (***)]. Bars show mean ± SD. Data are from five biological replicates per experiment, and the experiment was repeated twice independently. LB lite was used as the negative control. LB-lite medium without JDE115 was confirmed to have no measurable effect on egg hatch, juvenile mortality, or SCN reproduction.
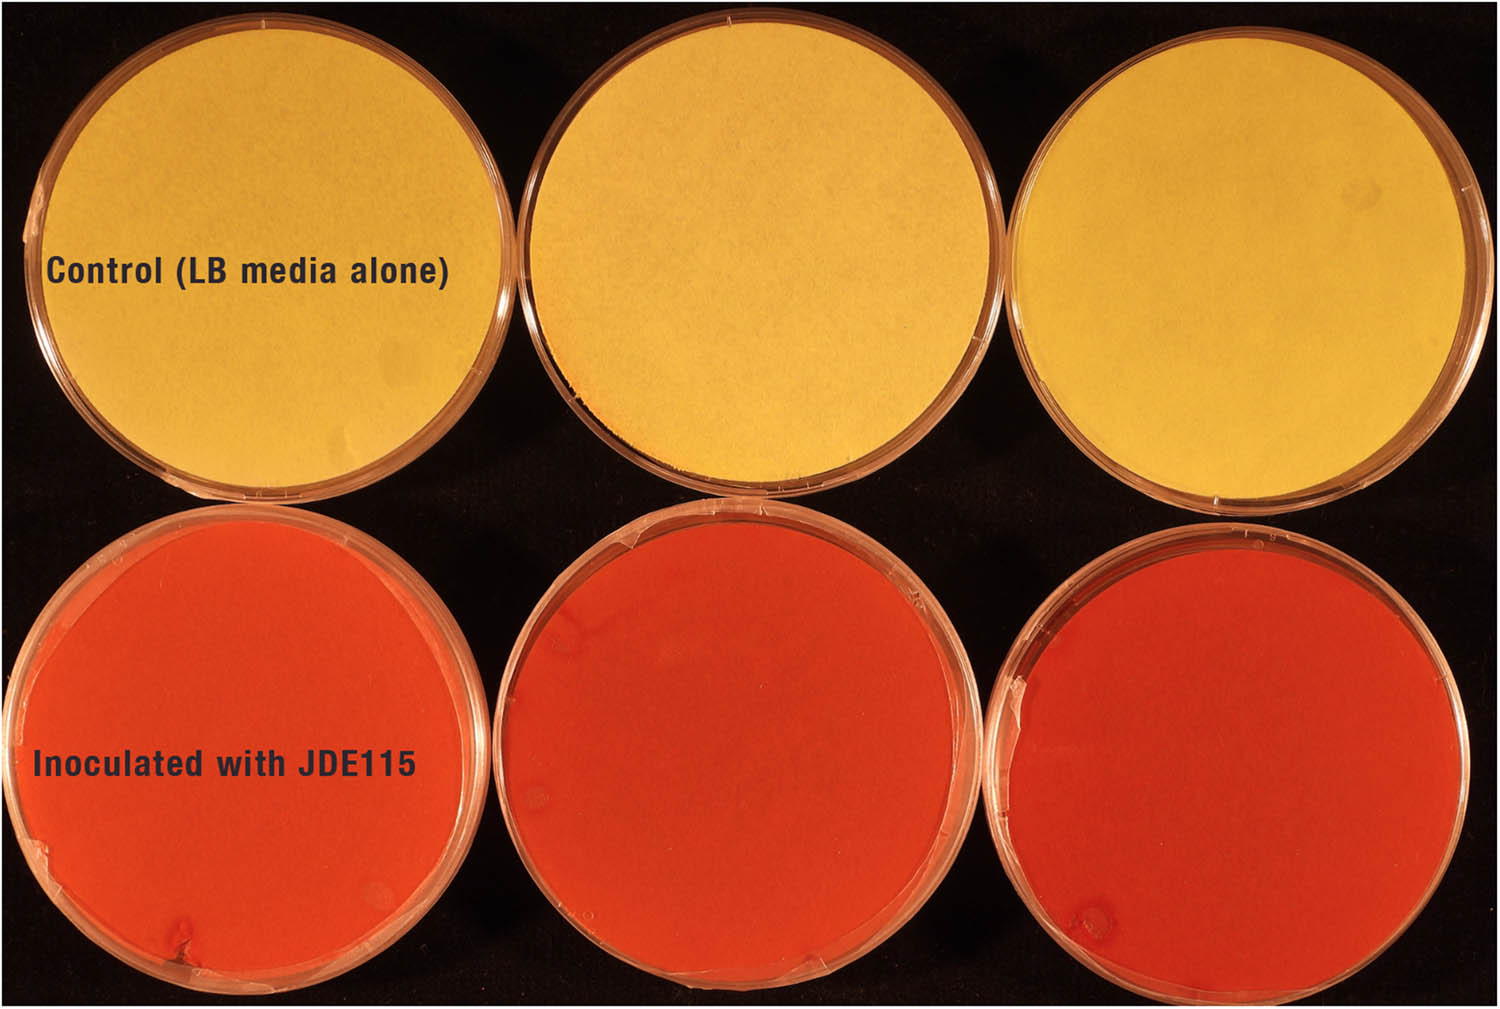
Figure 9
Qualitative detection of hydrogen cyanide (HCN) production by ‘Candidatus Pseudomonas auctus’ JDE115 (Ali et al., 2025) using a colorimetric assay. The top row displays negative control plates containing only LB medium, with no visible color change in the picrate-saturated filter paper. The bottom row shows plates inoculated with JDE115, where a visible color shift from yellow to reddish-brown on the filter paper after 7 days indicates positive HCN production.
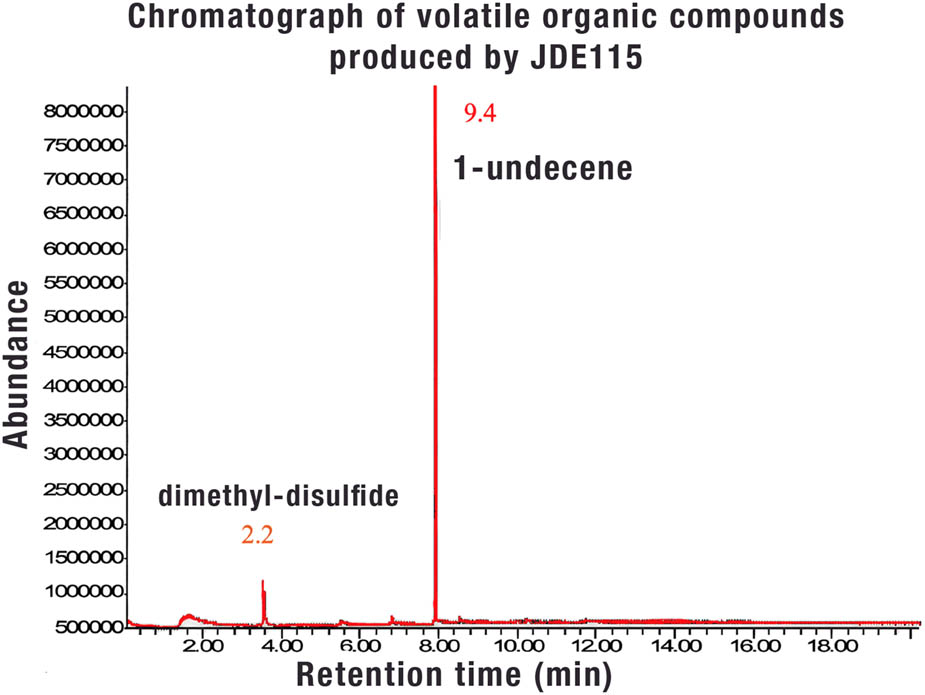
Figure 10
Identification of volatile organic compounds (VOCs) produced by ‘Candidatus Pseudomonas auctus’ JDE115 (Ali et al., 2025) using solid-phase microextraction gas chromatography–mass spectrometry (SPME-GC-MS). The chromatogram displays distinct VOCs peaks emitted by JDE115. Numbers above each peak represent specific VOCs unique to JDE115, while the x-axis indicates retention time in minutes. Two prominent peaks, at 3.545 and 7.925 min., were identified as dimethyl disulfide and 1-undecene, respectively. VOC identities were confirmed based on retention time, peak area, and spectral matching with entries in the Wiley and NIST mass spectral libraries.