
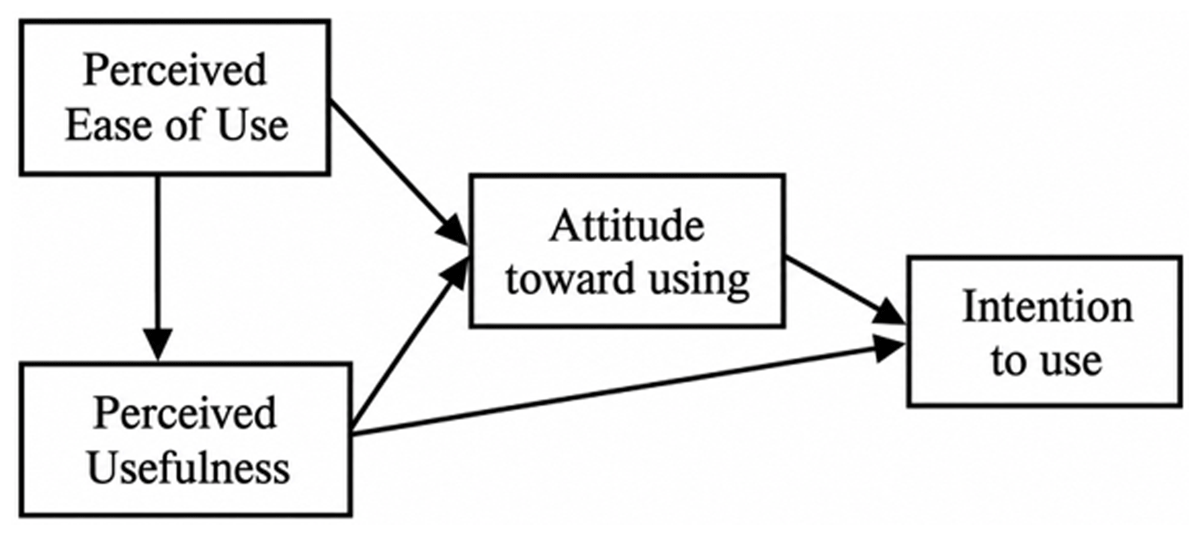
Figure 1
The relationship structure in the TAM model (Weng et al., 2018).
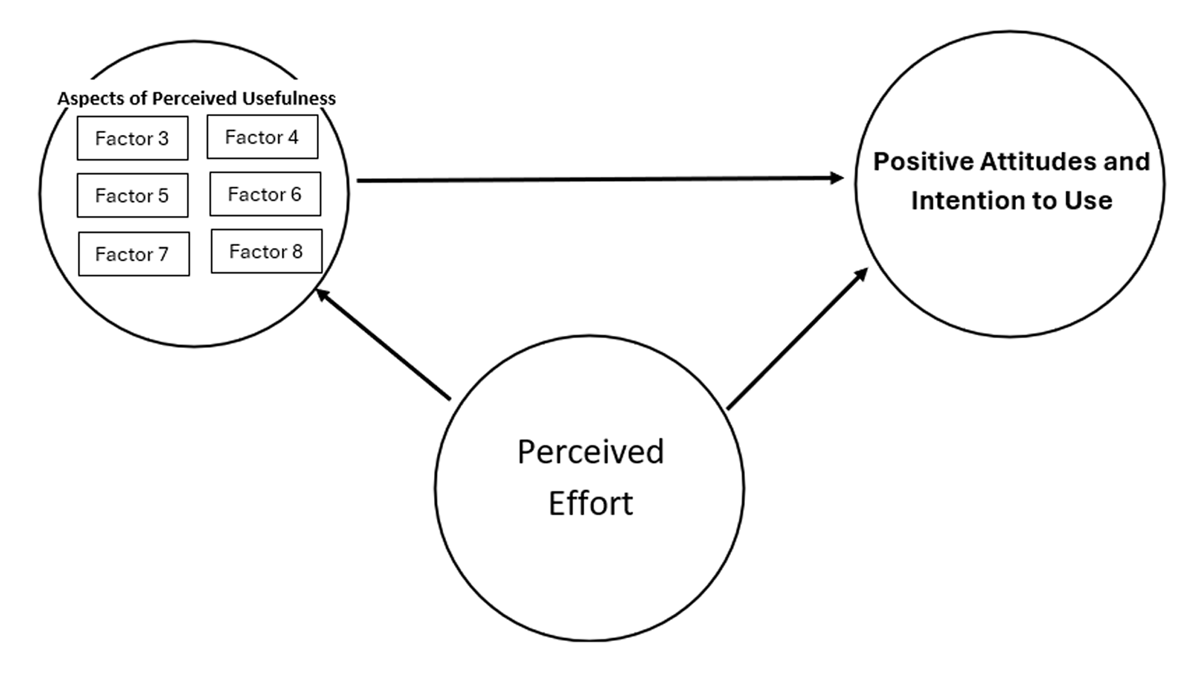
Figure 2
The research model.
Table 1
Descriptive statistics for perceptions regarding GenAI chatbots implementation in classrooms (n = 50)—Factors score.
| FACTOR 1 POSITIVE ATTITUDES TOWARD GENAI CHATBOTS INTEGRATION | FACTOR 2 PERCEIVED EFFORT AND CHALLENGES IN IMPLEMENTATION | FACTOR 3 IMPACT ON STUDENTS’ SKILLS AND ENGAGEMENT | FACTOR 4 FACILITATING INNOVATION AND PERSONALIZATION | FACTOR 5 NEGATIVE IMPACTS ON TEACHER-STUDENT DYNAMICS | FACTOR 6 EXTENDING LEARNING BEYOND THE CLASSROOM | FACTOR 7 REAL-WORLD APPLICATION AND CLASSROOM MANAGEMENT | FACTOR 8 ENHANCING LEARNING EFFICIENCY | |
|---|---|---|---|---|---|---|---|---|
| Mean | 2.97 | 3.15 | 3.35 | 3.10 | 2.80 | 3.47 | 3.06 | 3.19 |
| SD | 0.84 | 0.53 | 0.72 | 0.74 | 0.92 | 0.77 | 0.96 | 0.89 |
Table 2
Correlations between variables.
| FACTOR | 1 | 2 | 3 | 4 | 5 | 6 | 7 | 8 |
|---|---|---|---|---|---|---|---|---|
| 1. Attitudes and intention | — | |||||||
| 2. Perceived effort | 0.14 | — | ||||||
| 3. Impact on students’ skills and engagement | 0.62*** | 0.28 | — | |||||
| 4. Facilitating innovation and personalization | 0.41** | 0.50*** | 0.52*** | — | ||||
| 5. Negative impacts on teacher–student dynamics | –0.26 | 0.22 | –0.12 | 0.24 | — | |||
| 6. Extending learning beyond the classroom | 0.27 | 0.22 | 0.58*** | 0.29* | 0.09 | — | ||
| 7. Real-world application and classroom management | 0.49*** | 0.22 | 0.53*** | 0.48*** | –0.04 | 0.39** | — | |
| 8. Enhancing learning efficiency | 0.59*** | 0.32* | 0.65*** | 0.44** | –0.15 | 0.52*** | 0.43** | — |
[i] *p < .05, **p < .01, **p < .001.
Table 3
Linear regression: Predicting the effect of perceived effort on perceived promotion of innovation and personalization.
| LINEAR REGRESSION | ||||||||||
|---|---|---|---|---|---|---|---|---|---|---|
| MODEL SUMMARY – FACTOR4 | ||||||||||
| MODEL | R | R2 | ADJUSTED R2 | RMSE | R2 CHANGE | F CHANGE | df1 | df2 | P | |
| H0 | 0.000 | 0.000 | 0.000 | 0.739 | 0.000 | 0 | 49 | |||
| H1 | 0.501 | 0.251 | 0.236 | 0.646 | 0.251 | 16.096 | 1 | 48 | < .001 | |
| ANOVA | ||||||||||
| MODEL | SUM OF SQUARES | df | MEAN SQUARE | F | p | |||||
| H1 | Regression | 6.720 | 1 | 6.720 | 16.096 | < .001 | ||||
| Residual | 20.041 | 48 | 0.418 | |||||||
| Total | 26.761 | 49 | ||||||||
| Note. The intercept model is omitted, as no meaningful information can be shown. | ||||||||||
| COEFFICIENTS | ||||||||||
| MODEL | UNSTANDARDIZED | STANDARD ERROR | STANDARDIZED | t | p | 95% CI | COLLINEARITY STATISTICS | |||
| LOWER | UPPER | TOLERANCE | VIF | |||||||
| H0 | (Intercept) | 3.105 | 0.105 | 29.709 | < .001 | 2.895 | 3.315 | |||
| H1 | (Intercept) | 0.884 | 0.561 | 1.576 | 0.122 | –0.244 | 2.012 | |||
| Factor 2 | 0.704 | 0.175 | 0.501 | 4.012 | < .001 | 0.351 | 1.056 | 1.000 | 1.000 | |
| DESCRIPTIVES | ||||||||||
| N | MEAN | SD | SE | |||||||
| Factor 4 | 50 | 3.105 | 0.739 | 0.105 | ||||||
| Factor 2 | 50 | 3.157 | 0.526 | 0.074 | ||||||
Table 4
Linear regression: Predicting the effect of perceived effort on perceived improvement of learning efficiency.
| LINEAR REGRESSION | ||||||||||
|---|---|---|---|---|---|---|---|---|---|---|
| MODEL SUMMARY – FACTOR8 | ||||||||||
| MODEL | R | R2 | ADJUSTED R2 | RMSE | R2 CHANGE | F CHANGE | df1 | df2 | P | |
| H0 | 0.000 | 0.000 | 0.000 | 0.892 | 0.000 | 0 | 49 | |||
| H1 | 0.319 | 0.102 | 0.083 | 0.854 | 0.102 | 5.453 | 1 | 48 | 0.024 | |
| ANOVA | ||||||||||
| MODEL | SUM OF SQUARES | df | MEAN SQUARE | F | p | |||||
| H1 | Regression | 3.973 | 1 | 3.973 | 5.453 | 0.024 | ||||
| Residual | 34.972 | 48 | 0.729 | |||||||
| Total | 38.945 | 49 | ||||||||
| Note. The intercept model is omitted, as no meaningful information can be shown. | ||||||||||
| COEFFICIENTS | ||||||||||
| MODEL | UNSTANDARDIZED | STANDARD ERROR | STANDARDIZED | t | p | 95% CI | COLLINEARITY STATISTICS | |||
| LOWER | UPPER | TOLERANCE | VIF | |||||||
| H0 | (Intercept) | 3.190 | 0.126 | 25.302 | < .001 | 2.937 | 3.443 | |||
| H1 | (Intercept) | 1.482 | 0.741 | 2.000 | 0.051 | –0.008 | 2.973 | |||
| Factor 2 | 0.541 | 0.232 | 0.319 | 2.335 | 0.024 | 0.075 | 1.007 | 1.000 | 1.000 | |
| DESCRIPTIVES | ||||||||||
| N | MEAN | SD | SE | |||||||
| Factor 8 | 50 | 3.190 | 0.892 | 0.126 | ||||||
| Factor 2 | 50 | 3.157 | 0.526 | 0.074 | ||||||
Table 5
Linear regression: Predicting the effect of all independent variables on attitudes and intention to use GenAI chatbots in teaching.
| LINEAR REGRESSION | ||||||||
|---|---|---|---|---|---|---|---|---|
| MODEL SUMMARY – FACTOR1 | ||||||||
| MODEL | R | R2 | ADJUSTED R2 | RMSE | ||||
| H0 | 0.000 | 0.000 | 0.000 | 0.837 | ||||
| H1 | 0.731 | 0.535 | 0.457 | 0.616 | ||||
| ANOVA | ||||||||
| MODEL | SUM OF SQUARES | df | MEAN SQUARE | F | p | |||
| H1 | Regression | 18.339 | 7 | 2.620 | 6.894 | < .001 | ||
| Residual | 15.960 | 42 | 0.380 | |||||
| Total | 34.299 | 49 | ||||||
| Note. The intercept model is omitted, as no meaningful information can be shown. | ||||||||
| COEFFICIENTS | ||||||||
| MODEL | UNSTANDARDIZED | STANDARD ERROR | STANDARDIZED | t | p | 95% CI | ||
| LOWER | UPPER | |||||||
| H0 | (Intercept) | 2.971 | 0.118 | 25.110 | < .001 | 2.733 | 3.209 | |
| H1 | (Intercept) | 1.243 | 0.654 | 1.902 | 0.064 | –0.076 | 2.562 | |
| Factor 2 | –0.155 | 0.198 | –0.098 | –0.784 | 0.437 | –0.554 | 0.244 | |
| Factor 3 | 0.413 | 0.194 | 0.357 | 2.125 | 0.039 | 0.021 | 0.804 | |
| Factor 4 | 0.152 | 0.171 | 0.134 | 0.889 | 0.379 | –0.193 | 0.497 | |
| Factor 5 | –0.145 | 0.110 | –0.159 | –1.320 | 0.194 | –0.366 | 0.077 | |
| Factor 6 | –0.193 | 0.152 | –0.177 | –1.272 | 0.210 | –0.499 | 0.113 | |
| Factor 7 | 0.157 | 0.114 | 0.180 | 1.372 | 0.177 | –0.074 | 0.388 | |
| Factor 8 | 0.301 | 0.141 | 0.321 | 2.139 | 0.038 | 0.017 | 0.585 | |
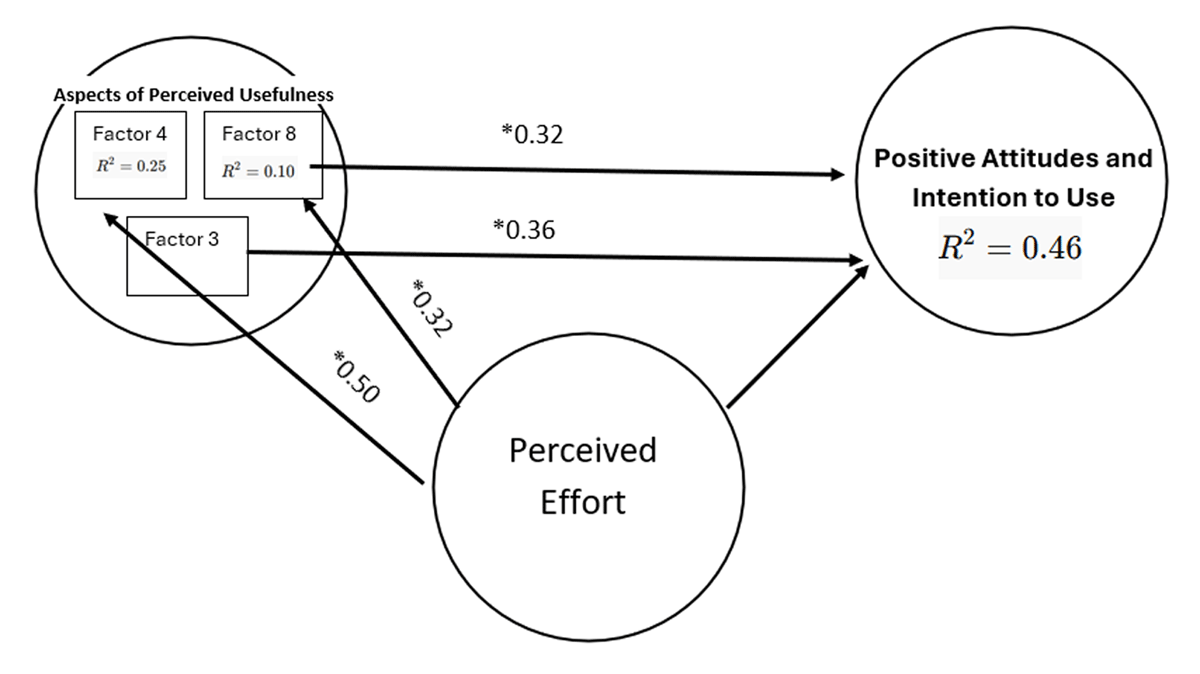
Figure 3
The prediction system in the TAM model in the current study.
Table 6
Aligning empirical findings with the UNESCO AI Competency Framework: Implications for pre-service teacher education.
| EMPIRICAL FINDINGS FROM THE STUDY | PERCEIVED USEFULNESS DIMENSION(S) PREDICTING ADOPTION | UNESCO AI COMPETENCY DIMENSION | IMPLICATIONS FOR PRE-SERVICE TEACHER EDUCATION |
|---|---|---|---|
| Adoption intentions were primarily predicted by pedagogically meaningful benefits rather than by usability alone | Contribution to students’ skills and engagement (Factor 3); Enhancing learning efficiency (Factor 8) | Human-centered mindset | Frame GenAI as a tool that supports meaningful learning, student engagement, and skill development, reinforcing the role of teachers’ pedagogical judgment and agency rather than technological substitution. |
| Ethical and relational considerations did not emerge as direct predictors of adoption intentions | Indirectly linked to benefit-oriented perceptions (Factors 3 & 8) | Ethics of AI | Integrate ethical reflection into concrete pedagogical scenarios that highlight efficiency, learning outcomes, and student engagement, rather than addressing ethics as an abstract or standalone topic. |
| Perceived ease of use influenced adoption intentions only indirectly, through selected usefulness dimensions | Facilitating innovation and personalization (Factor 4); Enhancing learning efficiency (Factor 8) | AI foundations and applications | Emphasize operational understanding of GenAI tools as a means to enable pedagogical flexibility and instructional efficiency, rather than focusing on technical knowledge as an end in itself. |
| Pedagogical usefulness related to learning processes was central to adoption intentions | Students’ skills and engagement (Factor 3); Innovation and personalization (Factor 4); Learning efficiency (Factor 8) | AI pedagogy | Provide hands-on, pedagogically grounded experiences in which pre-service teachers design and reflect on AI-supported learning activities that directly address engagement, skills, personalization, and efficiency. |
| Learning efficiency emerged as a consistent predictor of positive attitudes and intention to use | Enhancing learning efficiency (Factor 8) | AI for professional development | Introduce GenAI as a resource for teachers’ professional learning, including lesson planning, instructional reflection, and adaptive teaching, highlighting its role in supporting sustainable professional practice. |