
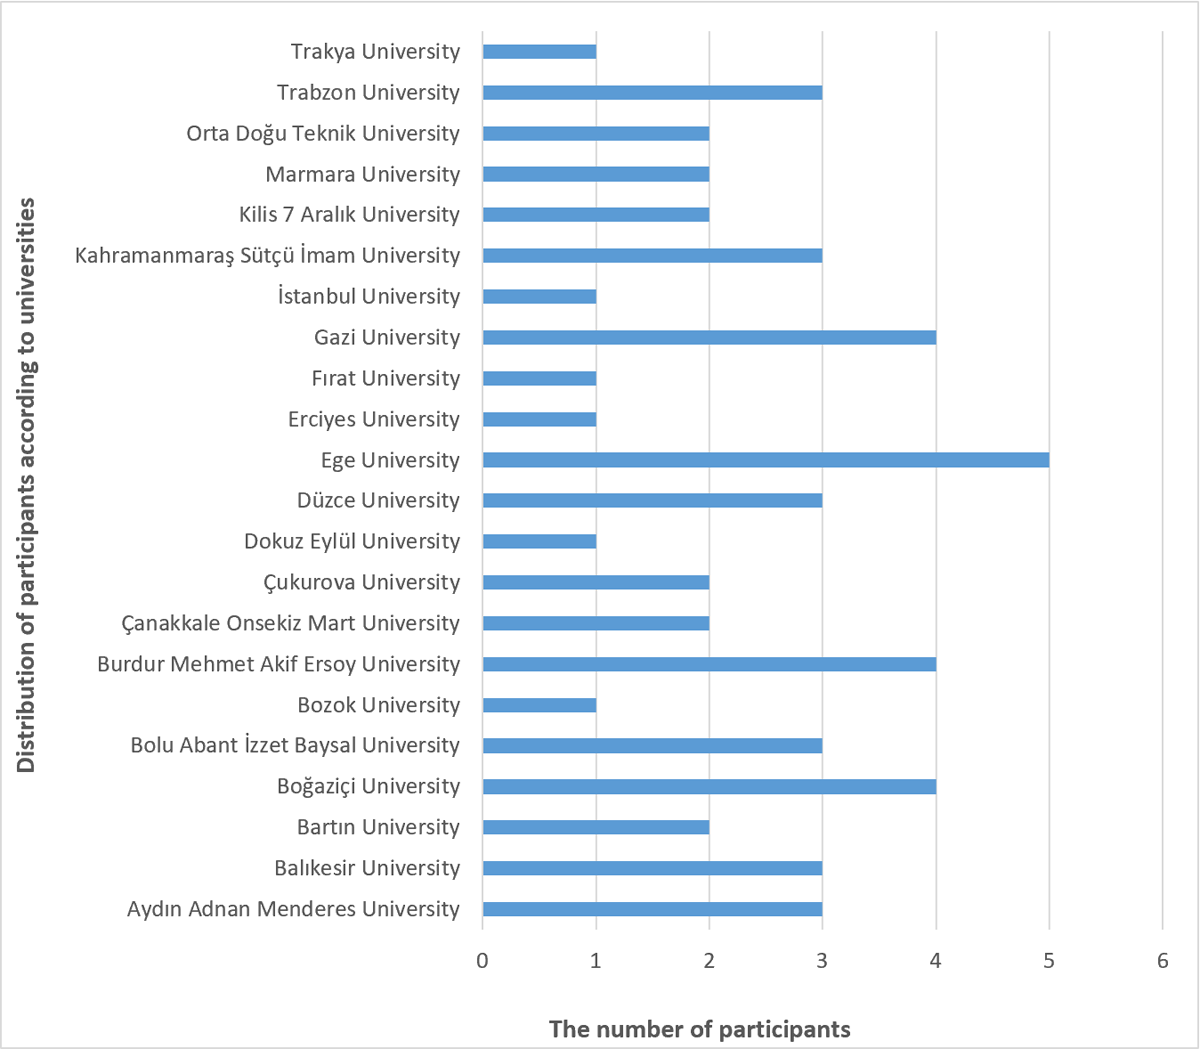
Graphic 1
Universities of the participants.
Table 1
Normality test findings of the scales’ data.
| STATISTIC | df | Sig. | |
|---|---|---|---|
| DTeM pre-test | ,129 | 53 | ,082 |
| DTeM post-test | ,175 | 53 | ,097 |
| TIn pre- test | ,083 | 53 | ,200 |
| TIn post- test | ,163 | 53 | ,110 |
| ETS pre- test | ,096 | 53 | ,200 |
| ETS post- test | ,292 | 53 | ,061 |
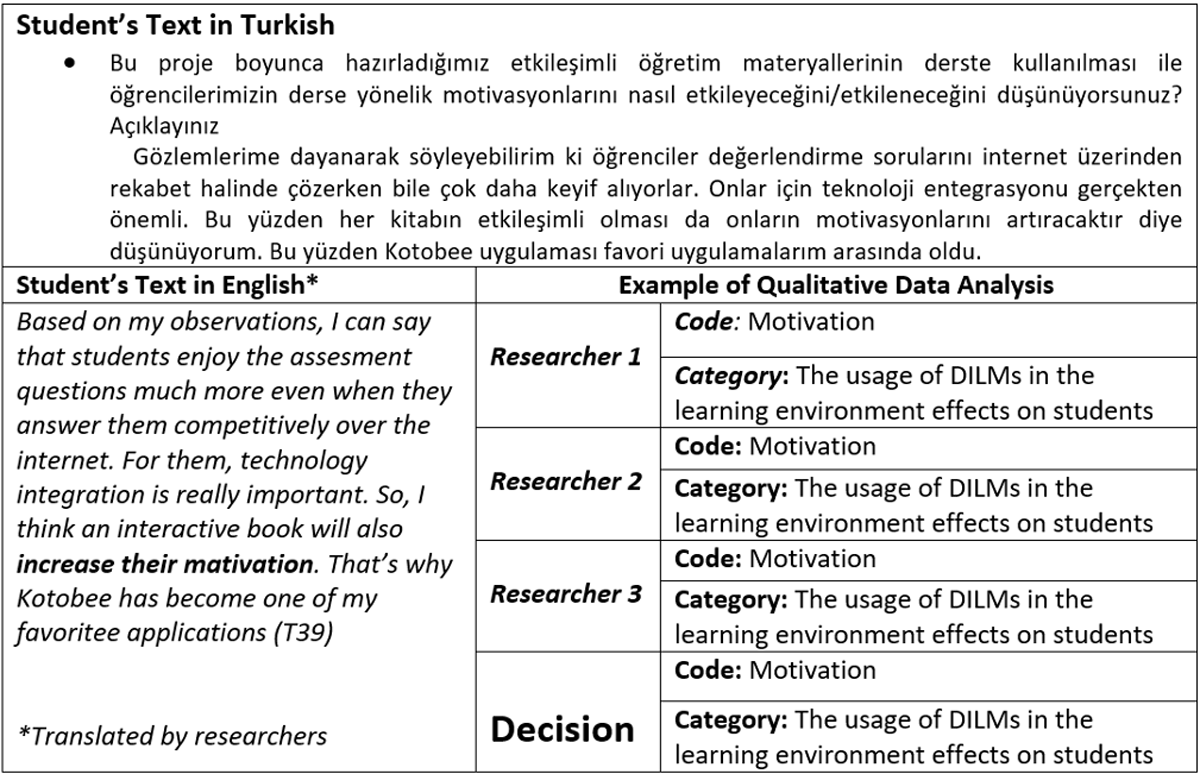
Figure 1
An example of the qualitative data analysis procedure.
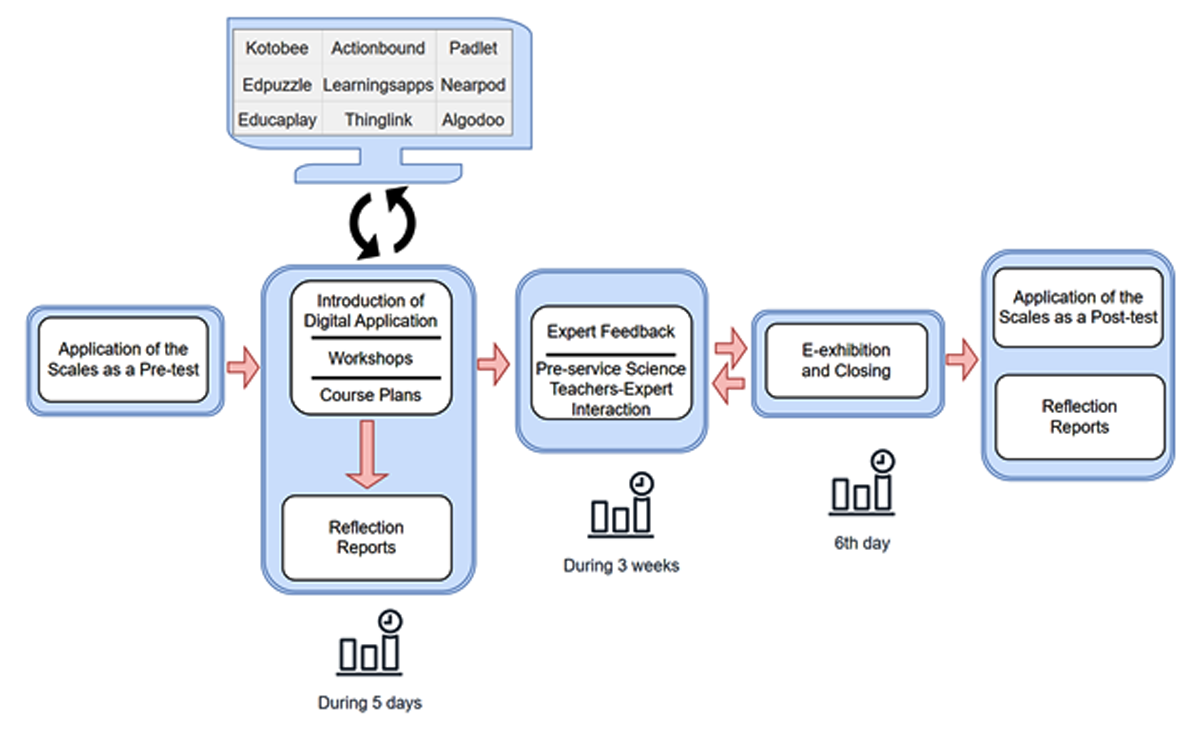
Figure 2
Implementation Process.
Table 2
Descriptive statistics results for mean self-efficacy scores of the pre- and post-tests.
| APPLICATION | N | SS | Min | Max | SKEWNESS | KURTOSIS | |
|---|---|---|---|---|---|---|---|
| DTeM pre-test | 53 | 3.88 | 0.575 | 2.29 | 4.97 | 0.373 | 0.635 |
| DTeM post- test | 53 | 4.58 | 0.401 | 3.68 | 5.00 | 0.740 | 0.691 |
| TIn pre-test | 53 | 4.00 | 0.514 | 2.89 | 5.00 | 0.566 | 0.430 |
| TIn post- test | 53 | 4.56 | 0.423 | 3.74 | 5.00 | 0.803 | 0.780 |
| ETS pre- test | 53 | 4.03 | 0.415 | 2.93 | 4.95 | 0.690 | 0.563 |
| ETS post- test | 53 | 4.81 | 0.299 | 3.95 | 5.00 | 0.950 | 0.967 |
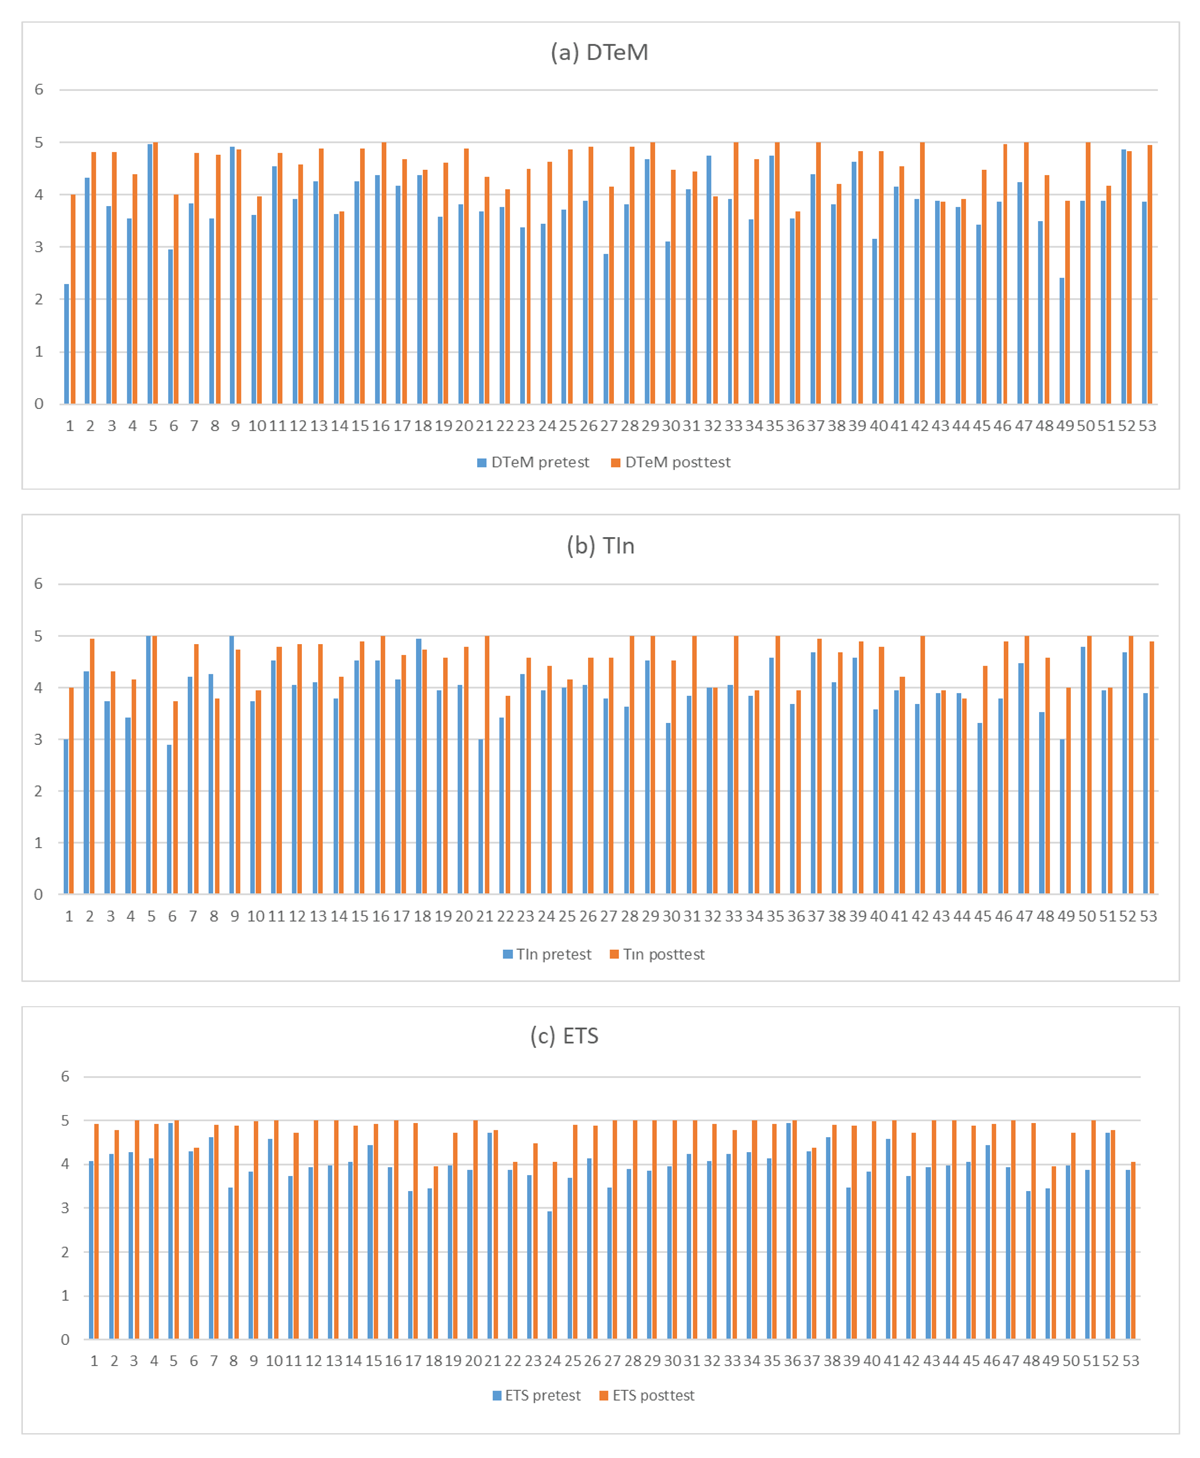
Graphic 2
The pretest and posttest score distributions of the scales: (a) DTeM, (b) TIn, (c) ETS.
Table 3
Dependent t-test analysis results between the mean scores of the scales.
| MEASUREMENT | N | s | t | sd | p | η2 | |
|---|---|---|---|---|---|---|---|
| DTeM pre-test | 53 | 3.88 | 0.575 | –10.036 | 52 | ,000 | 0,068 |
| DTeM post-test | 53 | 4.58 | 0.401 | ||||
| TIn pre-test | 53 | 4.00 | 0.514 | –8.599 | 52 | ,000 | 0,062 |
| TIn post-test | 53 | 4.56 | 0.423 | ||||
| ETS pre- test | 53 | 4.03 | 0.415 | –13.433 | 52 | ,000 | 0,078 |
| ETS post- test | 53 | 4.81 | 0.299 |
Table 4
PSTs’ opinions about the usage of DILMs in the learning environment effects on students
| CATEGORY | CODE | f | % |
|---|---|---|---|
| The usage of DILMs in the learning environment effects on students | Increasing active participation | 51 | 96.23 |
| Increasing motivation | 49 | 92.45 | |
| Arousing curiosity | 22 | 41.51 | |
| Learning difficult – abstract concepts | 7 | 13.21 | |
| Increasing academic success | 6 | 11.32 | |
| Improving positively attitude towards the course | 5 | 9.43 |
Table 5
PSTs’ opinions about the usage of DILMs effects on the learning environment.
| CATEGORY | CODE | f | % |
|---|---|---|---|
| The usage of DILMs effects on the learning environment | Willingness to use it in professional life | 51 | 96.23 |
| Increasing interactivity | 17 | 32.08 | |
| Providing technical support for teachers | 12 | 22.64 | |
| Providing technical support for students | 5 | 9.43 |
Table 6
PSTs’ opinions about the usage of DILMs in the learning environment effects on the learning process.
| CATEGORY | CODE | f | % |
|---|---|---|---|
| The usage of DILMs in the learning environment effects on the Learning Process | Drawing interest | 52 | 98.11 |
| Ensuring the retention of knowledge | 50 | 94.34 | |
| Making learning fun | 34 | 64.15 | |
| Learning by practicing and experiencing | 18 | 33.96 | |
| Encouraging learning | 10 | 18.87 | |
| Increasing motivation | 7 | 13.21 | |
| Providing alternative learning materials | 5 | 9.43 | |
| Relating to daily life experiences | 4 | 7.55 | |
| Providing reinforcement | 3 | 5.66 | |
| Learning by exploring | 2 | 3.77 | |
| Remedying misconceptions | 2 | 3.77 | |
| Identifying preliminary knowledge | 2 | 3.77 | |
| Providing evaluation | 1 | 1.89 | |
| Providing meaningful learning | 1 | 1.89 | |
| Developing scientific process skills | 1 | 1.89 | |
| Saving time | 1 | 1.89 |