
Introduction
Online learning has become increasingly prevalent and important in higher education. Online education offers many benefits such as flexibility, accessibility, and diversity (Barrot et. al, 2021), but also has many challenges, such as isolation, distraction, and disengagement (Al Rawashdeh et. al, 2021; Barrot et. al, 2021; Zalat et. Al, 2021). Considering that dropout rates are higher in distance education than in face-to-face education (Radovan, 2019; Quayyum et al., 2019), the question of how to keep students in the system comes to the fore. Allen and Seaman (2014) interviewed 4726 college and university leaders and 41% of the participants stated that it is much more difficult to retain students in online programs than in face-to-face education. When it comes to retaining students and improving the quality of learning, one of the factors that stands out in the literature is interaction. It is also one of the most researched topics in the field of open and distance learning (Zawacki-Richter & Bozkurt, 2022).
Interaction is considered by Wagner (1994) as reciprocal situations that require at least two objects and two events. Interaction is an important factor in providing a quality education in both distance education and face-to-face education environments. Moore (1993) stated that education without interaction would be just information transfer and mentioned three types of interaction in education: student-content interaction, student-instructor interaction, and student-student interaction. According to Moore, student-content interaction is when the student cognitively interacts with the content and changes the student’s understanding, perspective or cognitive structures in his/her mind. Student-faculty interaction is the instructor’s effort to teach, guide, support, encourage and motivate students (Einfeld, 2014). In student-student interaction, students interact with each other with the help of various tools, either planned or voluntarily, without the need for the presence of the instructor (Hawkins et al., 2011).
Interaction in online learning environments can be influenced by many factors. Some factors can be enablers and some can be inhibitors of interaction. For example, students with positive attitudes towards digital technologies and high technology knowledge are easier to manage online instructor, student and content interactions (Kayaduman et al., 2022). Similarly, Çebi (2023) determined that e-learning readiness affects interaction. In a structural modelling study with 172 postgraduate program students, Çebi (2023) determined that e-learning readiness is an essential predictor of interaction. The relationship between e-learning readiness and interaction was also revealed by Demir-Kaymak and Horzum (2013). Lasfeto and Ulfa (2020) on the other hand, revealed the existence of a positive relationship between self-directed learning readiness, one of the factors related to e-learning readiness, and social interaction.
As interaction is affected by some factors in online learning, it affects some variables. Satisfaction is one of the factors influenced by interaction. The concept of satisfaction refers to forming an emotional attitude towards a system and higher satisfaction makes a person more willing to exist in this system (Doll et. al, 2004; Kornpitack & Sawmong, 2022). Satisfaction is also important in determining the quality of online learning systems (Allen et al., 2002). Learners feel more satisfied when they perceive high interaction than when they perceive low interaction (Fulford & Zhang, 1993; Lee & Rha, 2009). Kuo et al. (2013) found that student-student, student-faculty and student-content interactions are predictors of online learning satisfaction. Student-content interaction alone explains a significant portion of satisfaction. In 2014, Kuo et al. found that student-student interaction was not a predictor of satisfaction. Parahoo et al. (2016), on the other hand, determined that interaction between students affected satisfaction. In addition, in Yang and Xu’s (2023) study, students stated that the most important factor for successful e-learning is student-faculty interaction.
Another phenomenon that affects satisfaction is e-learning readiness (Yükseltürk, 2009). It is extremely important to determine how ready students are for this system in order to realize e-learning successfully (Rasouli et al., 2016). Yurdugül and Demir (2017) defined the concept of e-learning readiness as “The degree to which an individual or institution has the prior knowledge/skills and affective characteristics (such as attitude, motivation) necessary to experience e-learning in the most effective way.” Yurdugül and Demir (2017) determined the dimensions of this variable as computer self-efficacy, internet self-efficacy, online communication self-efficacy, self-directed learning, learner control, and motivation towards e-learning in the e-learning readiness scale they developed. It will be more possible to understand what e-learning readiness means from these dimensions. Yılmaz (2017) determined that e-learning readiness predicted satisfaction in his study with 236 undergraduate students. A similar finding was also reached by Kırmızı (2015). As can be seen, satisfaction is affected by both interaction and e-learning readiness. E-learning readiness is also related to student interactions in online learning environments (Demir-Kaymak & Horzum, 2013).
From the section so far, it can be understood that the concepts of satisfaction, interaction, and e-learning are related to each other. Another factor that these three variables are related to in online learning is academic achievement. Academic achievement is seen as an important criterion to reveal the success of institutions. Therefore, what influences this factor is quite important. According to Rajabalee and Santally (2021), satisfaction has a weak but positive effect on students’ overall performance. Alzahrani (2022) also found that online student satisfaction has a significant and positive effect on students’ academic achievement. Kim et. al (2019) revealed that students’ e-learning adoption and digital readiness positively affect their academic achievement. Dikbaş Torun (2020) also questioned the relationship between e-learning readiness and academic achievement and found that two of the 6 dimensions of e-learning readiness (self-directed learning and motivation toward e-learning) predict academic achievement. The relationship between two factors that may be related to e-learning readiness (self-directed learning and readiness with acceptance of electronic learning) and academic progress was also proved by Khatib Zanjani et al. (2017). Yükseltürk and Bulut (2007) mentioned interaction as one of the factors necessary to ensure student success in online learning environments. In their study, instructor views also confirmed this argument. The findings of Yıldırım and Usluel (2022) also support this situation. As a result of their analysis based on students’ behavior in the system, the researchers found that students who interacted more with any component had higher achievement than those who interacted less. Contrarily Joksimović et al. (2015) found that students who interacted more with the content in the system had lower course grades.
As can be seen, the relationship between e-learning readiness, interaction, satisfaction and academic achievement has been revealed separately in many studies in the literature. However, some of these studies are modeling studies and some are relational studies based on correlation and regression. Therefore, although the existence of relationships between these variables has been revealed in independent studies, it would be useful to consider them holistically with a structural equation modeling, which eliminates errors and can reveal the relationships between many variables and the direction and magnitude of these relationships at the same time (Dursun & Kocagöz, 2010). As a matter of fact, while there may be a relationship between two variables in regression analysis, the relationship between variables may not be observed in structural equation modeling, which is a more advanced version of regression (Dursun & Kocagöz, 2010). Moreover one of the reasons that motivated the researcher to conduct this research is the suggestion emphasized in Çebi’s (2023) research. Çebi (2023) suggested that the effects of e-learning readiness and motivation on engagement have been investigated, but their effects on learning outcomes such as academic achievement and satisfaction would also be beneficial. In this context, the purpose of this study is to determine the relationships between e-learning readiness, interaction, satisfaction, and academic achievement in online learning environments. Determining these relationships will provide important clues for researchers and practitioners.
The hypotheses of the study are as follows:
H1. Students’ e-learning readiness positively affects perception of interaction
H2. Students’ e-learning readiness positively affects their satisfaction
H3. Students’ e-learning readiness positively affects their academic achievement
H4. Students’ perception of interaction positively affects their satisfaction
H5. Students’ perception of interaction positively affects their academic achievement
H6. Students’ satisfaction positively effects their academic achievement
Research Model
The purpose of this study, as grounded by the literature review in the previous section, is to determine the relationships between e-learning readiness, interaction, satisfaction and academic achievement in online learning environments. It is thought that the direct and indirect relationships between these variables will be revealed in the most reliable way with structural equation modeling. Structural equation modeling is a technique that enables to examine latent structures through observed variables. This technique helps to reveal direct and indirect relationships between variables (Raykov & Marcoulides, 2006). Structural equation modeling is a successful technique for testing complex models, can perform many analyses at once, and can recommend new arrangements, if any, for the relationships between variables. It also facilitates the examination of moderation effects (Dursun & Karagöz, 2010). For these reasons, structural equation modeling was used in this study to predict the hypothesized relationships between variables. The tested model is given in Figure 1.
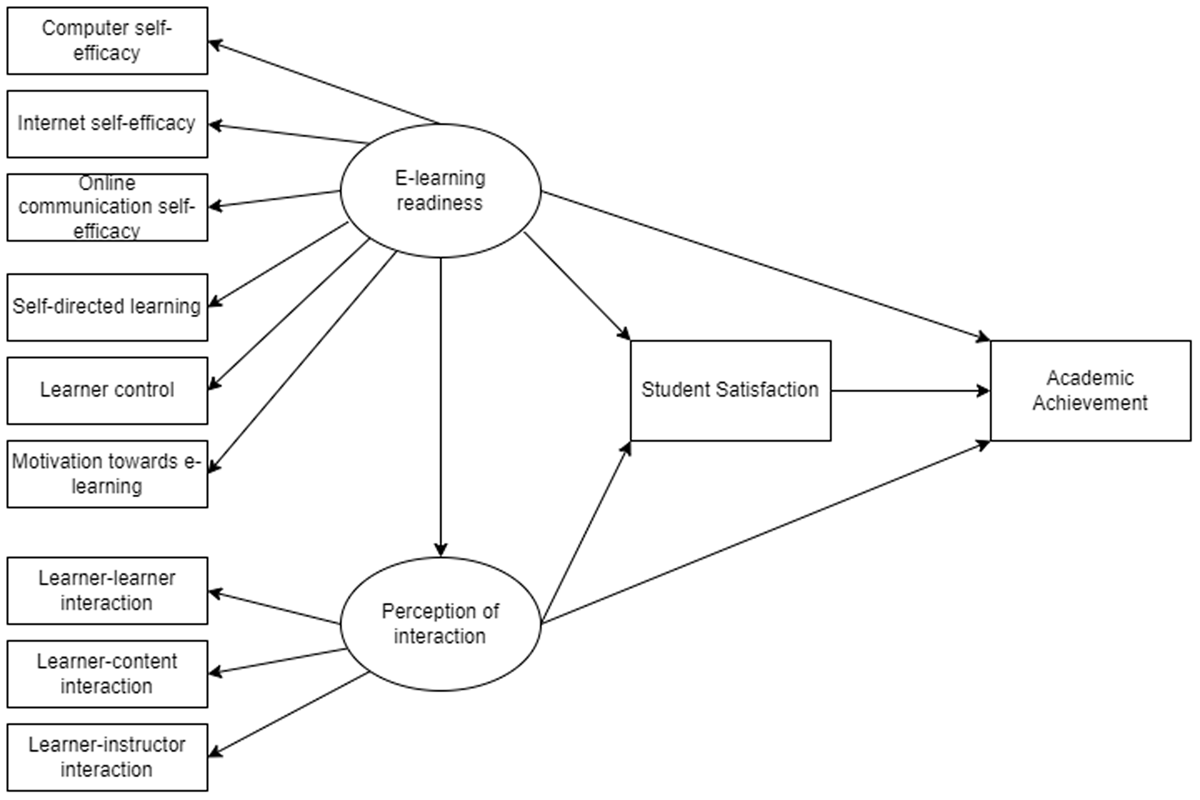
Figure 1
The hypotesized model for e-learning readiness, interaction, satisfaction and academic achievemet.
Method
In this study, correlational study design, one of the quantitative research models, was used. In correlational studies, the relationship between variables is tried to be determined (Fraenkel & Wallen, 2009). Creswell (2012) defines correlation as “a statistical test used to determine the tendency or pattern of consistent change between two (or more) variables or two sets of data”. In this study, it was aimed to determine the relationships between e-learning readiness, interaction, satisfaction and academic achievement.
Participants
A total of 212 students (138 undergraduate and 74 graduate students) from a state university participated in the study. The participants were determined by the convenience sampling method. Convenience sampling is based on the researcher determining the most appropriate option in terms of time and effort (Patton, 2014). In fact, 254 students completed the measurement tools, but 247 of them were determined to have usable data. The participants were 52 males and 160 females and their ages ranged from 19 to 47 (Mage: 24.06, SD: 4.31). The participants took open and distance learning (M: 72), undergraduate pedagogical formation - instructional technologies (M: 140) and graduate pedagogical formation - instructional technologies courses from the same instructor. Students from many departments such as child development, mathematics, Turkish language teaching, classroom teaching, recreation, music teaching, etc. took part in the study.
Instruments
The data of the study were obtained with E-learning Readiness Scale, Perception of Online Interaction Scale and Satisfaction Scale for Non-adaptive Online Learning Environment. Details about the measurement tools used in the study are given in the following headings.
E-learning readiness scale
Students’ e-learning readiness was measured using the E-learning readiness scale (Yurdugül & Demir, 2017). The scale consists of 33 items and six dimensions: computer self-efficacy, internet self-efficacy, online communication self-efficacy, self-directed learning, learner control, and motivation towards e-learning. There is another scale which was developed by Kalelioğlu and Baturay (2014) with dimensions similar to the dimensions of this scale in the Turkish literature. However, the scale developed by Yurdugül and Demir (2017) was preferred in this study because it is more up-to-date and the reliability of the scale dimensions is higher. The scale is a 7-point Likert scale. In this study, the total reliability of the scale was calculated as .92. The reliability of the dimensions varies between .78 and .93. Some items of the scale are given below:
I can easily use the application software (editor, design, etc.) I need (computer self-efficacy)
I can easily access the information I am looking for on the internet (internet self-efficacy)
I can easily express myself in written communication (emotions, humor, etc.) (online communication self-efficacy)
“I organize my current study plan according to the new conditions” (self-learning)
“I decide which of the online learning materials to focus on and how much” (learner control)
“I think it will be enjoyable to learn the lessons on the internet.” (motivation towards e-learning)
Perception of interaction scale
In the study, students’ perception of interaction was measured with an interaction scale for online environments developed by Bağıacık Yılmaz and Karataş (2018). Since the student group for which the data were collected received Turkish education, a Turkish scale was preferred. There is another reliable and valid interaction scale published in the literature, developed by Yılmaz and Keser (2015) for online environments, but this scale generally measures transactional distance. In this scale, general perception of the online environment and general perception of the online program can also be measured. However, since the current study focuses only on interaction, the interaction perception scale developed by Bağrıacık Yılmaz and Karataş (2018) was used. The interaction perception scale consists of three dimensions, student-student, student-instructor and student-content interaction, and has 30 items. The scale was developed according to a 5-point Likert scale. As a result of the analysis based on the data obtained in this study, the Cronbach’s Alpha reliability coefficient of the scale was calculated as .97. The reliability of the dimensions varies between .95 and .96. Some items of the scale are given below:
“I think that the feedback I receive from other students contributes to my learning” (student-student interaction)
“The instructor encourages us to question different ideas and perspectives” (student-instructor interaction)
“I think I will benefit from the materials in this course in the future” (student-content interaction)
Satisfaction Scale
It is possible to encounter various satisfaction scales in the literature; however, since this study was conducted with Turkish students, a Turkish scale was preferred. When Turkish scales are examined, it is seen that there are scales developed by Parlak (2004), Kukul (2011), Eryılmaz (2011), and Erdoğan (2013). However, when the items of the scales were analyzed, it was thought that the scale developed by Eryılmaz (2011) would be the most appropriate scale for the context of this study. One of the reasons for preferring this scale is that it questions the general structure of the course, interaction and satisfaction with the LMS together. The scale consists of 42 items and one factor and uses a 5-point Likert-type rating. Eryılmaz (2011) developed three different satisfaction scales for three different environments: no adaptation, content adaptation and navigation adaptation. In the current study, the “satisfaction scale for non-adaptive environment” was used. The Cronbach’s Alpha reliability coefficient of the scale consisting of one factor was determined as .97. Some items of the scale are given below:
“I had the opportunity to watch the course practically whenever I wanted.”
“The use of different teaching and learning methods in the course contributed to my learning.”
“This course met my expectations.”
Data collection process
The research was conducted with students taking undergraduate courses and pedagogical formation courses at a state university. All three courses within the scope of the research were held in one session once a week through the institution’s unique LMS system. The LMS uses Big Blue Button software as a video conferencing system. Students who were unable to attend the synchronous lectures were able to access the recordings of the lectures throughout the semester via the LMS system. Students were able to interact with the instructor and their friends both during and after the video conference. In all three courses, although not compulsory, activities that required interaction (discussing a topic in the forum, etc.) were included. In all three courses, students were required to develop digital content, but these products were not included in the evaluation. The lessons were conducted synchronously for 14 weeks and were supported with asynchronous content (video recordings, pdf, MS Word documents, etc.) via LMS. There was no planned intervention in the process. The exams of the courses were also conducted online via LMS. The data of the study were collected online at the end of the semester.
Data Analysis
Normality test was performed for each variable in order to test whether the research data were normally distributed. According to the results of the Q-Q pilot analysis, seven data that could deviate from the normal distribution were removed from the data set. After that the normality test results showed that the skewness and kurtosis values of the variables were ranged between –1.719 and +1.865 which are smaller than ±1.96 (Hair et al., 2009; Uttley, 2019) and the total c.r. value was below the critical value (10) as a result of the multivariate test. These results indicate that the data met all of the assumptions for the SEM. AMOS (version 24) statistical program was used to perform the normality test, to establish and test the research model and to obtain CFA fit indexes. Reliability, discriminant and correlation analyses of the study were conducted through SPSS 25.0 package program.
Findings
Correlations between Scales and Discriminant Validity
Correlations between E-Learning Readiness, Perception of Interaction and Satisfaction scores are presented in Table 1. Accordingly, satisfaction has positive but low relationship with perception of interaction (r = .376, p < .001) and e-learning readiness (r = .240, p < .001). However, no significant relationship was found between e-learning readiness and perception of interaction (r = .066, p > .05). These results can be considered as evidence of discriminant validity. Discriminant validity is an indicator of which latent variable (e.g. A) discriminates from other latent variables (e.g. B, C, D). Discriminant validity also means that a latent variables is able to explain more variance in the observed variables associated with it (Fornell and Larcker, 1981). Moderate positive correlations (range from .562 to .737, p < .001) between E-Learning Readiness Scale and its subscales and high positive correlations (range from .875 to .917, p < .001) between Perception of Interaction Scale and its sub-scales were calculated. There is a moderate relationship between satisfaction and student-instructor interaction (r = .404, p < .001) and student-content interaction (r = .435, p < .001). Furthermore, low relationships were found between satisfaction and internet self-efficacy (r = .162, p < .01), online communication self-efficacy (r = .143, p < .01), self-directed learning (r = .207, p < .001), learner control (r = .155, p < .01), motivation (r = .187, p < .001) and student-student interaction (r = .213, p < .001).
Table 1
Correlation coefficients of measurement tools.
| VARIABLES | 1 | 2 | 3 | 4 | 5 | 6 | 7 | 8 | 9 | 10 | 11 | 12 |
|---|---|---|---|---|---|---|---|---|---|---|---|---|
| 1. EL_Readiness | 1 | |||||||||||
| 2. Computer self-efficacy | ,638** | 1 | ||||||||||
| 3. Internet self-efficacy | ,562** | ,574** | 1 | |||||||||
| 4. Online communication self-efficacy | ,660** | ,454** | ,532** | 1 | ||||||||
| 5. Self-directed learning | ,737** | ,271** | ,273** | ,414** | 1 | |||||||
| 6. Learner control | ,694** | ,307** | ,367** | ,410** | ,710** | 1 | ||||||
| 7. Motivation | ,679** | ,208** | ,084 | ,176* | ,313** | ,263** | 1 | |||||
| 8. Perception of Interaction | ,066 | ,083 | ,199** | ,026 | ,033 | ,038 | –,003 | 1 | ||||
| 9. Student–student | ,079 | ,103 | ,179** | ,047 | -,003 | ,014 | ,042 | ,875** | 1 | |||
| 10. Student-instructor | ,030 | ,036 | ,181** | ,002 | ,045 | ,053 | –,056 | ,894** | ,606** | 1 | ||
| 11. Student-content | ,062 | ,071 | ,171* | ,012 | ,059 | ,041 | –,011 | ,917** | ,659** | ,857** | 1 | |
| 12. Satisfaction | ,240** | ,076 | ,162* | ,143* | ,207** | ,155* | ,187** | ,376** | ,213** | ,404** | ,435** | 1 |
Testing Structural Model
To assess the hypothesized model, confirmatory factor analysis (CFA) was performed with AMOS (version 24) statistical programme. While Figure 2 shows the hypothesized research model, Table 3 shows the hypothesis results, Table 4 shows direct, indirect and total effects and Table 2 shows the fit index of the research model.
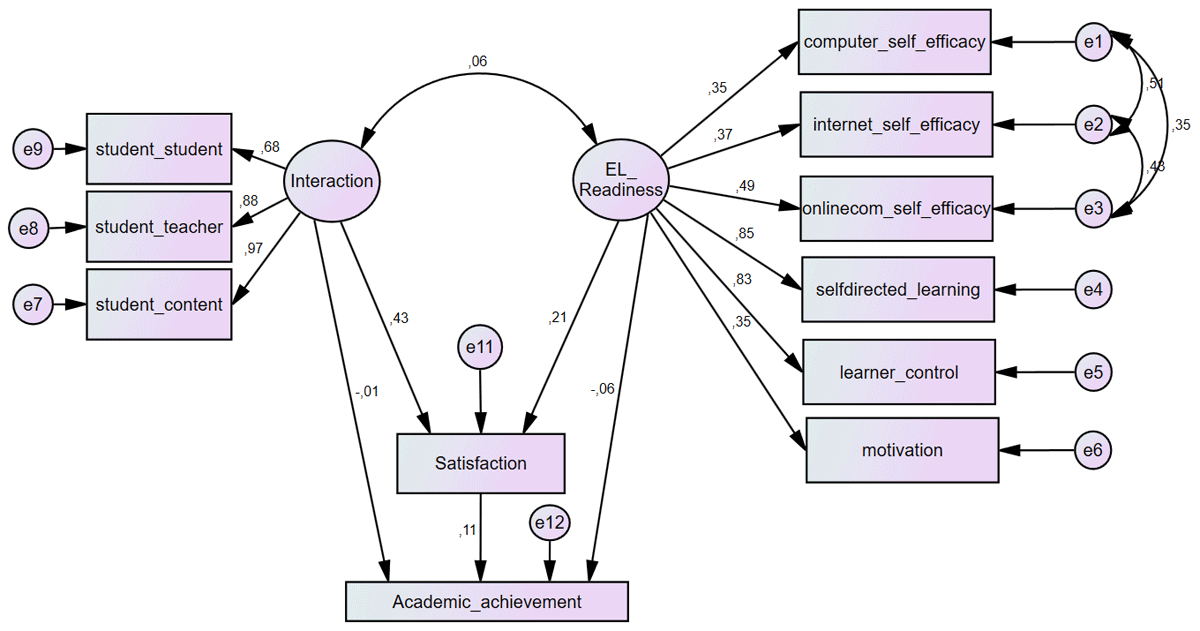
Figure 2
Hypothesized research model of satisfaction, interaction, e-learning readiness and academic achievement.
Table 2
Fit index of the hypothesis research model.
| FIT INDEX(EXAMINED) | PERFECT FIT RANGE | GOOD FIT RANGE | FIT INDEX(OBTAINED) | FIT STATUS |
|---|---|---|---|---|
| χ2/df | 0 ≤ x ≤ 2 | 2 ≤ x ≤ 3 | 1.36 | Perfect |
| RMSEA | .00 ≤ x ≤ .05 | .05 ≤ x ≤ .08 | .04 | Perfect |
| NFI | 95 ≤ x ≤ 1.00 | 90 ≤ x ≤ .95 | .95 | Perfect |
| CFI | 95 ≤ x ≤ 1.00 | 90 ≤ x ≤ .95 | .98 | Perfect |
| GFI | 95 ≤ x ≤ 1.00 | 90 ≤ x ≤ .95 | .96 | Perfect |
| AGFI | 95 ≤ x ≤ 1.00 | 90 ≤ x ≤ .95 | .93 | Good |
[i] RMSEA = root mean square error of approximation; SRMR = standardized root mean square residual; CFI = comparative fit index [CFI]; TLI = Tucker-Lewis Index.
The structural model established provided CMIN/DF, NFI, CFI, GFI, AGFI and RMSEA values. Below .08 for RMSEA fit index indicates perfect harmony between .90 and .95 for CFI, GFI, AGFI and NFI fit indexes indicates good harmony, and over .95 on these indexes is considered perfect harmony (Byrne 1998; West et al. 2012; Miles & Shevlin 2007). The details on the obtained fit index and evaluation criteria are shown in Table 2.
While the AGFI (.93) fit index of the model had good fit, the indexes of RMSEA (.04), NFI (.95) CFI (.98) and GFI (.96) had perfect fit. All these results show that the hypothesized research model had a near-perfect fit and confirmed.
The standardized path coefficients of the research model and significance levels for each hypothesis were obtained. Figure 2 shows that e-learning readiness (β = 0.205, p < 0.01) and interaction (β = 0.431, p < 0.001) had significant influence on satisfaction. However, e-learning readiness (β = -0.062, p > 0.05), interaction (β = -0.011, p > 0.05) and satisfaction (β = -0.114, p > 0.05) did not predict academic achievement. Furthermore, e-learning readiness and interaction did not significantly predict each other. (β = -0.019, p > 0.05) These results indicate that H2 and H4 hypothesis were supported whereas H1, H3, H5 and H6 hypothesis were not supported (Table 3).
Table 3
Results of the hypothesis tested.
| HYPOTHESIS | PATH OF HYPOTHESIS | SRβ | SE | C. R. | P | RESULTS |
|---|---|---|---|---|---|---|
| H1 | E-learning readiness <--> Interaction | .019 | .024 | .794 | .427 | Not supported |
| H2 | Satisfaction <--- E-learning readiness | .205 | .102 | 2.629 | ** | Supported |
| H3 | Academic ach. <--- E-learning readiness | –0.062 | 2.656 | –.797 | .425 | Not supported |
| H4 | Satisfaction <--- Interaction | .431 | .048 | 6.759 | *** | Supported |
| H5 | Academic ach. <---Interaction | –.0.011 | 1.543 | –.138 | .890 | Not supported |
| H6 | Academic ach. <--- Satisfaction | 0.114 | 2.064 | 1.440 | .150 | Not supported |
[i] SRβ: standardized regression; SE: standard error; **p < 0.01; *** p < 0.001.
Table 4 shows the standardized direct, indirect and total effects associated with the outcome and determinants. The total effect is the sum of the direct and indirect effects. The total effect size value which is greater than .5, should be considered large; between 3–5 should be considered moderate, between 1–3 small and anything smaller than .1 is insubstantial (Cohen, 1988). Accordingly, e-learning readiness and interaction had insubstantial indirect effect, and satisfaction had direct effect on academic achievement but not significant. Interaction is the dominant determinant of the satisfaction (total effect .431). The self-directed learning (.854) and learner control (.827) observed variables are the dominant determinant of e-learning readiness whereas student-content (.971) and the student-instructor (.884) observed variables are the dominant determinant of interaction.
Table 4
Direct, indirect and total effects of the research model.
| OUTCOME | DETERMINANT | STANDARDIZED ESTIMATES | ||
|---|---|---|---|---|
| DIRECT | INDIRECT | TOTAL | ||
| EL_Readiness | Computer self-efficacy | .348 | – | .348 |
| Internet self-efficacy | .374 | – | .374 | |
| Online communication self-efficacy | .494 | – | .494 | |
| Self-directed learning | .854 | – | .854 | |
| Learner control | .827 | – | .827 | |
| Motivation | .353 | – | .353 | |
| Interaction | Student-student | .678 | – | .678 |
| Student-instructor | .884 | – | .884 | |
| Student-content | .971 | – | .971 | |
| Satisfaction | EL-Readiness | .205 | – | .205 |
| Interaction | .431 | – | .431 | |
| Academic achievement | Satisfaction | .095 | – | .095 |
| EL-Readiness | – | .019 | .019 | |
| Interaction | – | .041 | .041 | |
Discussion
The main purpose of this study is to understand the relationship between students’ perception of interaction, e-learning readiness, satisfaction levels and academic achievement in online learning environments. Structural equation modeling was used to understand these relationships. According to the results of the study, as predicted in H2, e-learning readiness significantly predicts satisfaction positively. In other words, students with higher e-learning readiness and higher perception of interaction in online learning have higher satisfaction. It was also determined by Yılmaz (2017) and Yükseltürk (2009) that e-learning readiness predicts satisfaction. According to Yılmaz’s study (2017), as students’ e-learning readiness increases, the rate of satisfaction increases. Kırmızı (2015) determined that all of the sub-dimensions of e-learning showed a significant positive correlation with satisfaction. According to Wei & Chou (2020), students’ computer/internet self-efficacy and motivation directly affect satisfaction. In the current study, similarly, low correlation was found between internet self-efficacy, online communication self-efficacy, self-directed learning, learner control and motivation sub-dimensions and satisfaction. Based on this, it can be stated that the findings of the study are in line with the literature. Considering all these studies and the findings of the current study, it can be said that e-learning readiness is important to ensure student satisfaction in online learning environments. In other words, if students’ satisfaction is to be increased, their e-learning readiness should be determined at the very beginning of the process and individuals should be supported with trainings or counselling in necessary areas.
According to the stıdy results, another predictor of satisfaction is the perception of interaction. In this case, H4 is confirmed. Interaction perception is a determinant predictor of satisfaction. Student-content and student-instructor interactions predict satisfaction at a moderate level, while student-student interaction predicts satisfaction at a low level. These findings coincide with the findings of Ayanbode et al. (2022), Bağrıacık (2015), Sher (2009), Kuo et al. (2013), Kuo et al. (2014), Parahoo et al. (2016). As mentioned before, learning without interaction would be merely information transfer (Moore, 1993). However, Ayanbode et al. (2022) and Kuo et al. (2013) found that all dimensions of interaction predicted satisfaction. Whereas, Kuo et al (2014) found that only student-content and student-instructor interactions predicted satisfaction. Bağrıacık (2015) found that all three dimensions of interaction predicted satisfaction, but student-student interaction predicted satisfaction less than the other two interaction types. In the current study, student-student interaction was found to be a lower predictor than other types of interaction. Based on this, it can be said that interaction in online learning environments is important for student satisfaction, and student-instructor and student-content interactions stand out among the interaction types in terms of satisfaction.
First hypothesis of the study is rejected according to the research findings. There is no significant relationship between e-learning readiness and perception of interaction. This research finding contradicts some studies in the literature. Çebi (2023) determined e-learning readiness as an essential predictor of interaction. Similarly, Demir-Kaymak and Horzum (2013) revealed the relationship between e-learning readiness and interaction with a structural equation modeling study. This difference between the findings may be due to the sample size, the educational level of the participants or the analysis techniques applied. The measurement tools used in previous studies and this study and the educational levels of the participants are different. Çebi (2023) included the dimensions of “student-interface interaction” and “student-environment interaction” in the interaction variable in her study. Demir-Kaymak and Horzum (2013) used a scale adapted by the researchers but not published. It was stated that this scale measured the perception towards online courses, but details about the scale were not given. The e-learning readiness scale used in the aforementioned study is also different from the current study and its details are not available. In addition, both of the aforementioned studies were conducted with graduate students and the demographic structure is different from the current study. Another reason why the results of this study differ from the previous ones may be demographic variables and conditions. Zalat et al. (2021) determined that the e-learning readiness of academic staff differed according to demographic variables such as age, previous experience. Therefore, since e-learning readiness will be at different levels under different conditions, its relationship with interaction may also differ.
Another rejected hypothesis of the study is that e-learning readiness positively affects academic achievement. According to the results of the study, e-learning readiness does not predict academic achievement. These findings contradict Dikbaş Torun’s (2020) study, which determined that self-directed learning and motivation toward e-learning, two of the dimensions of e-learning readiness are predictors of academic achievement. Dikbaş-Torun also stated that although the existence of a relationship between e-learning readiness and academic achievement has been revealed in the literature, the results of the study may differ since the students in her study took the course compulsorily at a distance. As a matter of fact, as predicted, in Dikbaş-Torun’s study it was observed that some dimensions of e-learning did not predict academic achievement. However Khatip Zanjani (2017) found that self-directed learning and readiness with acceptance of electronic learning affect academic progress. According to Kim et al. (2019), e-learning adoption and digital readiness positively affect academic achievement as well. As will be seen in the next paragraph, according to the results of this study, interaction also does not predict academic achievement. Possible reasons for this situation are discussed in the following paragraphs.
Like e-learning readiness, interaction does not predict academic achievement. Therefore, H5 is also not supported. However, according to the results of the study, interaction increases satisfaction. It is expected that a student with high satisfaction will have high academic achievement (H6). As a matter of fact, Abuhassna et al. (2020) determined that the satisfaction of students with high interaction was high and the academic achievement of students with high satisfaction was high. Joksimović et al. (2015) found that student-student, student-instructor and student-system interactions positively affect learning outcomes, but student-content interactions negatively affect final course grade. Yıldırım and Usluel (2022) determined that students with high interaction with any component in the system, including content, achieved higher success than those with low interaction. According to Hawkins et al. (2011), the effect of student-instructor interaction on academic achievement is minimal. Therefore, according to the literature, interaction affects satisfaction and satisfaction affects academic achievement. There are also various findings that interaction or the dimensions of interaction directly affect academic achievement.
The contradictions in findings between the literature and the current study may be due to many reasons. Findings can be influenced by many variables, from what is taken as the basis for academic achievement (course complementation, GPA, etc.) to the reliability and validity of the measurement tool applied, to the environment in which the exam is administered. As a matter of fact, in online exams, students can take exams under very different conditions. Many situations such as using a mobile device, the quality of the internet connection, having a suitable exam environment, etc. can affect the course grades. In addition to these, reliability is a common problem in online exams. In Akıncı and Tunç’s (2021) study, pre-service teachers emphasized that students are more likely to cheat in online exams and that the evaluation may be unfair. Çabı’s (2016) study also supports this view. Pre-service teachers stated that the possibility of cheating is higher in online exams. According to Hillier’s (2014) research results, students believe that it is easier to cheat in online exams. In Acar-Güvendir & Özer-Özkan’s (2021) study, students made very striking statements about the reliability of exams. Accordingly, students who do not think of cheating in face-to-face exams cannot resist the temptation to cheat in online exams because the documents are right next to them. In this situation, students are completely alone with their conscience. Therefore, a student who interacted with the instructor and the content, is satisfied with the learning process, and studied for the exam may have gotten a low grade because the internet was slow, while a student who took the exam in a very comfortable environment and did not study at all may have gotten a high grade by cheating. In addition, in this study, students’ academic achievement was determined based on a single multiple-choice exam. Since the number of students per instructor was too high and some students had almost no access to the internet and electronic devices due to the earthquake disaster in Türkiye, no process or product evaluation could be conducted. This is one of the limitations of the study, as will be mentioned in the next section. However, in one of the studies in which satisfaction was found to be a predictor of academic achievement (Abuhassna et al., 2020), many variables, including students’ interactions with the system, were employed when calculating academic achievement. Besides, Çebi (2023) found a relationship between e-learning readiness and academic achievement and made calculations based on students’ scores obtained from face-to-face exams. Similarly, Yıldırım and Usluel (2022) determined academic achievement based on paper pencil based exams and many activities during the semester. Therefore, when all these are considered holistically, it can be said that academic achievement score can be affected by many factors, not all variables are controlled at the same time and therefore it is possible to obtain different results in different studies.
Conclusion, Limitations and Suggestions
In this study investigating the relationship between e-learning readiness, perception of interaction, satisfaction and academic achievement in online learning environments, it was determined that e-learning readiness and interaction predicted satisfaction, interaction was the dominant predictor of satisfaction, and e-learning readiness, interaction and satisfaction had no significant effect on academic achievement. The first lesson that can be drawn from this research is that online learning environments should focus on variables that increase interaction. Distance education institutions may be recommended to provide pedagogical trainings (if not already provided) to instructors on the types of interaction and how it can be increased in order to increase the satisfaction of their students. However, in the study, it was determined that students gave more importance to student-instructor and student-content interactions in terms of satisfaction. Therefore, measures can be taken to increase students’ interaction with instructors. For example, by determining which interaction tools students prefer to interact with their instructors more, the preferred tools can be utilized or the tools those are not preferred can be improved. The adequacy of LMSs used in institutions in terms of instructor-student interaction can be questioned in future research or by institutions. The ways in which instructors interact with students and how adequate this interaction is in the eyes of students is another issue that needs to be questioned.
In terms of student-content interaction, it can be investigated to what extent the content offered to students is sufficient. In Bayır et al. (2022), students stated that they could not access synchronous courses due to various technical problems, but these courses were not recorded asynchronously either. Since it is clear that interaction with content has an impact on student satisfaction, institutions and instructors should question the quality of their own content. Some rules can be set on an institutional basis to make the content more interactive, and furthermore, a content development unit can be established in each institution and some arrangements can be made to help instructors to make their content more interactive. The reason why student-student interaction lags behind the others may be due to the fact that adult learners are achievement-oriented. As a matter of fact, since adult students already have their own social environment, they may not feel the need to socialize again in the course and to do collaborative activities with others (Yılmaz, 2020). For this reason, it can be suggested that students’ personal characteristics and preferences should be determined at the beginning of the semester and in-class activities should be shaped accordingly.
Secondly, since students’ readiness for e-learning affects their satisfaction. It is expected that a student who is ready for e-learning will experience fewer problems in the system, organize his/her own learning more easily and communicate more easily with others. At this point, institutions have some responsibilities. It can be suggested that institutions should determine students’ e-learning readiness at the beginning of the semester, even as soon as they register students to the system. As a matter of fact, students’ characteristics in the sub-dimensions of e-learning readiness such as digital literacy and self-regulation may even cause them to leave the institution (Bağrıacık Yılmaz & Karataş, 2022). After determining the e-learning readiness levels of students, institutions can be advised to provide training and counselling to students who are deemed necessary.
It is thought that the main reason for the lack of a significant relationship between students’ academic achievement and e-learning readiness, interaction and satisfaction may be due to the insufficient reliability of the exam, such as not being able to authenticate (eye scanning, etc.), not being able to see the student’s behaviour during the exam, etc., although the institution has taken serious measures such as asking mixed sequential questions, not being able to return to the previous question, limited exam time, not being able to click outside the exam window. This is also a limitation of the study. For this reason, it may be recommended to take advanced security measures during the exams if possible and if not, to conduct the exam face-to-face or to conduct process and/or product evaluation. In order to conduct process and product assessment, the amount of students per instructor should be well adjusted. In this regard, researchers may be advised to question the relationship between the variables in this study by conducting exams in an environment where reliability is assured in future studies.
One of the limitations of this research is that it coincided with a period of sudden decisions taken after a major earthquake in Turkey. It was not compulsory to attend the courses and follow the asynchronous contents specific to the period in question in the institution that the research was conducted. It may be recommended to repeat the research in a period without a crisis situation against the possibility that there are students who would interact much better if appropriate conditions were provided, who would have high satisfaction with the course, and who could achieve different results in terms of academic success.
Data Accessibility Statement
The datasets used and/or analyzed during the current study are available from the corresponding author on reasonable request.
Ethics and Consent
For this study, official permission was obtained from the ethics committee of the institution where the data were collected.
Competing Interests
The author has no competing interests to declare.
Author Contributions
Conceptualization, A.B.Y; methodology, A.B.Y; software, A.B.Y; formal analysis, E.Y., A.B.Y; investigation, A.B.Y; data curation, A.B.Y; writing—original draft preparation, A.B.Y; writing—review and editing, A.B.Y; visualization, A.B.Y; project administration, A.B.Y. The author have read and agreed to the published version of the manuscript.