
Table 1
Proportions of respondents reporting each formal disability category.
| DISABILITY CATEGORY | NUMBER OF RESPONDENTS |
|---|---|
| Mental health issues, such as depression, anxiety, bipolar or PTSD | 77 (56.2%) |
| Fatigue | 67 (48.9%) |
| Unseen disability, for example diabetes, epilepsy or asthma | 55 (40.1%) |
| Mobility is restricted | 54 (39.4%) |
| Manual skills | 35 (25.5%) |
| Specific learning difficulties (such as dyslexia or dyspraxia) | 34 (24.8%) |
| Autism | 33 (24.1%) |
| Deaf or hard of hearing | 21 (15.3%) |
| Other | 12 (8.8%) |
| Blind or partially sighted | 11 (8%) |
| Speech impairment | 4 (2.9%) |
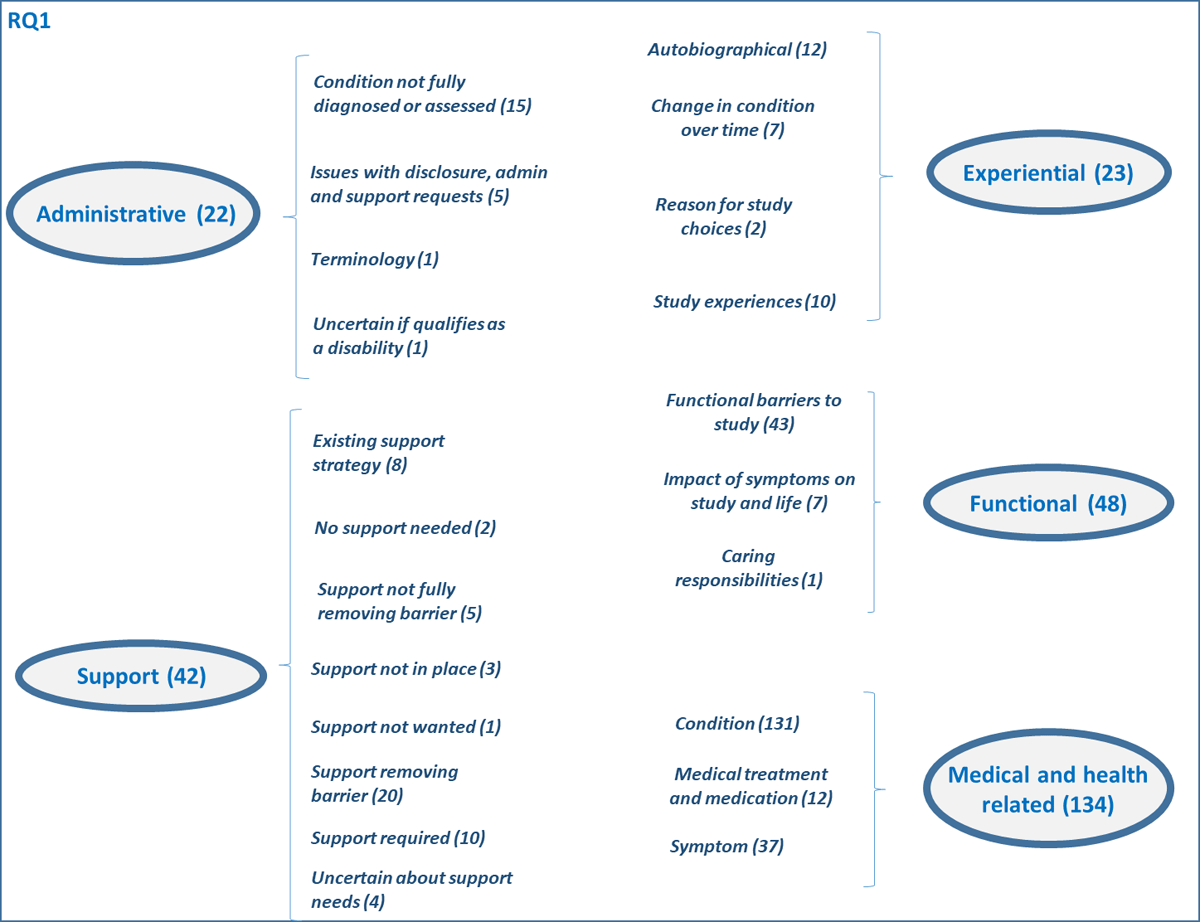
Figure 1
Themes identified in students’ disability descriptions and the number of cases.
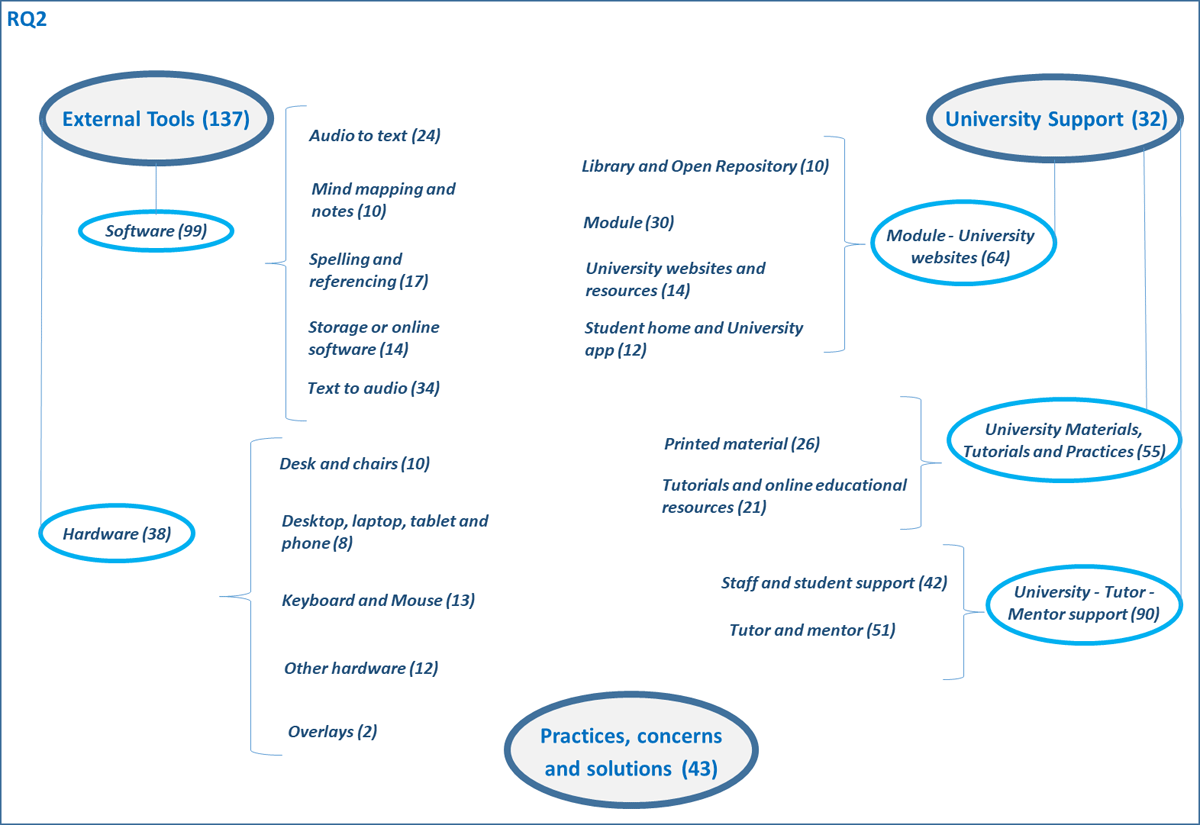
Figure 2
Themes identified in students’ suggestions and the number of cases.