
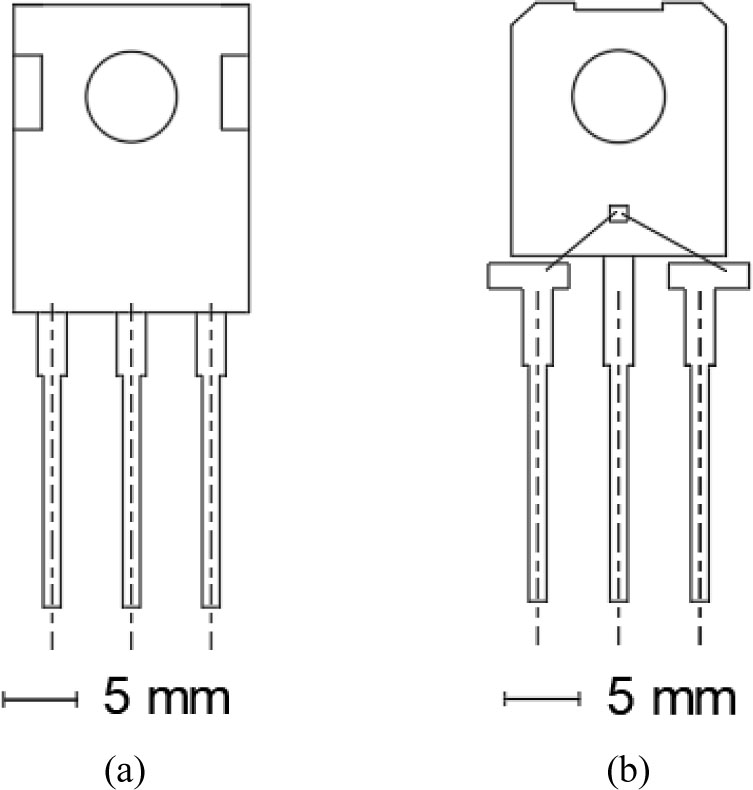
Fig. 1.
Package dimensions of the C2M0280120D transistor: (a) external dimensions and (b) internal dimensions (view after epoxy mold compound removal).
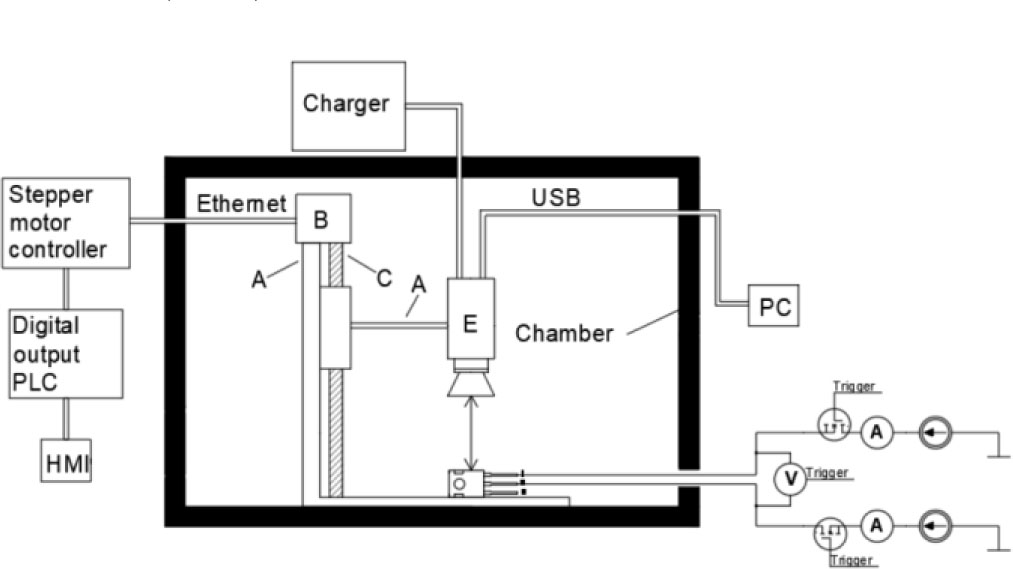
Fig. 2.
The diagram of the measurement circuit. A – the tripod, B – the stepper motor, C – the screw, E – the thermographic camera.
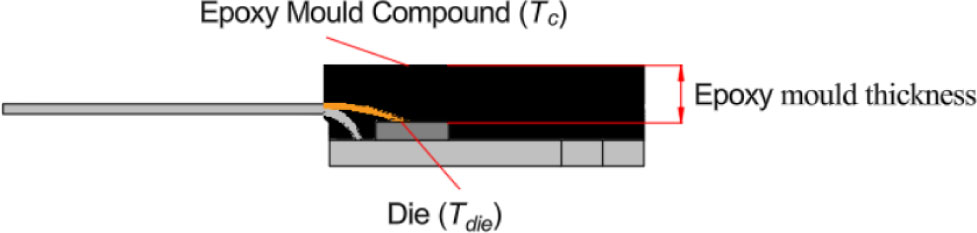
Fig. 3.
C2M0280120D package. Tc – thermographically measured temperature of the epoxy mold compound above the die. Tdie – temperature of the top surface of the die determined based on simulation studies.
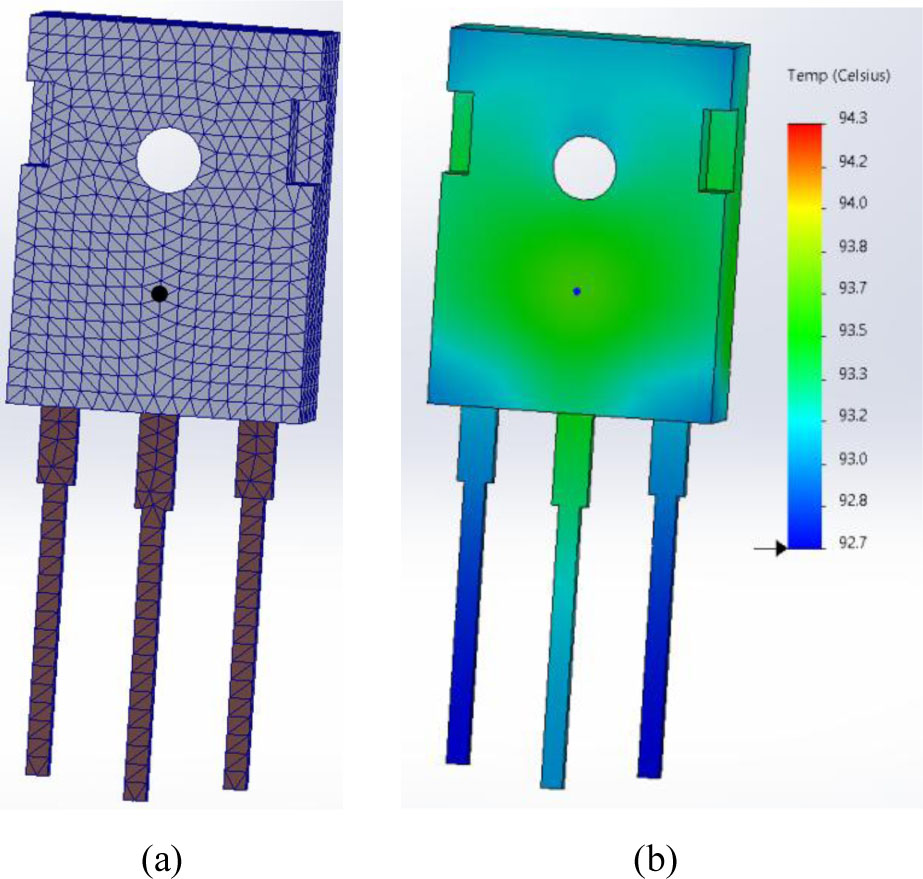
Fig. 4.
(a) The obtained model with the applied finite element mesh and the point at which the case temperature was measured, (b) simulation result of the C2M0280120D transistor obtained in SolidWorks, showing the resulting temperature distribution and the point at which the case temperature was measured (Tc value converted to °C).
Table 1.
The materials used in the developed model, along with their corresponding thermal conductivity coefficients k [13], [14], [15].
| Internal structure component | Material | k [W/m·K] |
|---|---|---|
| Black part of the case | EME 590 | 0.25 |
| Back part of the case | Copper | 400 |
| Semiconductor element | Silicon carbide | 150 |
| Lead, Internal connections | Copper | 400 |
| Grease | Melamine resin | 0.20 |
Table 2.
Mesh element size and the corresponding duration of the simulation.
| No. | Mesh element edge length [mm] | Simulation time [s] | ΔTcs [s] |
|---|---|---|---|
| 1 | 2.0 | 5 | 0.4 |
| 2 | 1.5 | 10 | 0.2 |
| 3 | 1.0 | 20 | 0.1 |
| 4 | 0.5 | 211 | 0.1 |
| 5 | 0.2 | 1455 | 0.1 |
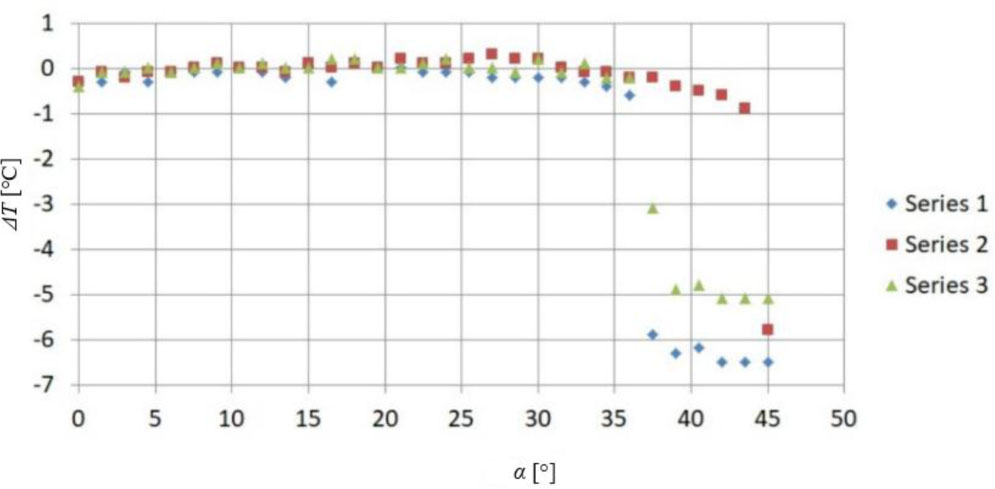
Fig. 5.
Relationship between ΔT and the angle α.
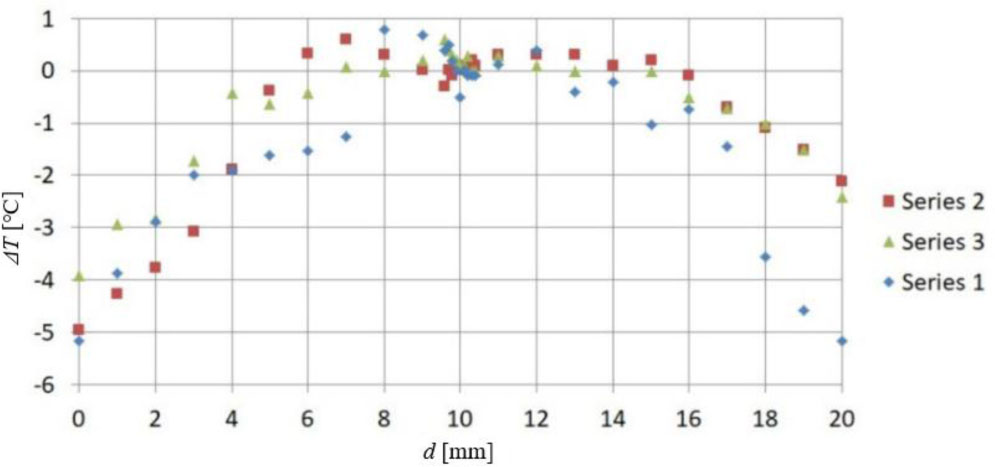
Fig. 6.
Relationship between ΔT and the distance d.
Table 3.
Example uncertainty budget for an indirect thermographic measurement die with Tc=90 °C.
| Symbol xi | Unit | Estimate of quantity xi | Standard uncertainty u(xi) | Distribution of probability | Sensitivity coefficient c | Contribution of uncertainty ui(y) |
|---|---|---|---|---|---|---|
| τa | - | 0.9987 | 0.0010 | normal | 0.4488 | 0.0004 |
| Wtot | W/m2 | 0.1554 | 0.0066 | rectangular | 67.7701 | 0.4472 |
| ɛ | - | 0.97 | 0.0086 | rectangular | −7.6450 | −0.0657 |
| Trefl | °C | 30 | 2.8868 | rectangular | 0.0119 | 0.0344 |
| τl | m | 0.95 | 0.0289 | rectangular | −10.3189 | 0.2982 |
| Ta | °C | 26.5 | 4.9000 | rectangular | −0.0151 | −0.0740 |
| Tl | °C | 26.5 | 4.9000 | rectangular | −0.0151 | −0.0740 |
| Tus | °C | 3.25 | 1.88 | normal | 1 | 1.63 |
| Tc | °C | 90 | 3.25 |
Table 4.
Type B uncertainty values for different temperatures Tc ranging from 30 °C to 120 °C.
| No. | Tc [°C] | u(Tc) [°C] |
|---|---|---|
| 1 | 30 | 1.63 |
| 2 | 60 | 2.44 |
| 3 | 90 | 3.25 |
| 4 | 105 | 4.21 |
| 5 | 120 | 5.17 |