
In today's energy-constrained world, accurate fluid flow measurement is becoming increasingly critical across sectors such as process control, energy management, resource allocation, and environmental protection. Precise flow measurement plays a key role in enhancing production efficiency, reducing energy consumption, optimizing resource utilization, and supporting sustainable development.
Differential pressure flowmeters are widely recognized for their broad applicability, high measurement accuracy, ease of installation and maintenance, as well as their excellent pressure resistance, stability, and reliability. These characteristics make them common instruments in both industrial and experimental settings. It is estimated that at least 40% of the industrial flowmeters currently in operation are of the differential pressure type, with orifice flowmeters being among the most frequently used [1]-[2].
The orifice plate flowmeter primarily consists of a throttling orifice plate, a differential pressure transmitter, and a display unit. It calculates the fluid flow rate within a pipeline by measuring the differential pressure across the orifice plate. This design is simple, with no moving parts, offering durability and requiring little to no calibration, making it highly effective in industrial applications [3],[4],[5],[6]. However, frictional effects and flow separation that occur as the fluid passes through the orifice plate lead to inherent pressure losses, which can affect the metrological performance of the flowmeter. Additionally, the accuracy of orifice plate flowmeters is influenced by upstream flow conditions, typically necessitating a sufficiently long upstream straight pipe section to ensure fully developed flow [7].
Orifice plates are widely used as differential-pressure devices due to their simple structure and well-established metering practice. The influence of the Reynolds number (Re) on discharge characteristics has been repeatedly highlighted in the literature. Hollingshead et al. [8] compared several differential-pressure meters at low Reynolds numbers and reported noticeable deviations in discharge coefficient performance as the Reynolds number decreased. With the growing adoption of computational fluid dynamics (CFD) in flowmeter research, Shah et al. [9] performed CFD simulations of an orifice meter and discussed how separation and turbulence modeling affect the predicted pressure drop and discharge behavior. In parallel, recent reviews have summarized the parametric influences, including thickness-related parameters, on orifice plate metering performance and associated uncertainties, indicating that geometric definition and parameter sensitivity remain active research topics [10].
Beyond conventional sharp-edged configurations, geometric refinements have been explored to reduce permanent pressure loss while maintaining metering performance. Yu et al. [11] investigated the influence of orifice chamfering on flow-field characteristics and demonstrated that chamfer geometry can alter downstream flow structures. Thickness-related effects have also been discussed in the context of throttling plates and orifice elements. Maynes et al. [12] experimentally examined perforated plates of varying thickness and showed that thickness can significantly affect head loss and cavitation inception. Siba et al. [13] modeled three-dimensional flow through an orifice plate at low turbulent Reynolds numbers, providing additional evidence that geometric parameters can influence internal flow development. More recently, Ai and Zhu [14] conducted correction and laboratory investigations on the energy loss coefficient of square-edged orifice plates, confirming the continued interest in loss characterization and calibration. Gulsacan et al. [15] conducted an experimental and numerical investigation of the effect of the thickness-to-diameter ratio on turbulent orifice flow and reported detailed changes in downstream flow structures associated with thickness variations. On the validation side, Tomaszewska-Wach and Ligus [16] compared PIV measurements with CFD predictions using different turbulence models for a measuring orifice, highlighting the sensitivity of turbulence models and the need for validation for reliable predictions. From a standards perspective, ISO 5167-2:2022 specifies geometric requirements for orifice plates and includes explicit terminology related to edge thickness and beveling [17]. However, despite the above progress, systematic investigations focusing on chamfered orifice plates that quantify the coupled influence of orifice bore thickness e and Reynolds number on pressure-loss behavior remain limited. This motivates the present CFD-based parametric study, which examines the coupled roles of α, e, and h on pressure loss characteristics and the associated flow structures.
| Nomenclature and abbreviations | |
|---|---|
| Latin letters | |
| D | Pipe inner diameter [m] |
| d | Orifice (bore) diameter [m] |
| h | Orifice plate thickness [m] |
| e | Orifice bore thickness after chamfering [m] |
| U | Inlet mean velocity [m·s−1] |
| P | Static pressure [Pa] |
| ΔP | Differential pressure across the orifice plate [Pa] |
| Δπ | Permanent pressure loss [Pa] |
| Cd | Discharge coefficient |
| Greek letters | |
| α | Upstream chamfer (bevel) angle [°] |
| β | Diameter ratio, β = d/D |
| μ | Dynamic viscosity [Pa·s] |
| ν | Kinematic viscosity [m2·s−1] |
| ρ | Density [kg·m−3] |
| ξ | Pressure loss coefficient |
| Dimensionless groups | |
| Re | Reynolds number, Re = ρUD/μ |
| t | Relative plate thickness, t = h/d |
Previous studies have confirmed that geometric parameters can significantly affect the hydraulic performance of orifice plates. Some investigations considered the role of plate thickness on velocity, pressure, and loss behavior. However, for chamfered orifice plates, the literature has more often emphasized the influence of the chamfer angle α, whereas the effect of the orifice bore thickness e and its coupled influence with the Reynolds number on the pressure-loss behavior has been reported less systematically. In addition, ISO 5167 provides qualitative recommendations on chamfering but does not specify detailed chamfer geometries, which motivates further parametric investigations.
Therefore, this study uses CFD simulations to investigate the coupled effects of plate thickness h and upstream chamfer geometry on the pressure loss coefficient of throttling orifice plates over a range of Reynolds numbers. The focus is on the pressure loss coefficient at varying Reynolds numbers and on clarifying the roles of the chamfer angle α, and orifice bore thickness e through their associated flow structures.
The orifice plate is the core component of the flowmeter, typically a metallic plate with a circular aperture, as shown in Fig. 1. When the fluid medium enters the upstream section of the pipe, fully developed flow is established due to the fluid's viscosity and boundary layer effects. Orifice plates are primarily designed for use in fully developed flow. As the fluid approaches the orifice plate from upstream, the streamlines converge, increasing fluid velocity and kinetic energy while decreasing pressure potential. Due to inertia, the maximum fluid velocity occurs at a specific downstream position of the orifice plate, where the flow reaches its highest velocity, the jet cross-section is at its narrowest, and the pressure is at its lowest. This position is known as the vena contracta or contraction section. Beyond the vena contracta, the fluid begins to expand, gradually filling the entire pipe, and fully developed flow is re-established at a certain downstream point. During this expansion phase, both velocity and kinetic energy decrease, while pressure potential increases. Additionally, a backflow phenomenon occurs downstream of the orifice plate during fluid expansion, generating vortices.
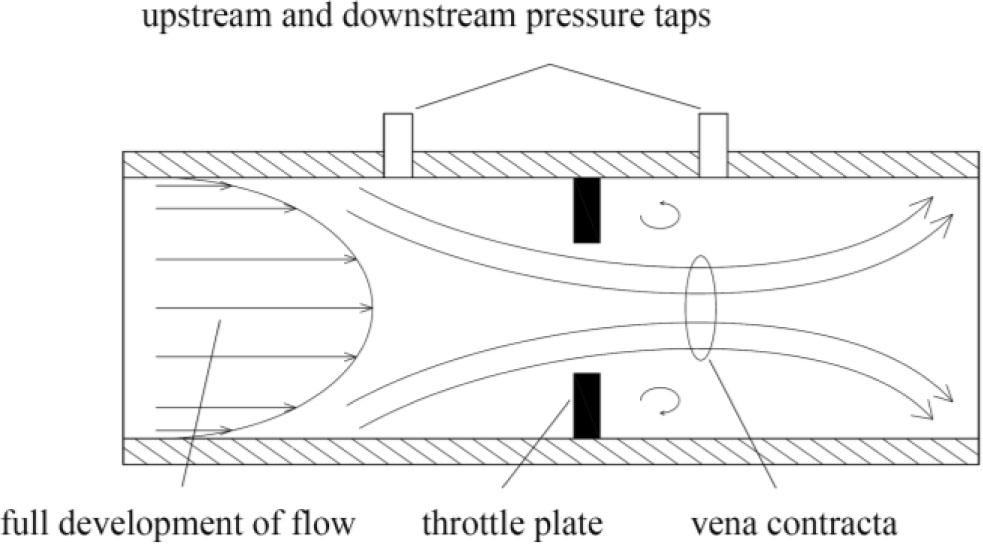
Schematic diagram of a throttling orifice plate.
In this study, to examine the influence of chamfered structures on the flow characteristics of the orifice plate, an orifice plate was modeled as shown in Fig. 2. The pipe diameter is denoted as D, the orifice diameter is denoted as d, and the orifice plate thickness is represented by h (Fig. 2(b)). To ensure that the upstream flow reaches a fully developed state and that the downstream flow stabilizes, the lengths of the straight pipes upstream and downstream of the orifice plate were both set to 10D (Fig. 2(a)). The pressure taps used to define the differential pressure across the orifice plate are indicated by tu and td in Fig. 2(b). The chamfered edge structure of the orifice plate investigated in this study is illustrated in Fig. 3, where e denotes the orifice bore thickness, and α represents the chamfer angle.
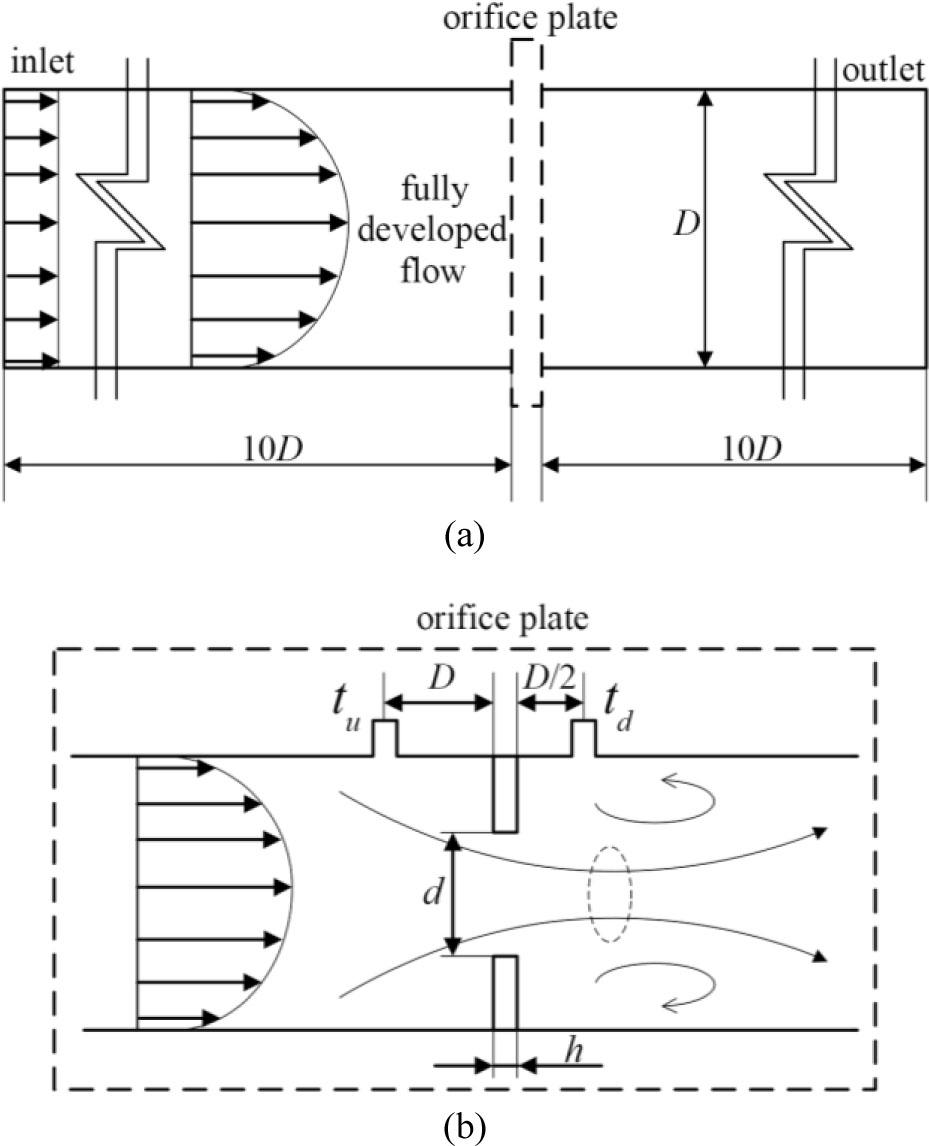
Computational setup for the chamfered orifice plate simulations: (a) computational domain with straight pipe extensions of 10D upstream and 10D downstream; (b) local schematic of the orifice plate region, showing the geometric parameters and pressure tap locations used to define ΔP (upstream tap tu and downstream tap td).
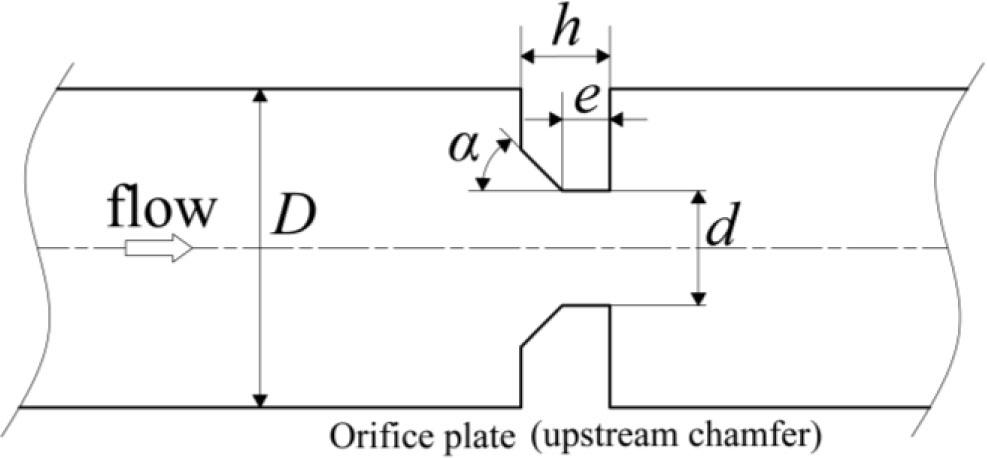
Geometric definition of a chamfered orifice plate: pipe diameter D, orifice diameter d, plate thickness h, orifice bore thickness e, and chamfer angle α.
In this study, a single-hole throttle orifice plate with a diameter of D = 50 mm was chosen as the research object. The fluid medium used was liquid water at standard temperature and pressure (300 K, and 0.1 MPa), with a density ρ = 1.0 × 10³ kg/m3 and dynamic viscosity μ = 1.01 × 10⁻³ Pa·s. The inlet boundary was set as a uniform velocity inlet, with velocities of 0.25 m/s, 0.5 m/s, 1.0 m/s, 1.5 m/s, and 2 m/s, corresponding to Reynolds numbers of 12376, 24752, 49505, 74257, and 99010, respectively. The outlet boundary was specified as a pressure outlet with a gauge pressure of 0 Pa. The wall boundary was treated as a no-slip condition, with a turbulence intensity of 5 % and a turbulence viscosity ratio of 10 %.
As a mature commercial solver software, Fluent finds widespread application in the field of fluid dynamics and delivers outstanding performance in numerical simulations of orifice plates. Consequently, Fluent was selected for the numerical analysis of the flow field in this study. Assuming incompressible flow, the SIMPLE algorithm was employed for the solution procedure. For turbulence modeling, the Standard k-ɛ model was chosen. This model introduces an additional equation for the turbulent dissipation rate ɛ, based on the equation for turbulent kinetic energy k, thereby forming a two-equation model. The Standard k-ɛ model has been extensively used in CFD studies of throttle orifice plates and has produced reliable results. Therefore, it was deemed appropriate for the numerical analysis in this study. The governing equations are as follows:
Continuity equation:
(1) {{\partial \rho} \over {\partial t}} + \nabla \cdot (\rho U) = 0 Momentum equation:
(2) where ρ denotes the fluid density, T represents time, U is the fluid velocity vector, δ is the Kronecker delta, μ is the fluid dynamic viscosity, p is the static pressure, and SM refers to the momentum source term.{{\partial (\rho U)} \over {\partial t}} + \nabla \cdot (\rho U \times U) = \nabla \cdot (- p\delta + \mu (\nabla U + {(\nabla U)^T})) + {S_M}
k-ɛ equation:
In this equation, k represents the turbulent kinetic energy, ɛ is the turbulent dissipation rate, and Cɛ1, Cɛ2, σk, and σɛ are the constants of the standard k-ɛ turbulence model, with values of Cɛ1 = 1.44, Cɛ2 = 1.92, σk = 1.00, and σɛ = 1.3, respectively. The turbulent viscosity, μt, is expressed as:
The mesh density plays a critical role in the accuracy of CFD simulations [18]-[19]. In general, the numerical accuracy improves with increasing mesh resolution provided that adequate mesh quality is maintained; however, beyond a certain refinement level, the gain in accuracy becomes marginal while the computational cost increases significantly. Therefore, an appropriate meshing strategy balancing accuracy and efficiency is required.
In this study, ANSYS Fluent Meshing was used to generate the computational mesh using a poly-hexcore approach. The meshing procedure is illustrated in Fig. 4. First, a global mesh was generated for the entire fluid domain. Then, local refinement was applied to regions with strong gradients and complex flow features using the body of influence (BOI) method, with particular emphasis on the vicinity of the orifice plate and the near-wake region where jet contraction, separation, and recirculation occur. In addition, since steep velocity and pressure gradients develop near solid boundaries, prism layers were generated along the pipe wall and the orifice bore to improve near-wall resolution and capture boundary layer behavior. The simulations employed the standard k-ɛ turbulence model with standard wall functions, the inflation layer parameters were designed to maintain wall y+ values within the recommended range across the investigated Reynolds numbers. A mesh independence study was conducted to determine the final mesh resolution and is reported in the next section.
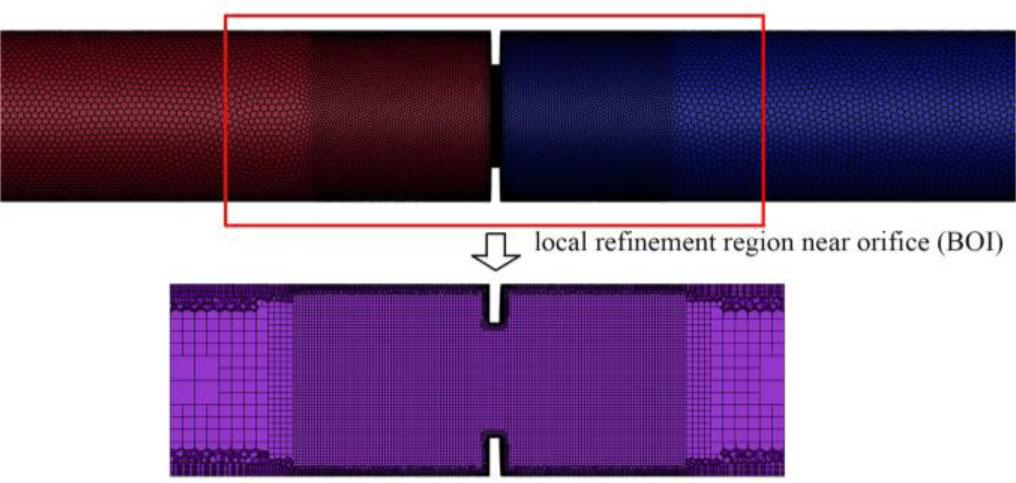
Poly-hexcore mesh and local refinement strategy for the orifice plate simulations.
The credibility of CFD predictions depends on both numerical resolution and the capability of the adopted model to reproduce benchmark flow metering characteristics. Accordingly, numerical credibility is established through a mesh sensitivity assessment and an independent benchmark of the discharge coefficient Cd against ISO 5167 reference values. A mesh sensitivity study was carried out by progressively refining the grid and tracking the differential pressure ΔP across the orifice plate. The comparison of ΔP obtained with different cell numbers is shown in Fig. 5. When the total number of cells exceeds 900000, the variation of ΔP becomes negligible, indicating that the solution is insensitive to further mesh refinement. Considering both accuracy and computational cost, the mesh with approximately 900000 cells was selected for all subsequent simulations. In addition, the predictive fidelity for metering performance was examined by comparing the simulated discharge coefficient Cd with the ISO 5167 reference values over the Reynolds number range considered in this work. Fig. 6 presents the comparison between the ISO based Cd and the CFD-predicted Cd. The CFD results exhibit the same decreasing trend of Cd with increasing Re, and the deviation from the ISO reference is consistently small: the mean absolute deviation is 3.41 × 10⁻³, and the maximum relative deviation is 0.66 % within the investigated Reynolds number range. This agreement, together with the grid independence results, supports the numerical reliability of the present CFD methodology for evaluating the hydraulic characteristics of chamfered orifice plates under the investigated conditions.
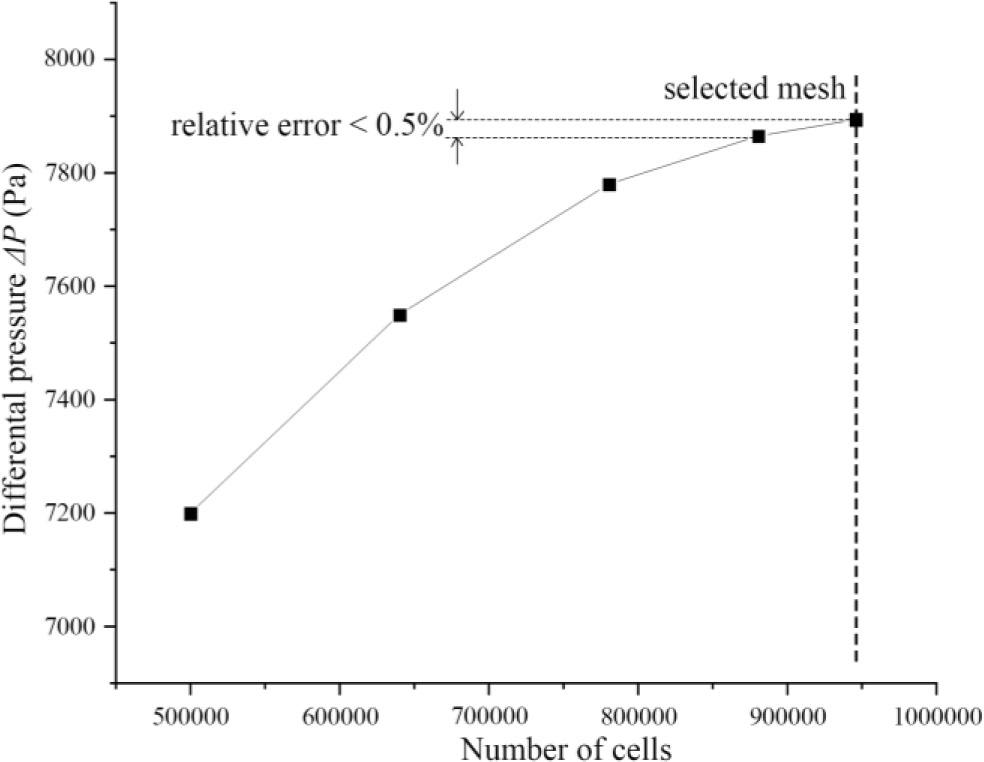
Grid independence assessment based on the differential pressure ΔP across the orifice plate.
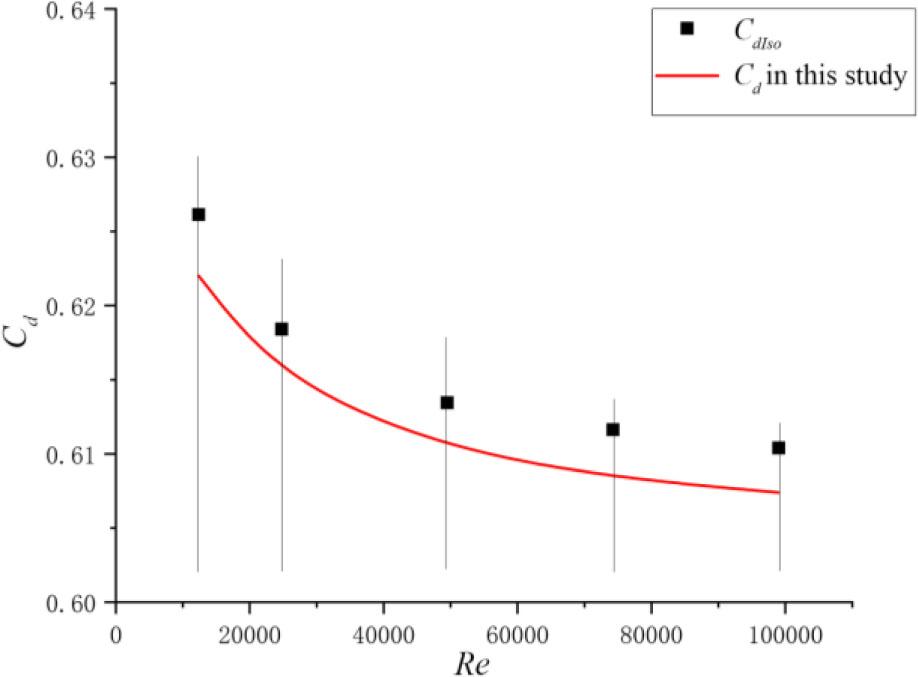
Comparison of the discharge coefficient Cd between the ISO 5167 reference values and CFD predictions.
To investigate the effect of thickness on the flow field characteristics of the throttle orifice plate, this study examined the flow behavior of throttle orifice plates with thicknesses ranging from h = 3mm to 36 mm at an inlet flow velocity of 1 m/s. The structural parameters of the throttle orifice plate are summarized in Table 1, where the relative thickness of the orifice plate is defined as t = h/d.
Structural parameters of throttled orifice plates with different thicknesses.
| Throttle orifice d [mm] | Beta ratio β | Thickness h [mm] | Relative thickness t |
|---|---|---|---|
| 30 | 0.6 | 3 | 0.10 |
| 30 | 0.6 | 5 | 0.17 |
| 30 | 0.6 | 7 | 0.23 |
| 30 | 0.6 | 10 | 0.33 |
| 30 | 0.6 | 15 | 0.50 |
| 30 | 0.6 | 30 | 1.00 |
| 30 | 0.6 | 36 | 1.20 |
Fig. 7 illustrates the axial velocity distribution across the throttle orifice plate. From the graph, it is evident that as the thickness of the orifice plate increases, the maximum jet velocity of the fluid passing through the orifice plate gradually decreases. This effect is particularly pronounced for thinner plates, while for plates with a relative thickness t > 0.5, the influence of plate thickness on the maximum jet velocity becomes negligible. This behavior can be attributed to the differences in jet dynamics as the fluid passes through thin versus thick plates. As shown in Fig. 8, for thin plates (with h = 3 mm and h = 7 mm), the maximum jet intensity occurs immediately behind the orifice plate. In contrast, for thicker plates (with h = 30 mm and h = 36 mm), the maximum jet intensity is observed inside the orifice plate. For thin plates, the jet expands only once as the fluid passes through, whereas for thick plates, the jet initially expands inside the orifice and then undergoes a second expansion after exiting the orifice. As a result, the fluid's motion becomes smoother after the two expansions, leading to a lower maximum jet velocity for thick plates compared to thin ones.
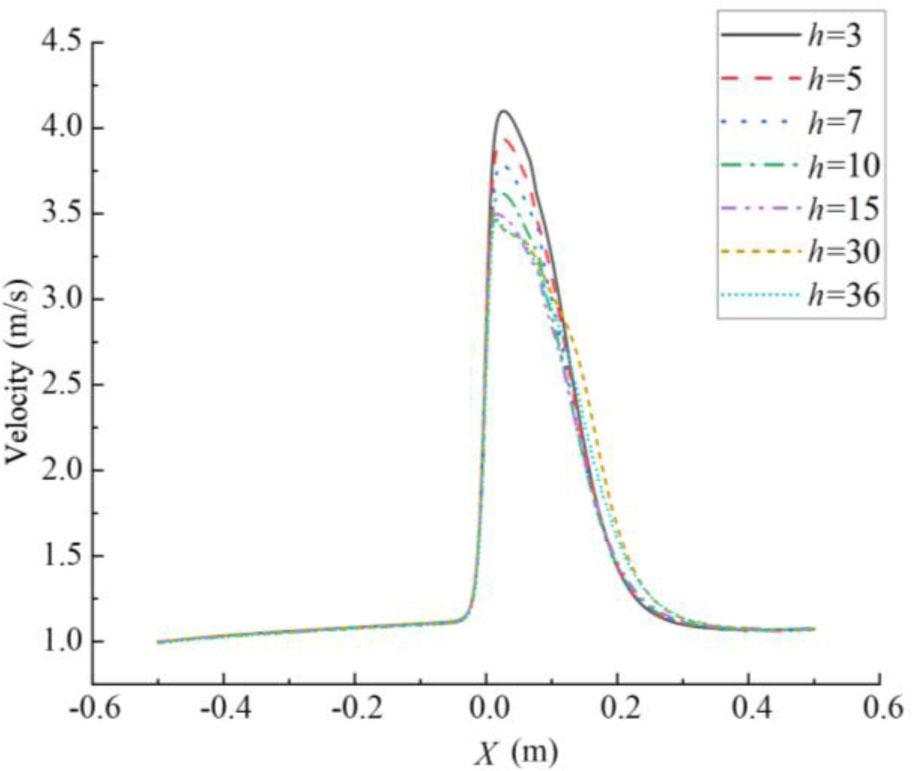
Axial velocities of throttled orifice plates of different thicknesses.
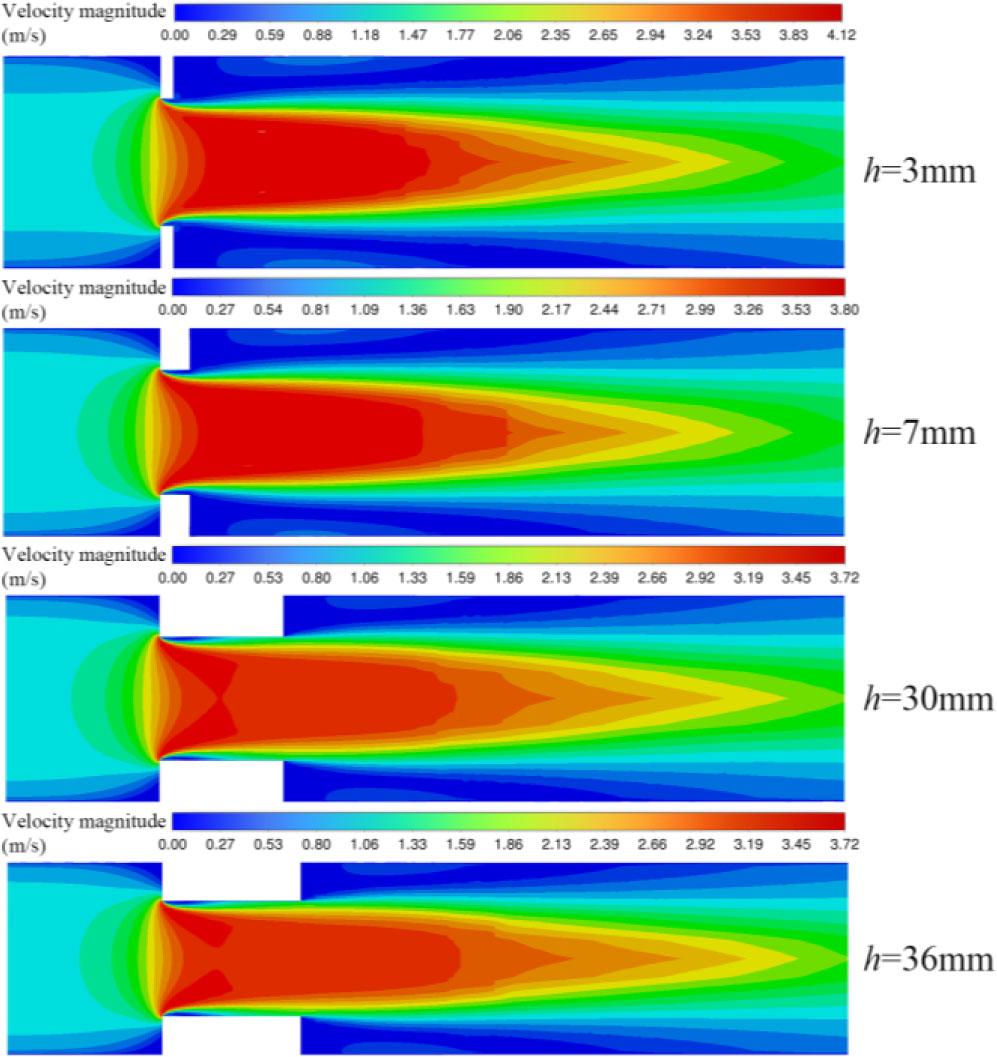
Velocity clouds for different thicknesses of throttled orifice plates.
Fig. 9 shows the dependence of the pressure loss coefficient ξ on the Reynolds number for orifice plates with different thicknesses. A pronounced thickness effect is observed: increasing plate thickness leads to a lower ξ over the investigated Reynolds number range. Moreover, opposite Reynolds number trends appear for thin versus thick plates — ξ increases with Re for thinner plates, whereas it gradually decreases with Re as the plate becomes thicker. This reversal is attributable to the different development of the near-wall boundary layer inside the orifice bore, which modifies the effective contraction process and, consequently, the irreversible loss. From a design perspective, increasing the plate thickness can be an effective way to reduce pressure loss, particularly at higher Reynolds numbers.
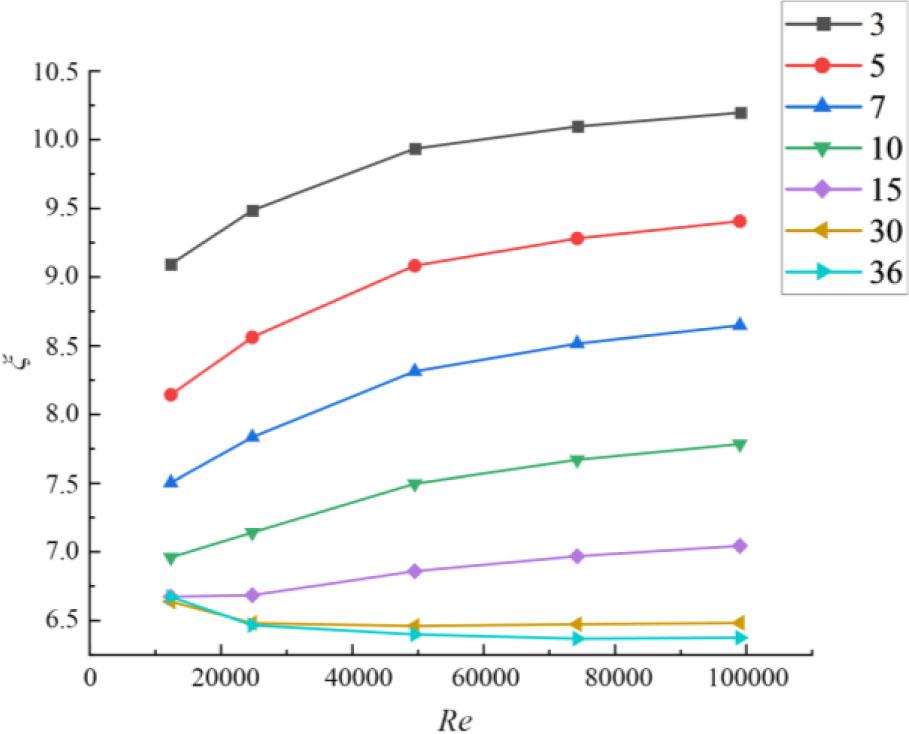
Effect of orifice plate thickness and Reynolds number on the orifice plate pressure loss coefficient.
Fig. 10 illustrates the streamline distribution near the throttle orifice for both thin and thick orifice plates. From the graph, it can be observed that for the thin orifice plate with h = 3 mm, the short length of the throttle orifice results in the entire wall area being within a low-pressure zone. Consequently, vortices formed behind the orifice plate penetrate the interior of the orifice. In contrast, for the thick orifice plate with h = 30 mm, the low-pressure zone and vortices generated by the jet are confined to the region near the orifice entrance. After passing through the low-pressure zone, the fluid begins to expand inside the throttle orifice, forming a new boundary-layer flow.
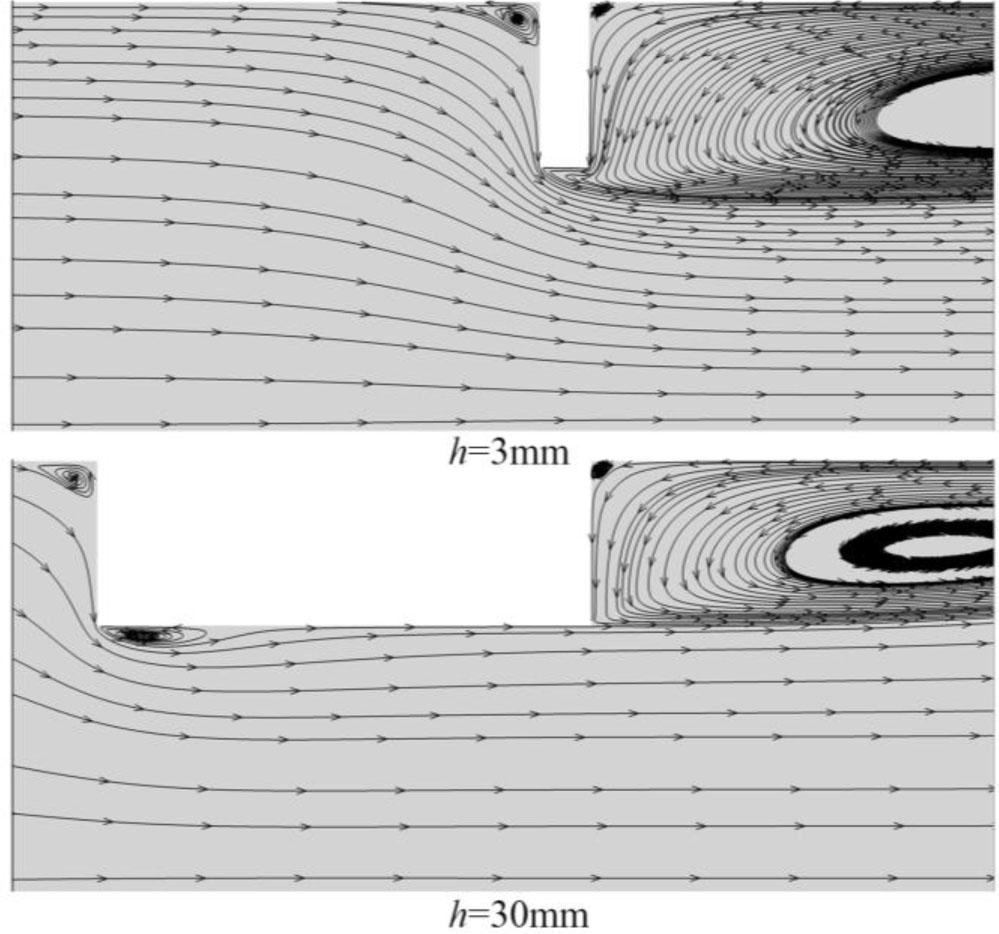
Trace distribution of thin and thick orifice plates.
As a result, for thin orifice plates, an increase in Reynolds number exacerbates vortex penetration into the region near the orifice plate wall, leading to higher pressure loss. On the other hand, for thick orifice plates, the increasing Reynolds number enhances the fluid's momentum, effectively suppressing the vortices near the entrance. This allows the boundary-layer flow inside the orifice to develop more quickly, thereby reducing pressure loss.
In throttling orifice flows, the pressure loss reflects an irreversible conversion of mechanical energy into internal energy, driven by viscous dissipation. In turbulent orifice jets, dissipation is promoted by separated shear layers, jet recirculation interaction, and near-wall high-shear regions. From a loss-budget standpoint, the total loss can be interpreted as the combination of a form-loss component (contraction, separation, recirculation, and mixing) and a friction-loss component (wall shear associated with boundary-layer development within the bore). For smaller plate thickness h, the bore length is short and the loss is primarily controlled by separation induced form loss and downstream mixing; thus, when the Reynolds number increases, the strengthened shear-layer dynamics and vortex activity can expand the effective mixing region (as evidenced in Fig. 10), leading to higher dissipation and increasing ξ (Fig. 9). For larger h, the bore behaves more like a short channel where the near-wall layer can develop and the shear layer can reorganize; this tends to mitigate the penetration of downstream recirculation into the bore and reduces the dominance of downstream mixing losses, yielding a decreasing or weakly varying ξ with Reynolds number within the investigated range.
To investigate the effect of chamfered structures on the flow field characteristics of orifice plates, this study designed a standard orifice plate with a thickness of h = 3 mm, along with chamfered orifice plates as detailed in Table 2. The flow field characteristics of these plates were analyzed under an inlet flow velocity of 1 m/s.
Orifice plate chamfering parameters.
| Thicknesses h [mm] | Orifice bore thickness e [mm] | Chamfer angle α [°] |
|---|---|---|
| 3 | - | 90 |
| 3 | 1 | 15 |
| 3 | 1 | 30 |
| 3 | 1 | 45 |
| 3 | 1 | 60 |
Fig. 11 presents the velocity profiles along the centerline for both the standard orifice plate and the various chamfered orifice plates. The data indicate that the maximum jet velocity of the chamfered orifice plates is notably lower than that of the standard orifice plate. Specifically, when the chamfer angles are 15°, 30°, and 45°, the reduction in the maximum jet velocity is particularly pronounced, with a maximum decrease of 17.67 %. This suggests that incorporating an appropriate chamfer structure can effectively enhance the flow field characteristics of the orifice plate.
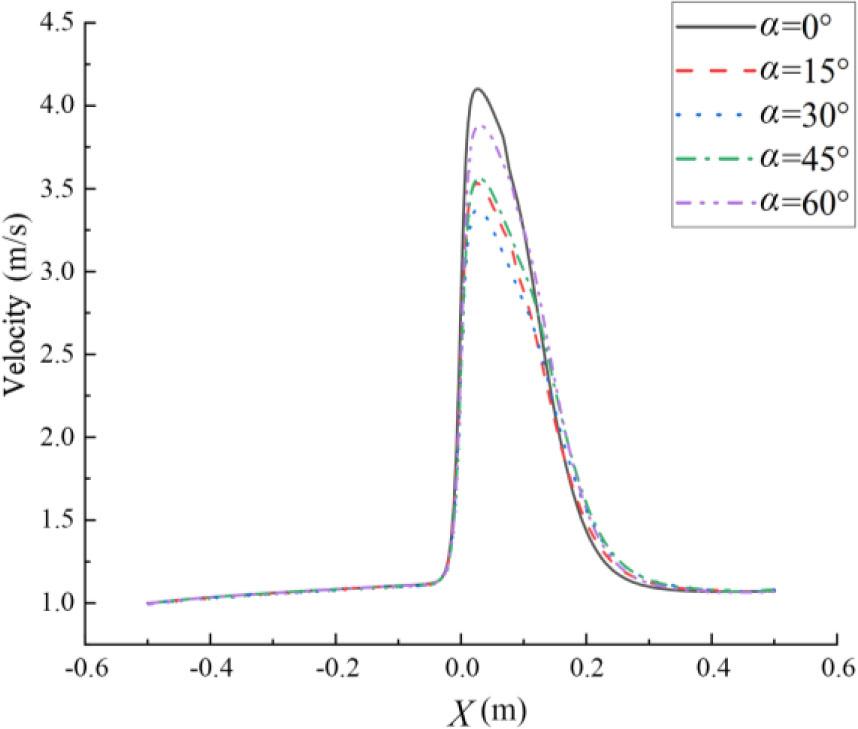
Velocity change curves for standard and chamfered orifice plates.
The pressure loss coefficients for orifice plates with different chamfer angles, measured at various Reynolds numbers, are shown in Fig. 12. The graph reveals that for chamfer angles of 15° and 60°, the pressure loss coefficient increases with the Reynolds number. In contrast, for chamfer angles of 30° and 45°, the pressure loss coefficient decreases with increasing Reynolds number. This behavior can primarily be attributed to the penetration of vortices formed behind the orifice plate into the interior of the orifice.
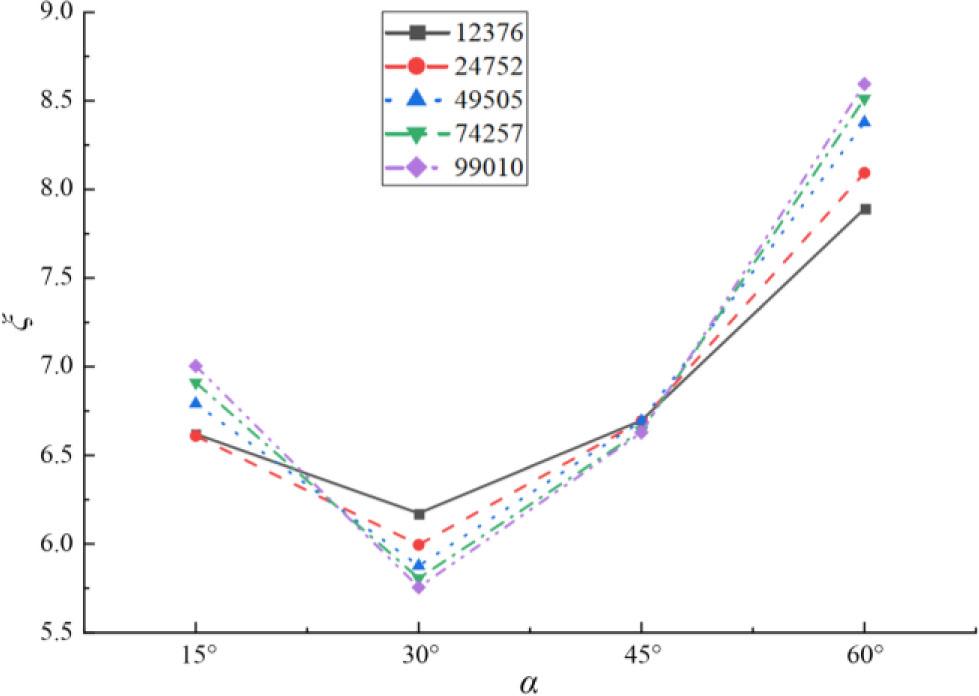
Pressure loss coefficient versus chamfer angle at different Reynolds numbers.
From a practical design perspective, the results indicate that the chamfer angle should be selected to avoid the high loss regime observed at large angles. Within the investigated range, a moderate chamfer angle ranging from 30° to 45° consistently provides lower ξ than α = 60° across the Reynolds numbers considered. This benefit is attributed to the wall-attached jet and the suppression of vortex penetration into the bore region, as evidenced by the streamline patterns in Fig. 13. Therefore, α ≈ 30°–45° can be recommended as a robust choice for reducing pressure loss for the thin-plate case studied here (h = 3 mm), while the effect of bore thickness e is further quantified below.
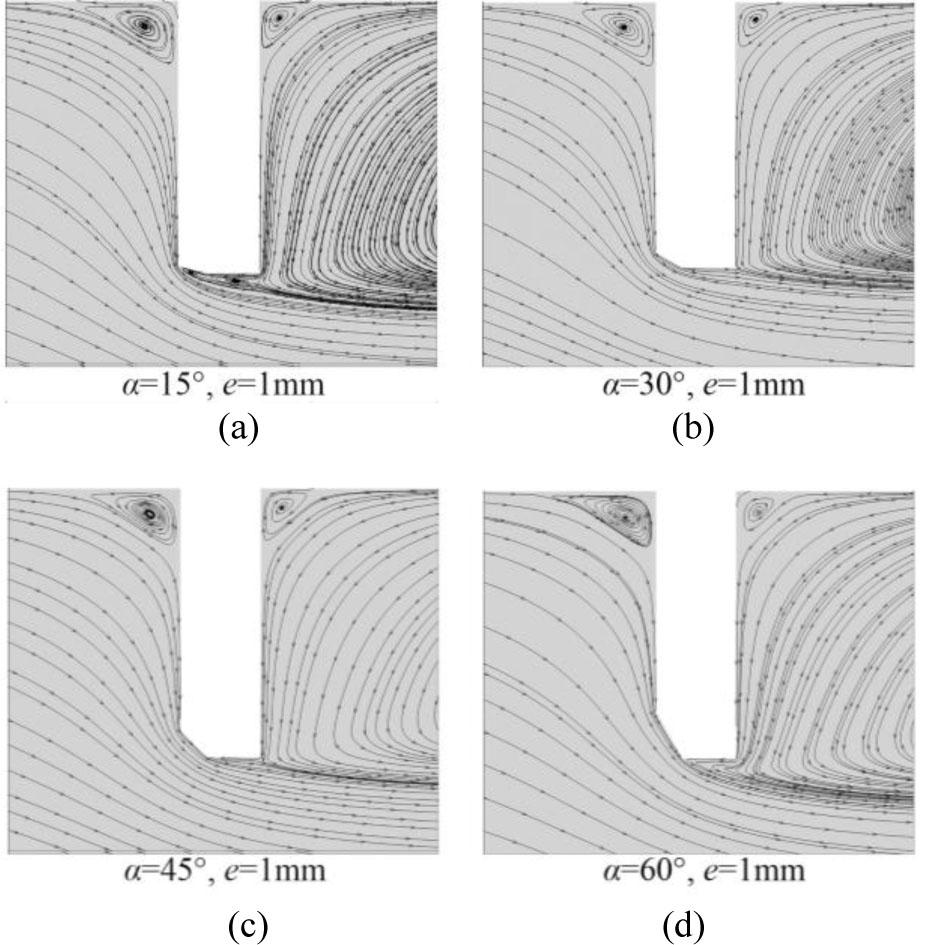
Flow field traces of throttled orifice plates with different chamfer angles.
Fig. 13 compares the streamline patterns for different chamfer angles and reveals a distinct change in the jet recirculation topology inside the orifice. For α = 15° and 60°, the jet remains concentrated in the pipe core, leaving a low momentum region near the orifice wall that facilitates the inward penetration of the downstream recirculation structures toward the bore wall. In contrast, for moderate chamfers (α = 30° and 45°), the incoming flow is redirected, causing the jet to attach to the wall, which stabilizes the near-wall shear layer and effectively suppresses vortex penetration into the bore region. This flow-structure difference provides a mechanistic explanation for the trends in ξ: as Re increases, the strengthened recirculation promotes vortex penetration and higher losses at α = 15° and 60°, whereas the wall-attached jet at α = 30°–45° becomes more robust and maintains lower losses.
As a result, for orifices with chamfer angles of 15° and 60°, an increase in Reynolds number intensifies the vortices behind the orifice, leading to greater vortex penetration and, consequently, higher pressure loss. Conversely, for orifices with chamfer angles of 30° and 45°, as the Reynolds number increases, the enhanced fluid momentum along the wall suppresses vortex penetration, resulting in lower pressure loss.
The chamfered structure of the orifice plate is determined not only by the chamfer angle but also by the orifice bore thickness. However, previous studies have focused mainly on the effect of the chamfer angle on the flow field characteristics of the orifice plate, while the impact of orifice bore thickness has received comparatively less attention. To further explore the influence of the chamfered structure on the flow field characteristics, this study also conducted a series of simulations examining both the orifice bore thickness e and chamfer angle α of the chamfered orifice plate. The experiments analyzed different orifice bore thicknesses (e = 0, 1, 2, and 2.5) and chamfer angles (α = 15°, 30°, 45°, and 60°) for a 3 mm thick orifice plate, with the results for the pressure loss coefficient summarized in Table 3.
Chamfered orifice plate structure parameters.
| Diameter ratio β | Thicknesses h [mm] | Orifice bore thickness e [mm] | Chamfer angle α [°] |
|---|---|---|---|
| 0.6 | 3 | 1 | 15 |
| 0.6 | 3 | 1 | 30 |
| 0.6 | 3 | 1 | 45 |
| 0.6 | 3 | 1 | 60 |
| 0.6 | 3 | 2 | 15 |
| 0.6 | 3 | 2 | 30 |
| 0.6 | 3 | 2 | 45 |
| 0.6 | 3 | 2 | 60 |
| 0.6 | 3 | 3 | 15 |
| 0.6 | 3 | 3 | 30 |
| 0.6 | 3 | 3 | 45 |
| 0.6 | 3 | 3 | 60 |
It is worth noting that the same dissipation-based mechanism also underpins the chamfer related trends discussed in this section. The chamfer angle α and the orifice bore thickness e primarily affect the inlet contraction and the initial shear-layer orientation, thereby modifying whether the jet attaches to the bore wall and whether downstream recirculation can penetrate toward the bore interior. As shown in Fig. 13, cases where the jet remains more wall attached tend to suppress vortex penetration and confine strong recirculation downstream, reducing the effective mixing and dissipation near the bore; conversely, configurations that promote a core jet with weaker near-wall momentum facilitate vortex encroachment toward the bore wall and intensify shear-driven mixing, leading to larger losses. This provides a consistent physical explanation for the observed dependence of ξ on α and e in Fig. 12–Fig. 14 and connects the chamfer effects to the thickness-related mechanisms.
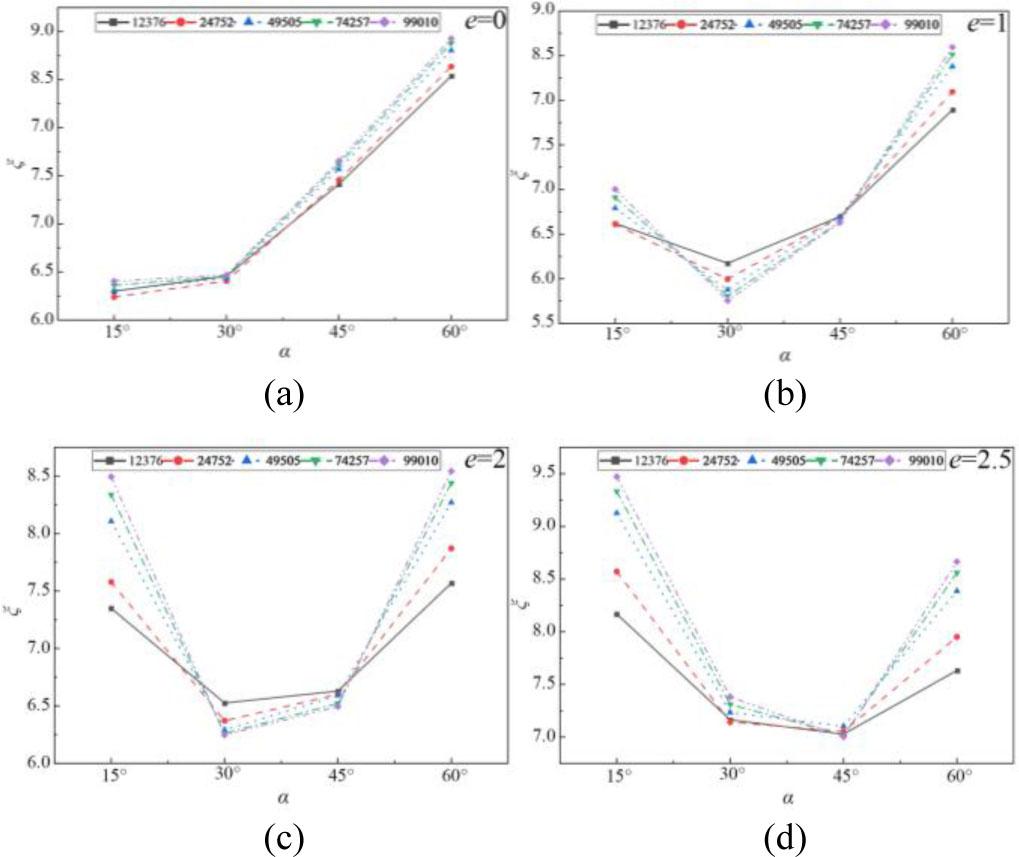
Pressure loss coefficients for different chamfered structure orifice plates.
Fig. 14 illustrates the pressure loss coefficients for orifice plates with different chamfer angles and orifice bore thicknesses. From Fig. 14(a), it is evident that when e = 0, the pressure loss coefficient increases with the chamfer angle. The minimum pressure loss coefficient occurs at a chamfer angle of 15°, while the maximum occurs at 60°, with a maximum difference of 39.4 %.
Fig. 14(b) and Fig. 14(c) show that for e = 1 and e = 2, the pressure loss coefficient initially decreases and then increases as the chamfer angle increases. The minimum pressure loss coefficient is observed at α = 30°. A notable difference between the two cases is that at α = 15°, the orifice plate with e = 2 exhibits a significantly greater pressure loss coefficient than the one with e = 1.
From Fig. 14(d), it can be seen that for e = 2.5, the pressure loss coefficient is minimized at a chamfer angle of 45° and maximized at 15°, with the maximum pressure loss coefficient increasing by 35.3 %.
Moreover, Fig. 13 shows that as the orifice bore thickness e increases, the chamfer angle corresponding to the minimum pressure loss coefficient also increases. Therefore, in the design of the chamfered orifice plate, it is essential to consider both the orifice bore thickness and chamfer angle in a comprehensive manner. For the investigated configurations, the optimal chamfer angle increases with bore thickness: 15° at e = 0 mm, rising to 30° for e = 1–2 mm, and reaching 45° at e = 2.5 mm. This trend provides a clear design guideline: increasing the bore thickness requires a larger chamfer angle to maintain low-loss flow attachment and suppress vortex penetration.
This study employs numerical simulation methods to analyze a throttle orifice plate with a 50 mm diameter and a diameter ratio of 0.6. The influence of the relative thickness and chamfered structure of the orifice plate on its flow field characteristics is explored, leading to the following conclusions:
The thickness of the orifice plate has a significant impact on its pressure loss characteristics. As the orifice plate thickness increases, the pressure loss coefficient decreases. For plates with small thicknesses, an increase in the Reynolds number leads to an increase in turbulence intensity downstream of the orifice, resulting in a higher pressure loss coefficient. However, for plates with larger thicknesses (relative thickness t > 1), the attachment of the fluid to the inner wall of the orifice plate forms a boundary layer flow. As the Reynolds number increases, the boundary layer flow exerts a stronger inhibitory effect on the vortices within the orifice, leading to a decrease in the pressure loss coefficient over a specific range of Reynolds numbers.
The introduction of chamfers on the throttle orifice plate effectively reduces vortex intensity near the orifice, thereby lowering the pressure loss coefficient and improving the orifice plate's performance. For commonly used orifice plates with a thickness of 3 mm, the minimum pressure loss coefficient is achieved at a chamfer angle of 30° to 45°.
The flow field characteristics of the throttle orifice plate are influenced not only by the chamfer angle but also by the orifice bore thickness. As the orifice bore thickness increases, the optimal chamfer angle increases as well. When the orifice bore thickness is varied from 0 to 2.5 mm, the optimal chamfer angle increases from 15° to 45°.
The bore thickness e interacts with the chamfer angle α and shifts the low-loss configuration toward larger α as e increases. Within the investigated range, a moderate chamfer remains preferable; specifically, the optimal α increases from 15° at e = 0 to 30° at e = 1–2 mm and to 45° at e = 2.5 mm. This provides a direct geometry-selection guideline: a larger bore thickness requires a larger chamfer angle to maintain reduced vortex penetration and low pressure loss. Future work will extend the present analysis to assess inlet disturbance sensitivity and a finer sampling of α, and to investigate whether the pressure loss trend approaches an asymptotic limit when the plate thickness is further increased beyond the current range.