
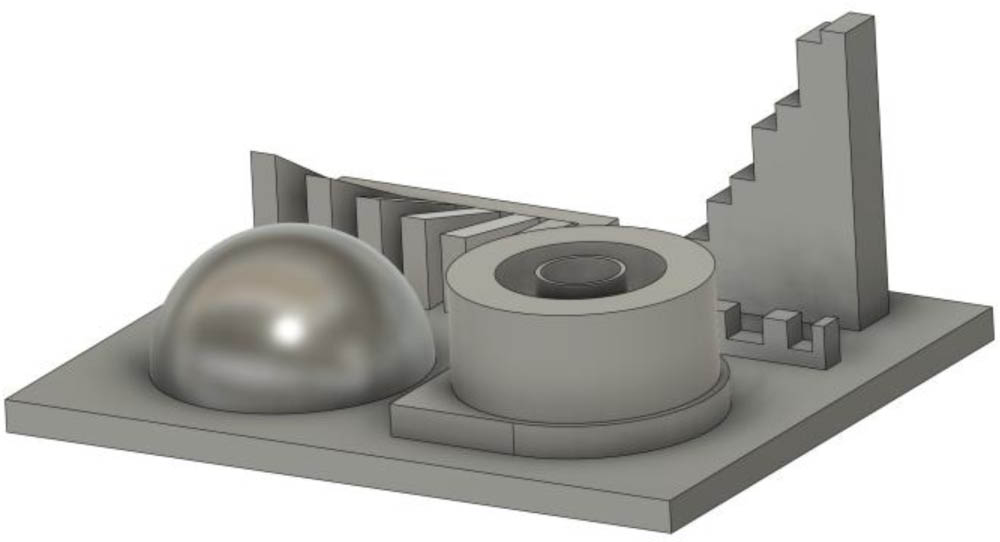
Fig. 1.
CAD representation of an artifact compliant with ISO/ASTM 52902.
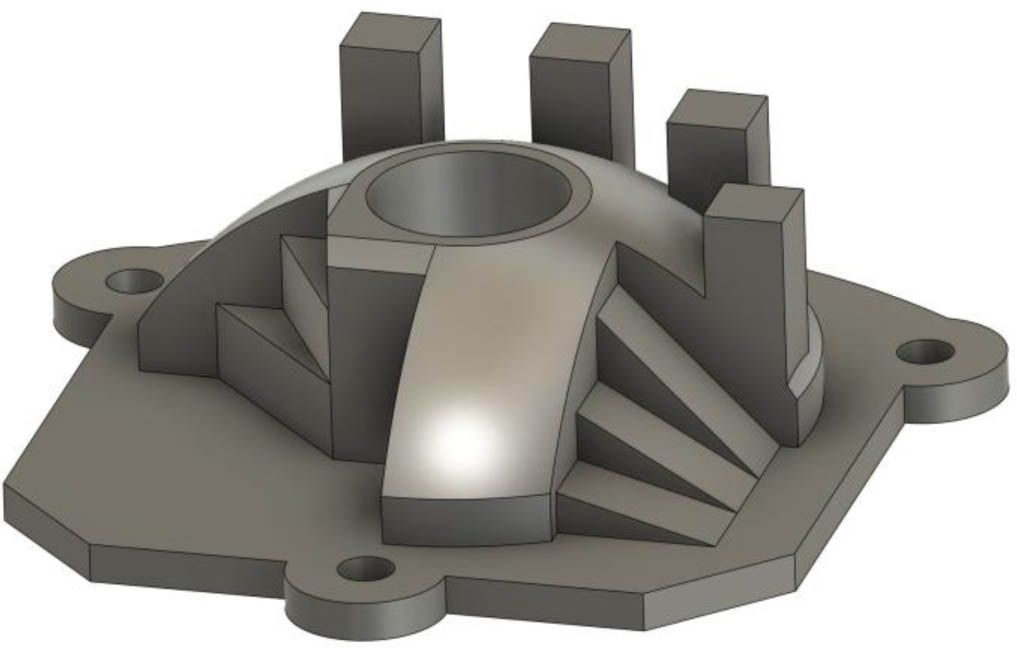
Fig. 2.
CAD representation of the designed artifact.
Table 1.
Printing parameters.
| Setting | Value |
|---|---|
| Nozzle temperature | 220 °C |
| Bed temperature | 55 °C |
| Layer height | 0.1 mm |
| Number of wall perimeters | 4 |
| Number of top and bottom solid layers | 5 |
| Fill type | gyroid 15 % |
| First layer speed | 50 mm/s |
| Outer wall speed | 60 mm/s |
| Inner wall speed | 150 mm/s |
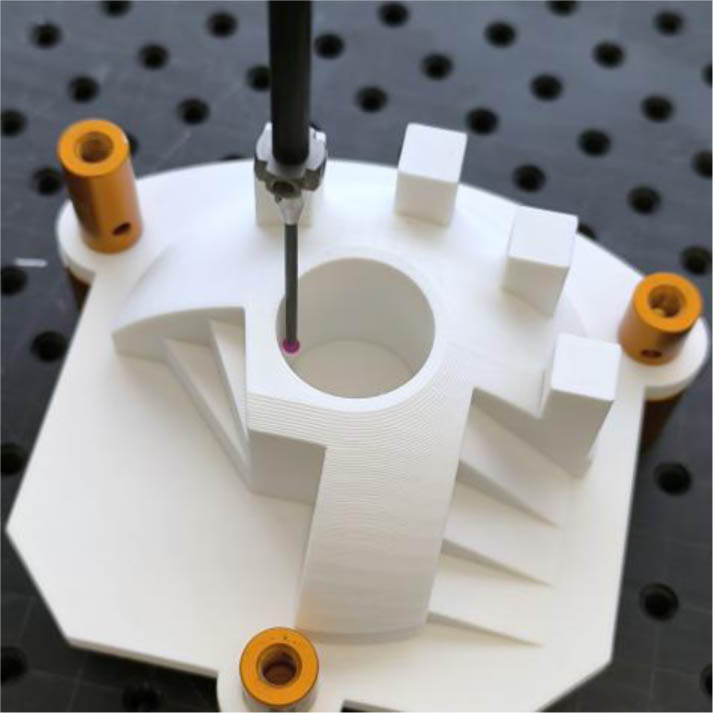
Fig. 3.
CMM measuring the designed artifact.
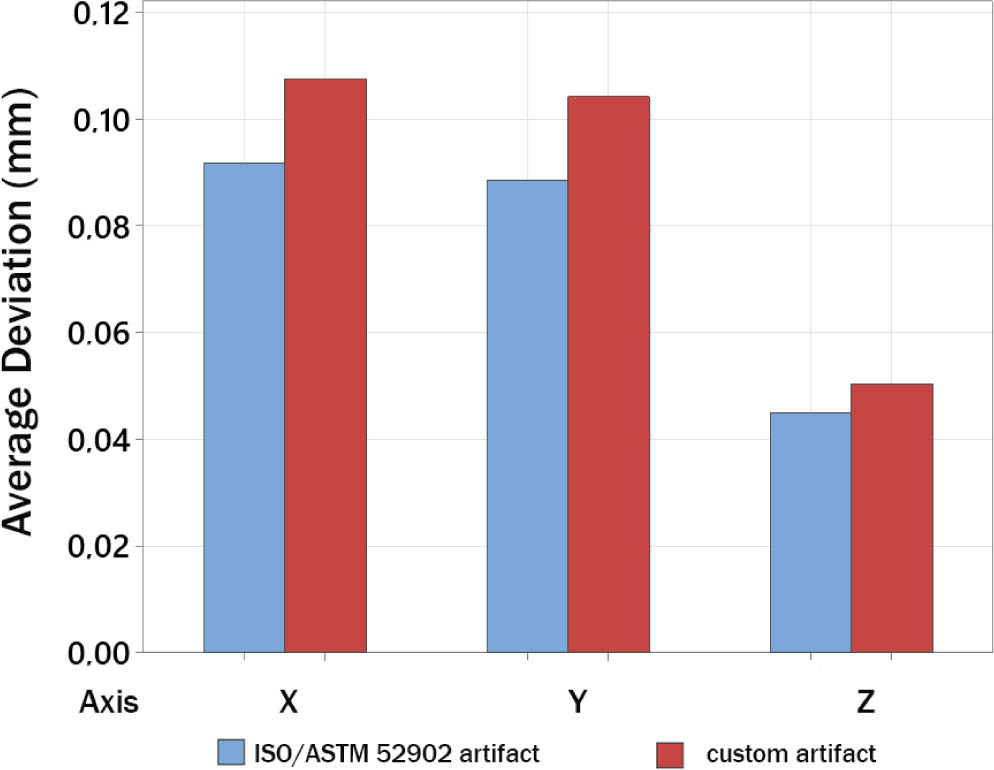
Fig. 4.
Deviations measured by CMM.
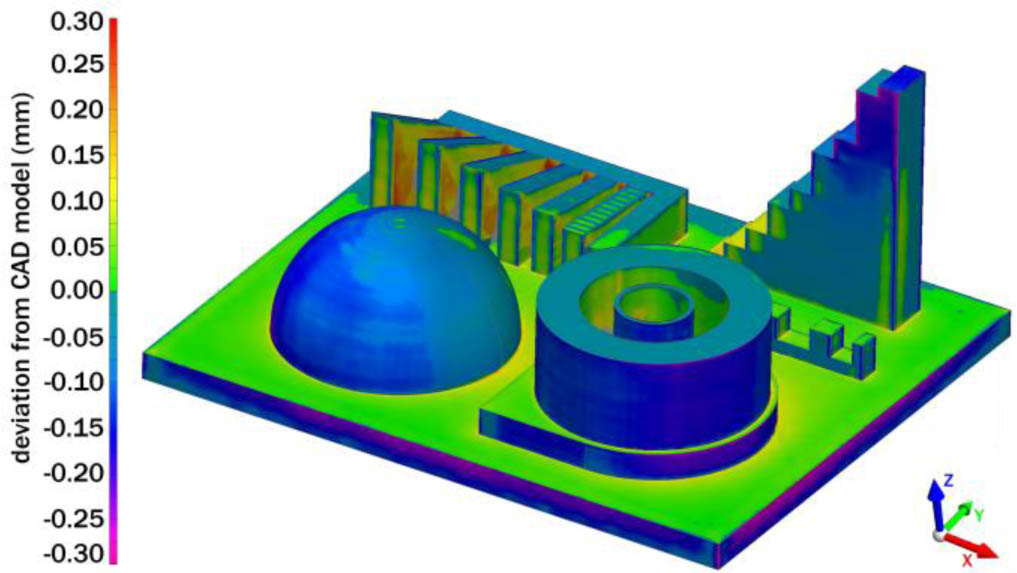
Fig. 5.
Comparison of 3D scanned data with CAD model (ISO/ASTM 52902 artifact).
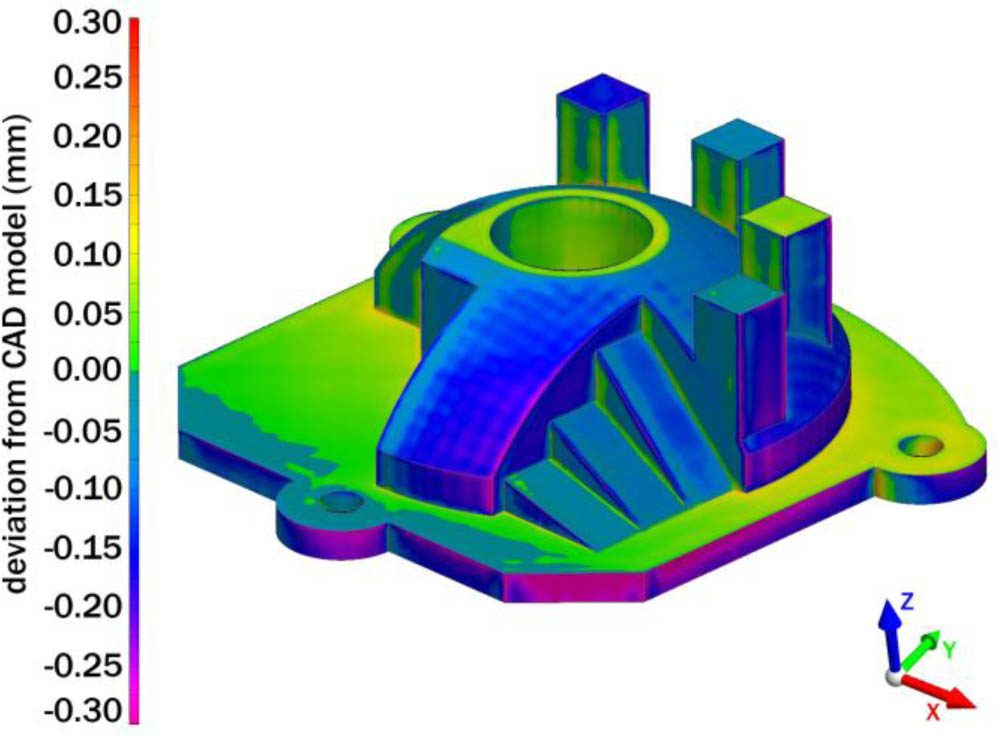
Fig. 6.
Comparison of 3D scanned data with CAD model (custom artifact).
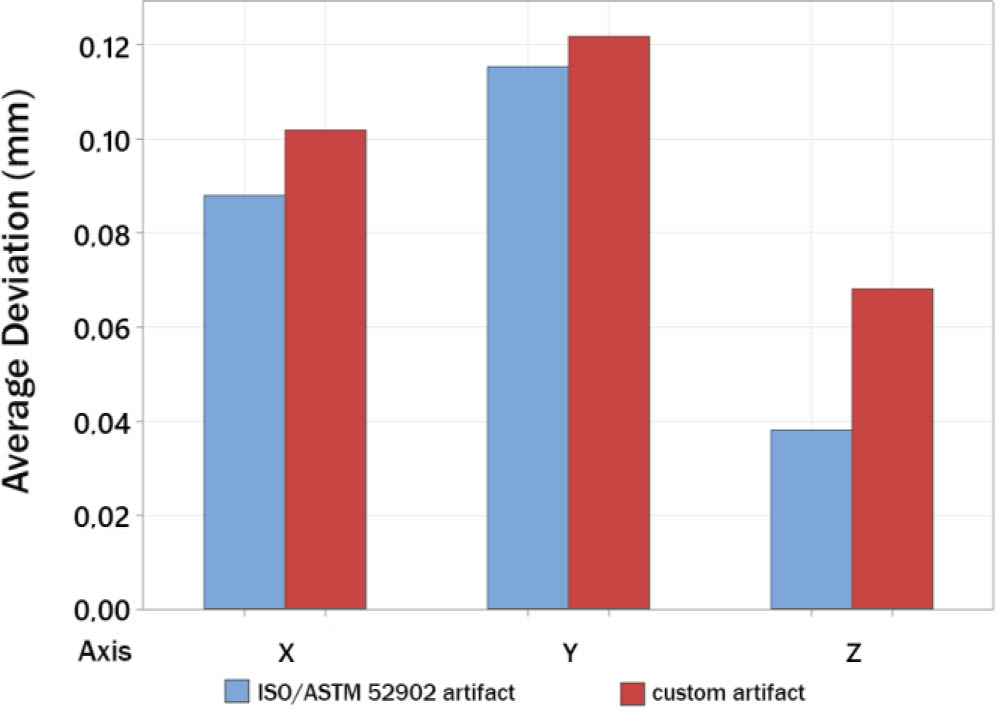
Fig. 7.
Deviations measured by 3D scanning.
Table 2.
ANOVA table.
| Source | DF | Adj SS | Adj MS | F-Value | P-Value |
|---|---|---|---|---|---|
| Measurement | 1 | 0.004223 | 0.004223 | 0.98 | 0.323 |
| Artifact | 1 | 0.012353 | 0.012353 | 2.87 | 0.092 |
| Measurement * Artifact | 1 | 0.000246 | 0.000246 | 0.06 | 0.811 |
| Error | 153 | 0.658527 | 0.004304 |
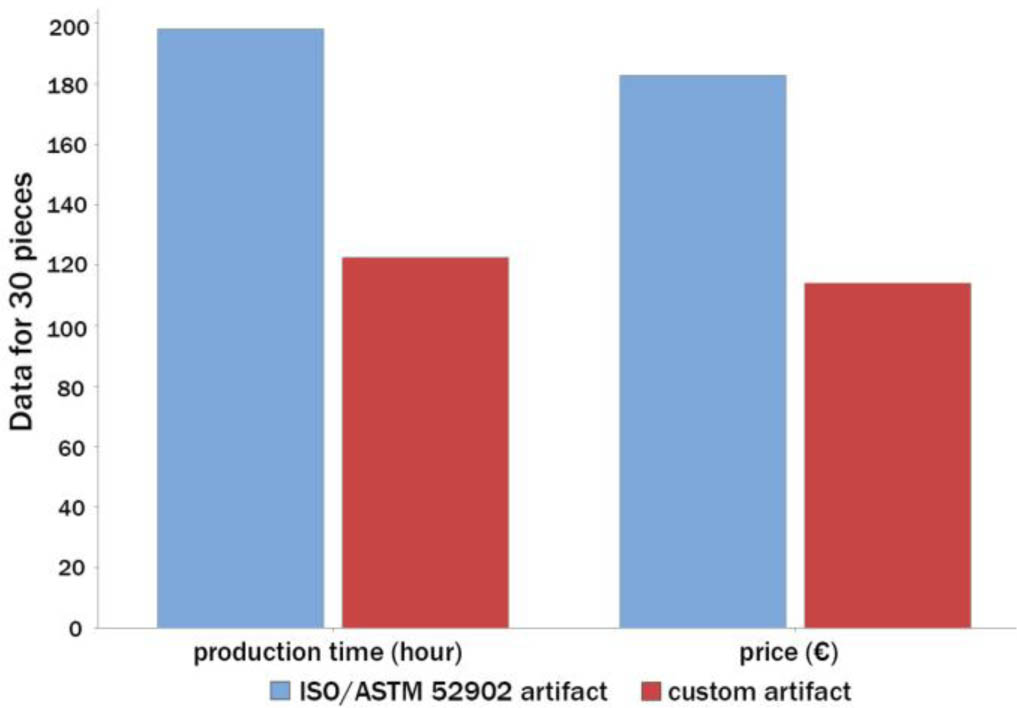
Fig. 8.
Comparison of total production time and cost for 30 artifacts.