
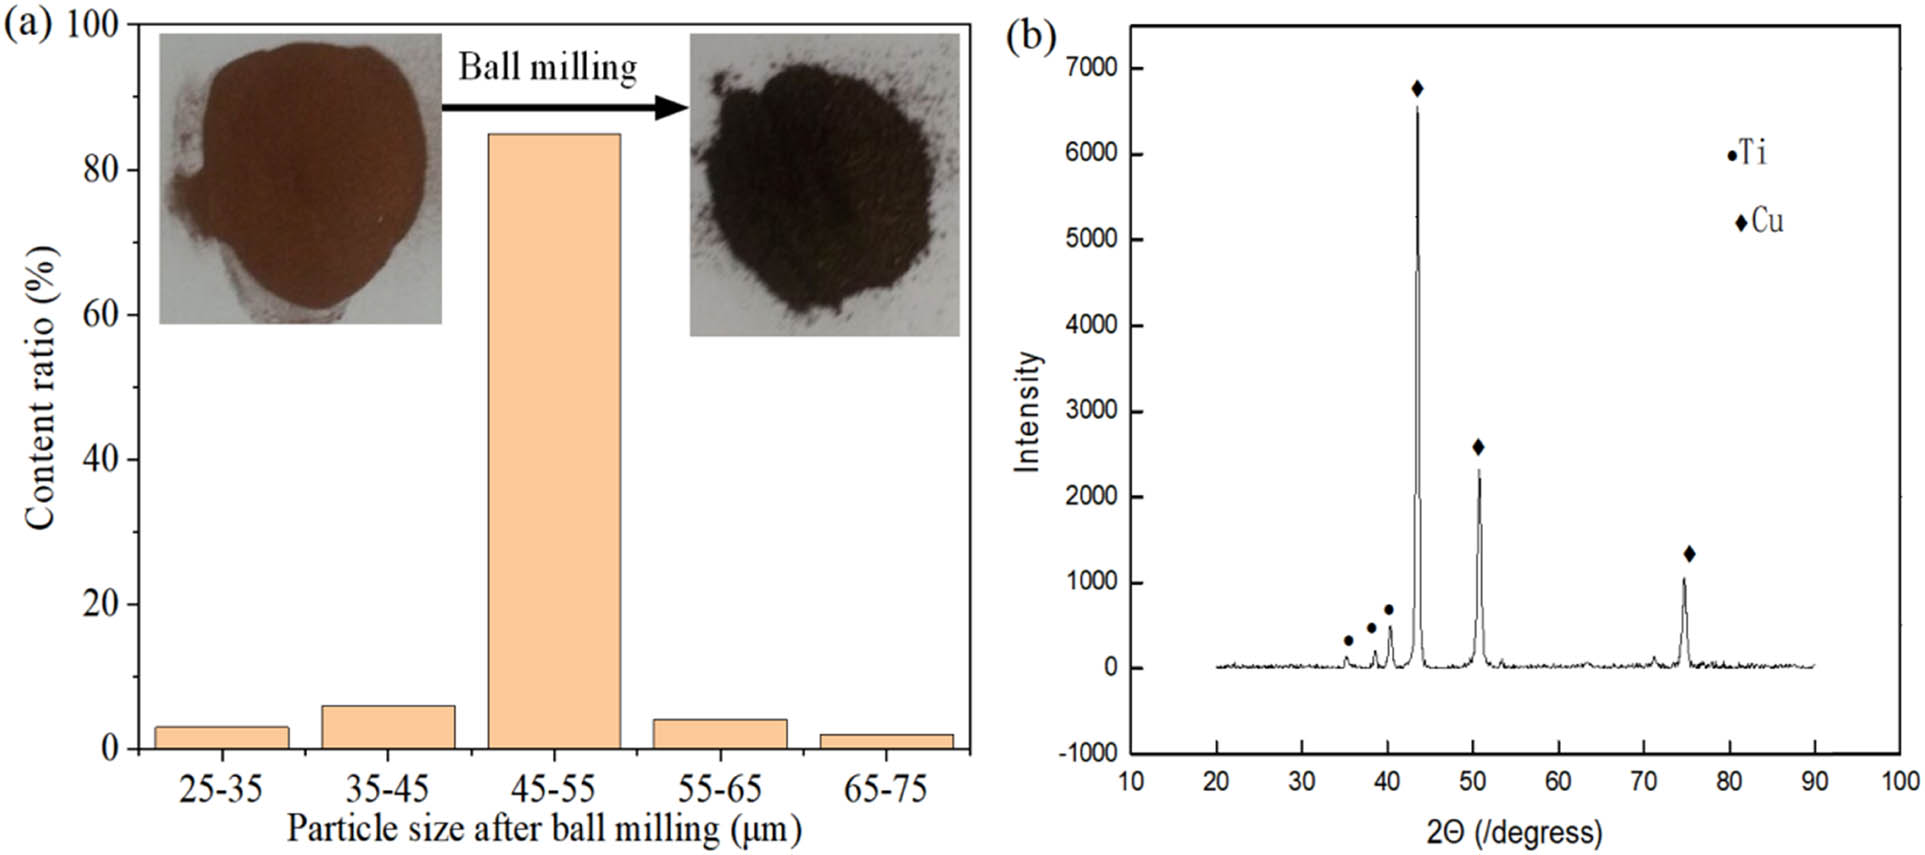
Figure 1
Morphology and phase composition of the clad powder. (a) Morphology of the clad powder before and after ball milling and (b) XRD phase analysis of the ball-milled Cu–Ti powder.
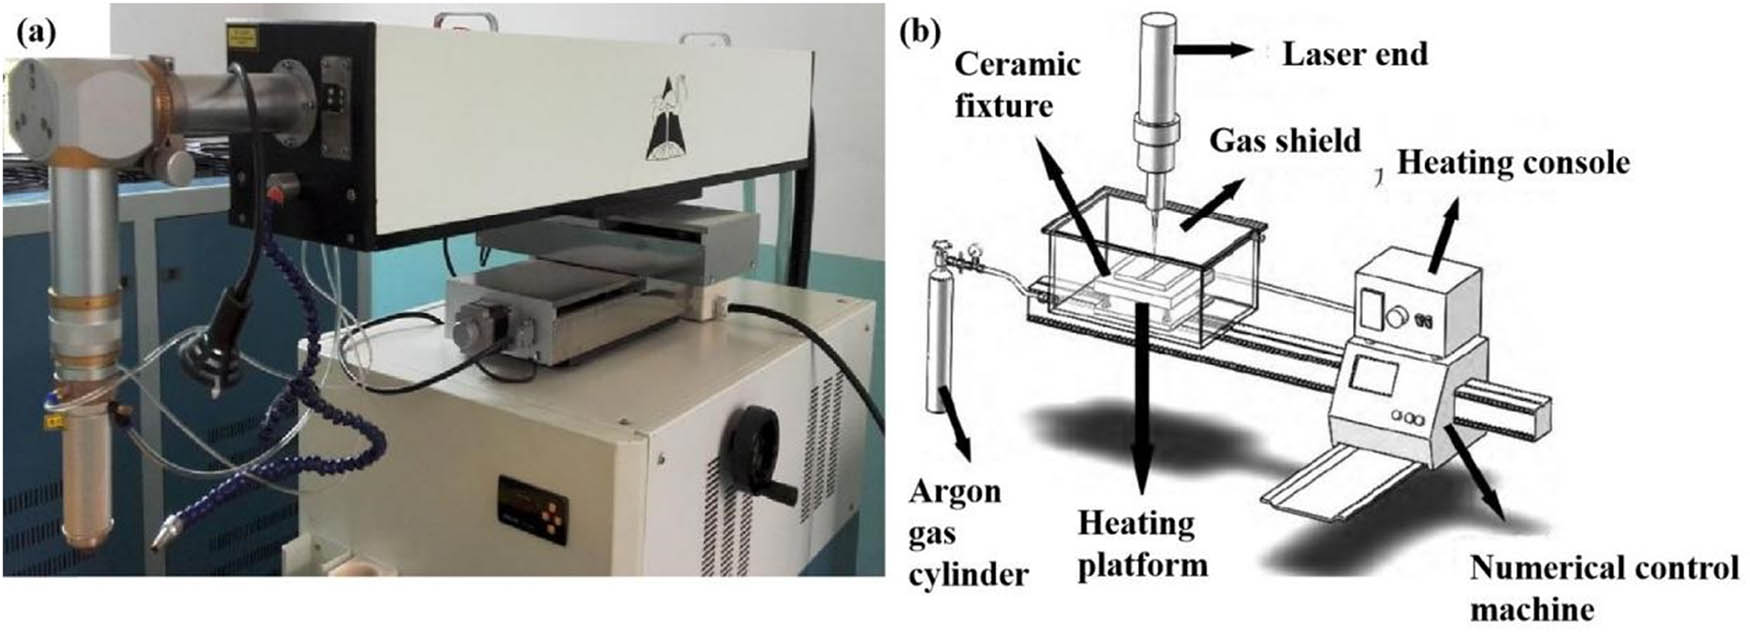
Figure 2
Laser cladding test equipment. Photograph (a) and schematic diagram (b).
Table 1
Laser cladding process parameters.
| Laser parameter | Value |
|---|---|
| Electric current | 200 A |
| Pulse width | 2.0 ms |
| Laser frequency | 4 Hz |
| Scanning speed | 355 mm/min |
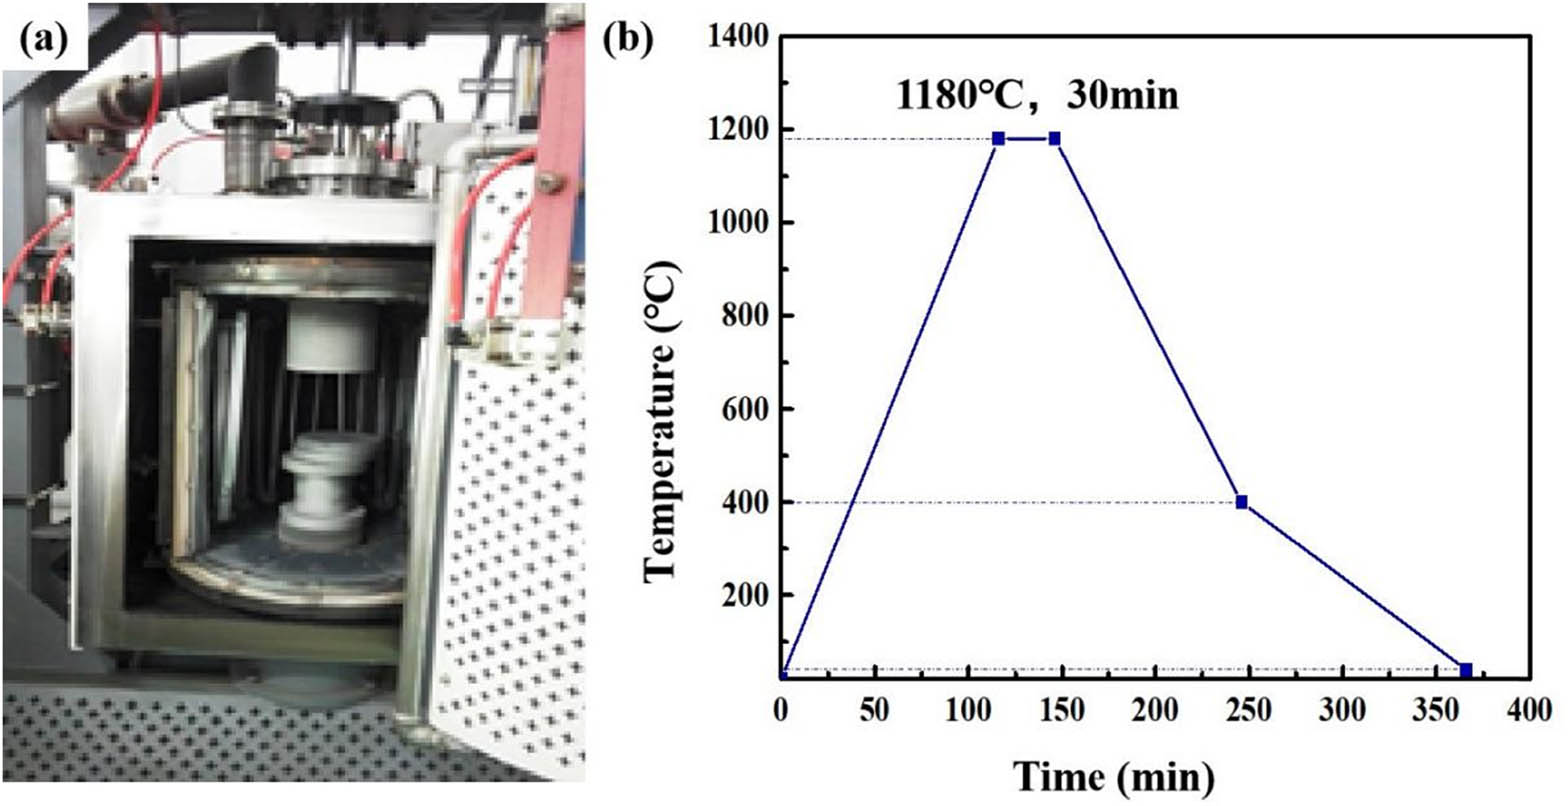
Figure 3
Brazing and cladding test equipment (a) and brazing thermal evolution process (b).
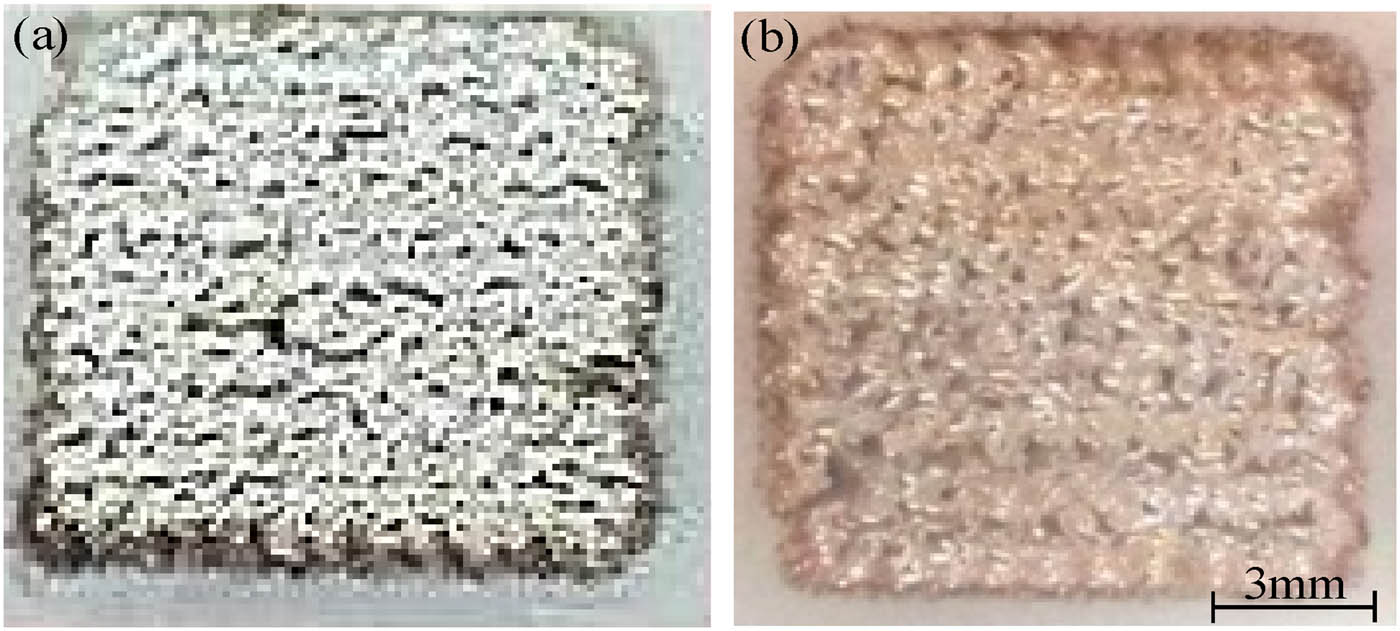
Figure 4
Macromorphology of Cu cladding coated by (a) brazing and (b) laser [12].
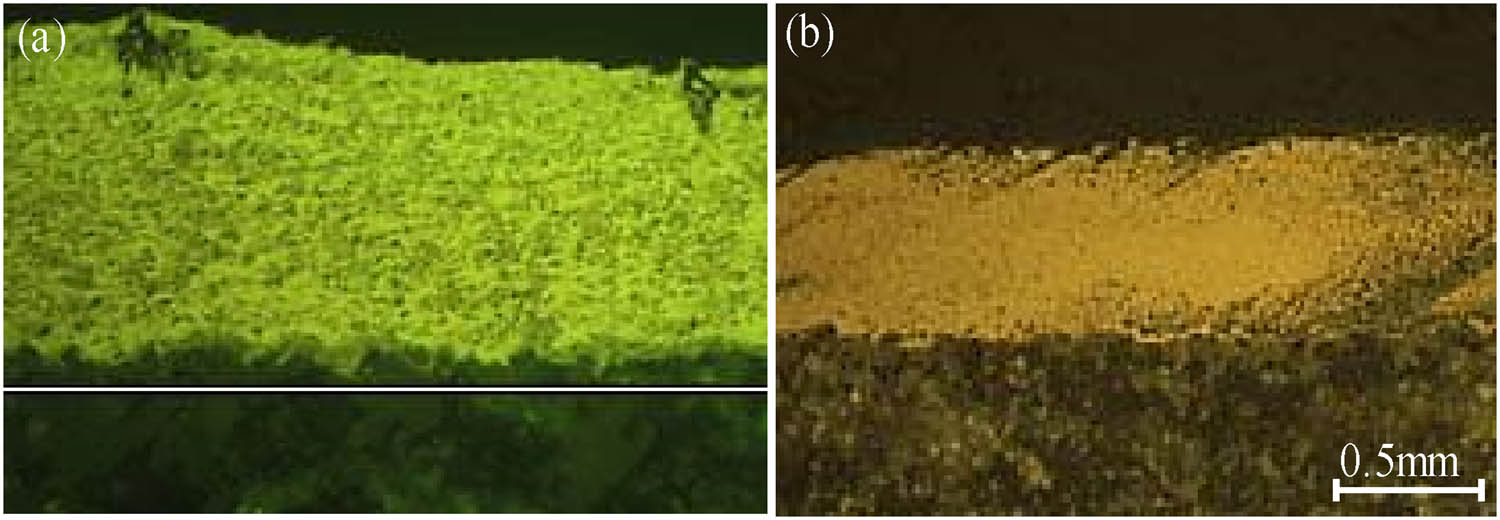
Figure 5
Microstructure of Cu cladding coated by (a) brazing and (b) laser.
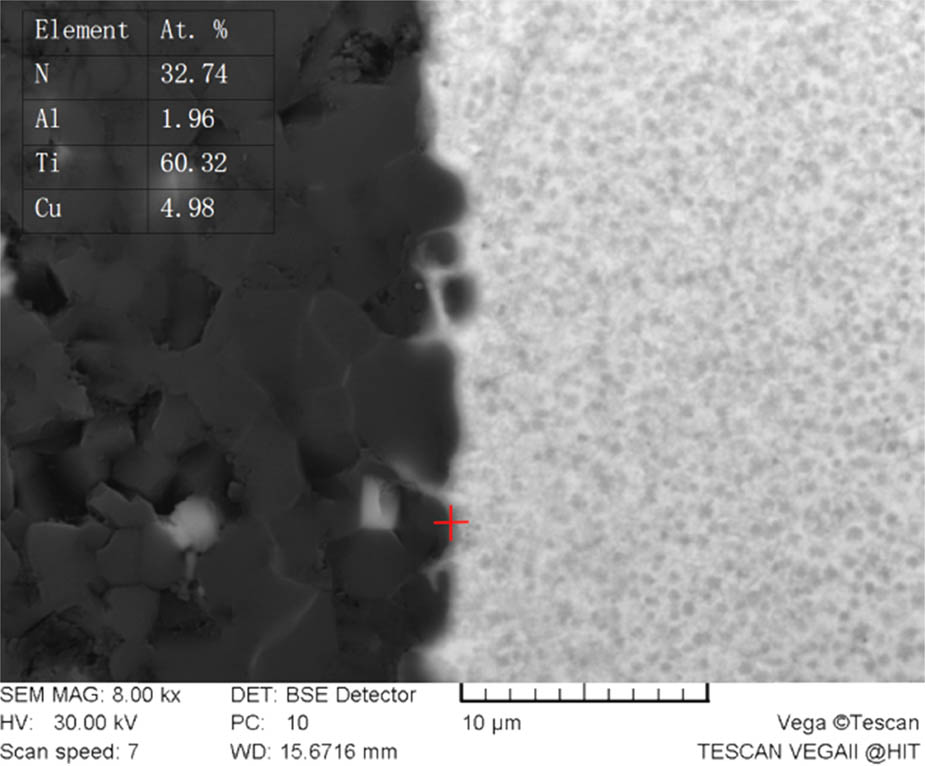
Figure 6
Scanning results of the interface points of brazing between the ceramic and Cu cladding.
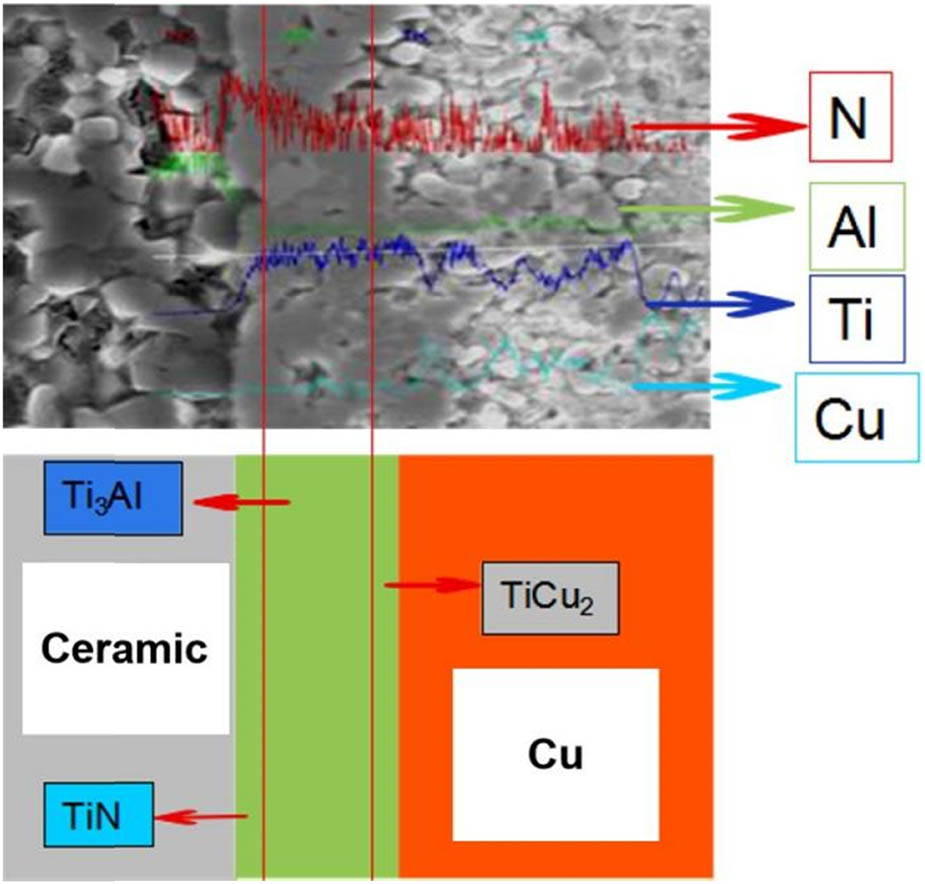
Figure 7
Schematic diagram of the metallurgical reaction in the brazing transition layer.
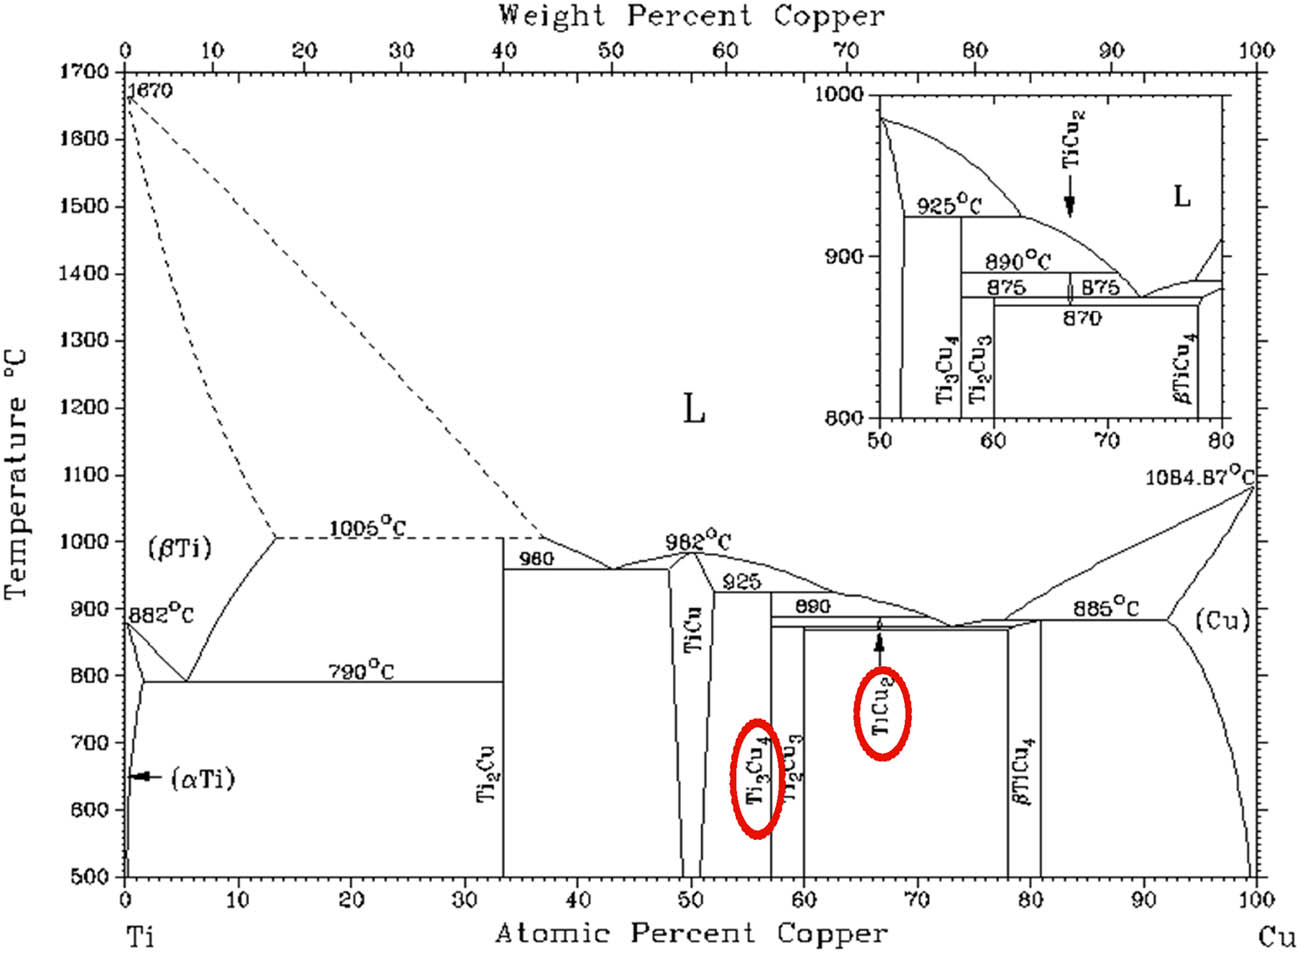
Figure 8
Ti–Cu binary phase diagram [13].
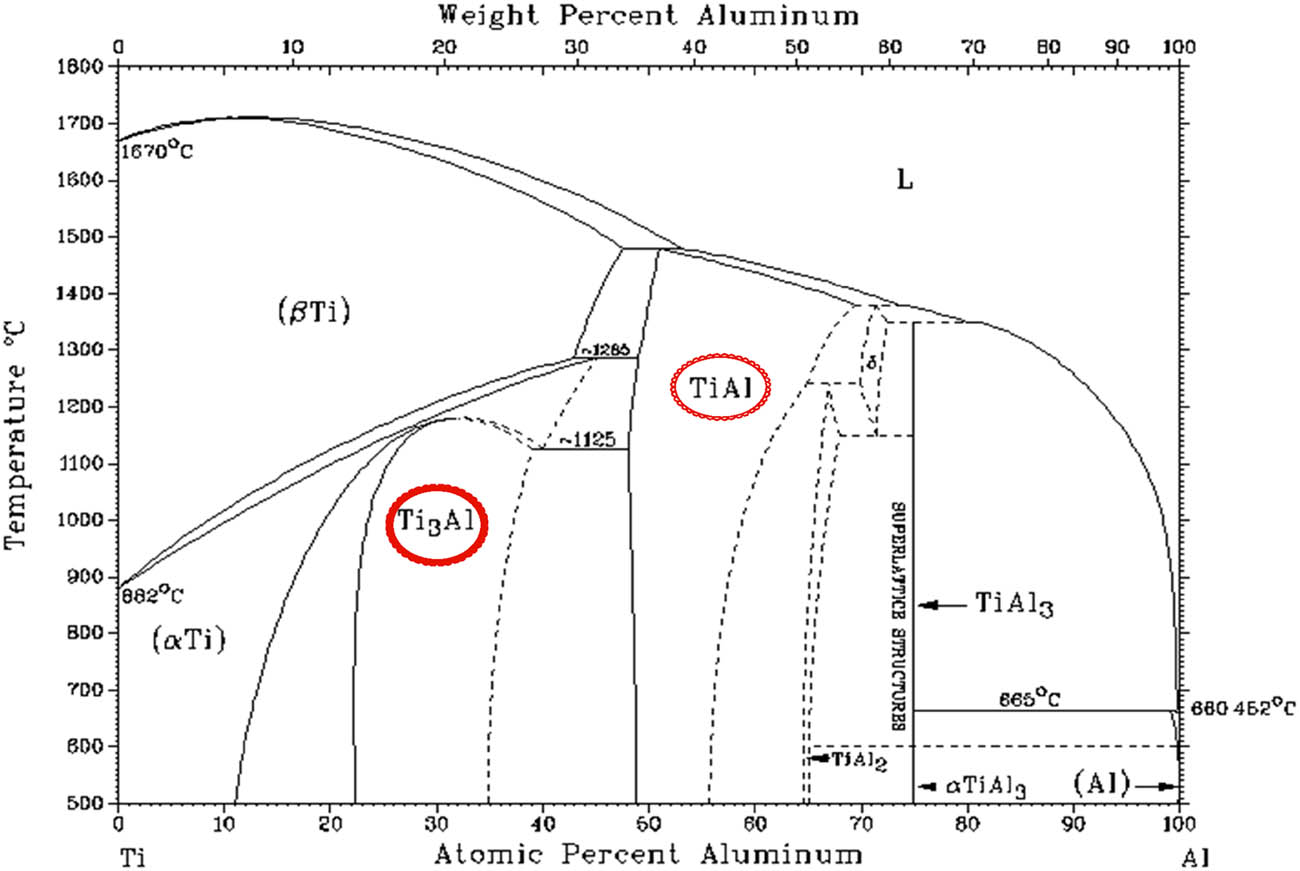
Figure 9
Ti–Al binary phase diagram [13].
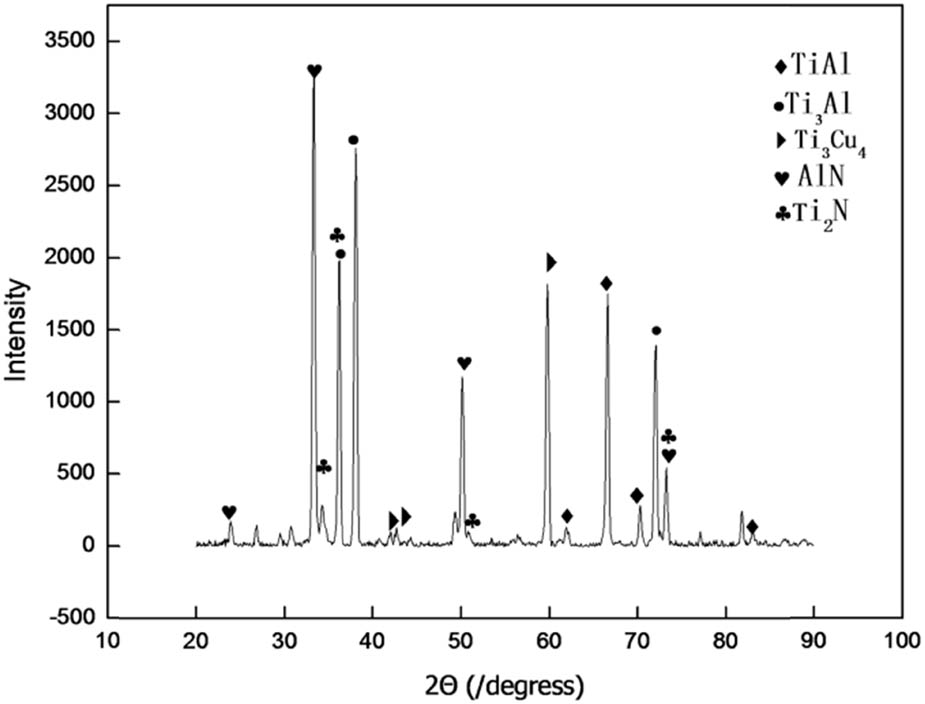
Figure 10
Phase analysis of Cu-coated metal layers on the ceramic surface under the atmosphere of Ar.
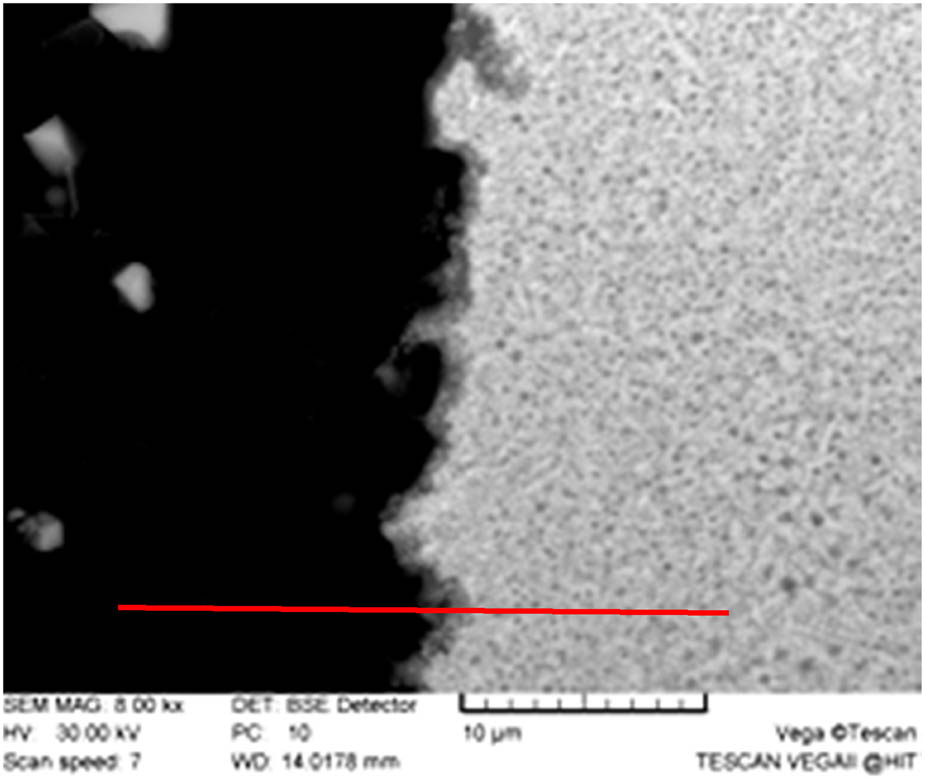
Figure 11
Scanning path of interface between the ceramic and Cu-coated layers by laser welding.
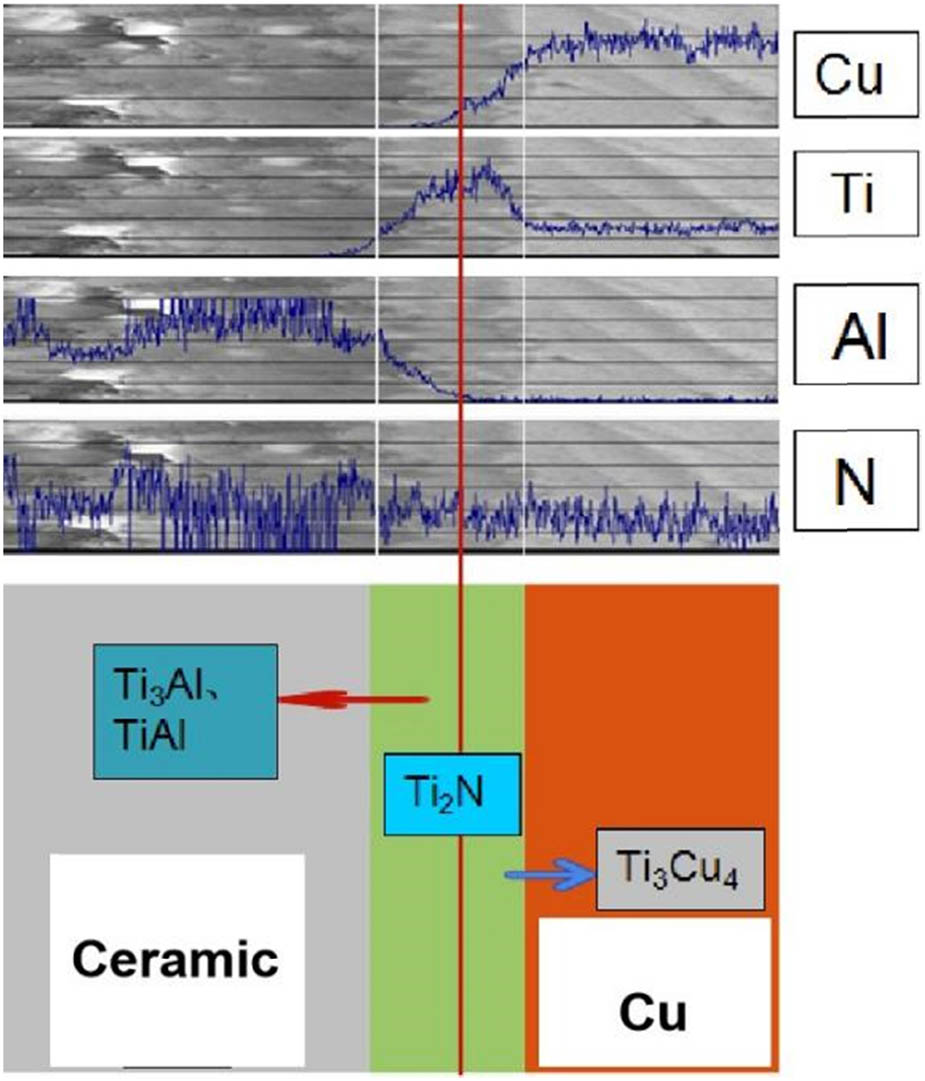
Figure 12
Metallurgical reaction diagram of the transition layer by laser cladding.