
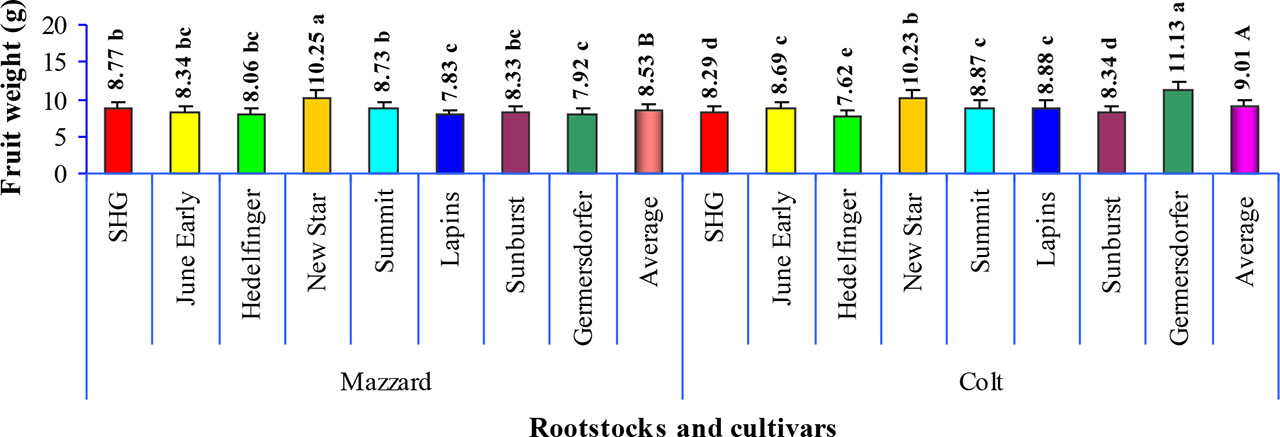
Fig. 1:
Average fruit weigh of eight sweet cherry cultivars grafted on Mazzard seedlings and clonal Colt rootstocks. Data are mean for 2019 and 2020. Different small letters at the top of the column indicate significant differences between cultivars within rootstocks, while different capital letters indicate significant differences between rootstocks at P ≤ 0.05 by LSD test.
Tab. 1:
Total phenolics, total flavonoid, vitamin C, condensed tannins and gallotannins contents of eight sweet cherry cultivars grafted on Mazzard and Colt rootstocks. Data are the mean ± SE for 2019 and 2020.
| Rootstock | Cultivar | Total phenolics content (mg GAE g−1) | Total flavonoids content (mg RUE g‒1) | Vitamin C (mg 100 g‒1) | Total anthocyanins content (mg 100 g‒1) | Condensed tannins (mg GAE g‒1) | Gallotannins (mg GAE g‒1) |
|---|---|---|---|---|---|---|---|
| Mazzard | SHG | 1.87 ± 0.06 c | 1.04 ± 0.07 bc | 6.87 ± 0.11 d | 0.72 ± 0.03 b | 7.62 ± 0.15 b | 3.72 ± 0.11 b |
| June Early | 2.03 ± 0.05 b | 1.11 ± 0.04 b | 10.56 ± 0.14 a | 0.92 ± 0.05 a | 7.12 ± 0.23 c | 3.42 ± 0.09 c | |
| Hedelfinger | 2.05 ± 0.07 ab | 0.94 ± 0.04 c | 7.85 ± 0.34 c | 0.85 ± 0.07 a | 7.11 ± 0.20 c | 3.51 ± 0.09 c | |
| New Star | 0.44 ± 0.01 f | 0.32 ± 0.03 f | 9.17 ± 0.30 b | 0.27 ± 0.03 e | 5.21 ± 0.18 e | 2.54 ± 0.08 e | |
| Summit | 2.10 ± 0.06 a | 1.08 ± 0.05 bc | 9.22 ± 0.19 b | 0.42 ± 0.03 d | 8.36 ± 0.20 a | 4.28 ± 0.16 a | |
| Lapins | 2.12 ± 0.07 a | 1.29 ± 0.05 a | 8.32 ± 0.07 c | 0.47 ± 0.02 cd | 6.32 ± 0.21 d | 3.27 ± 0.12 d | |
| Sunburst | 1.05 ± 0.07 e | 0.73 ± 0.03 d | 6.15 ± 0.30 e | 0.51 ± 0.03 c | 7.68 ± 0.17 b | 3.60 ± 0.19 bc | |
| Germersdorfer | 1.45 ± 0.04 d | 0.64 ± 0.03 e | 8.47 ± 0.33 c | 0.45 ± 0.03 cd | 6.58 ± 0.17 d | 3.04 ± 0.13 d | |
| Mean | 1.64 ± 0.05 B | 0.90 ± 0.04 A | 8.32 ± 0.23 A | 0.58 ± 0.04 B | 7.00 ± 0.19 A | 3.42 ± 0.13 A | |
| Colt | SHG | 1.75 ± 0.07 bc | 1.07 ± 0.07 b | 6.95 ± 0.12 e | 0.77 ± 0.04 c | 7.65 ± 0.14 b | 3.75 ± 0.12 b |
| June Early | 2.23 ± 0.06 a | 1.24 ± 0.07 ab | 10.63 ± 0.39 a | 0.86 ± 0.04 b | 7.32 ± 0.19 c | 3.53 ± 0.12 bc | |
| Hedelfinger | 1.94 ± 0.06 b | 0.89 ± 0.05 c | 7.53 ± 0.10 d | 0.93 ± 0.06 a | 7.43 ± 0.11 c | 3.71 ± 0.09 b | |
| New Star | 0.52 ± 0.03 d | 0.34 ± 0.03 d | 9.52 ± 0.15 b | 0.38 ± 0.04 f | 5.60 ± 0.07 f | 2.73 ± 0.11 d | |
| Summit | 2.13 ± 0.08 ab | 1.11 ± 0.04 b | 9.28 ± 0.10 b | 0.44 ± 0.03 ef | 8.39 ± 0.18 a | 4.34 ± 0.15 a | |
| Lapins | 2.19 ± 0.09 a | 1.33 ± 0.10 a | 8.39 ± 0.09 c | 0.53 ± 0.03 de | 6.10 ± 0.20 e | 3.33 ± 0.12 c | |
| Sunburst | 1.67 ± 0.09 bc | 1.00 ± 0.05 bc | 6.22 ± 0.20 f | 0.56 ± 0.02 d | 7.72 ± 0.16 b | 3.69 ± 0.20 b | |
| Germersdorfer | 1.58 ± 0.05 c | 0.66 ± 0.03 c | 8.50 ± 0.10 c | 0.49 ± 0.03 e | 6.61 ± 0.15 d | 3.11 ± 0.13 c | |
| Mean | 1.75 ± 0.07 A | 0.96 ± 0.05 A | 8.38 ± 0.16 A | 0.62 ± 0.04 A | 7.10 ± 0.15 A | 3.52 ± 0.13 A |
Tab. 2:
Total antioxidant capacity, inhibitory activity against lipid peroxidation, hydroxyl radical scavenging activity and DPPH scavenging activity of eight sweet cherry cultivars grafted on Mazzard and Colt rootstocks. Data are the mean ± SE for 2019 and 2020.
| Rootstock | Cultivar | Total antioxidant capacity (μg AA g−1) | Inhibitory activity against lipid peroxidation aIC50 (µg mL‒1) | Hydroxyl radical scavenging activity aIC50 (µg mL‒1) | DPPH scavenging activity aIC50 (µg mL‒1) |
|---|---|---|---|---|---|
| Mazzard | SHG | 2.09 ± 0.05 b | 33.24 ± 0.43 ab | 34.44 ± 0.45 b | 47.34 ± 0.38 g |
| June Early | 1.62 ± 0.06 c | 32.12 ± 0.37 b | 37.89 ± 0.34 ab | 71.12 ± 0.67 b | |
| Hedelfinger | 2.24 ± 0.07 a | 33.54 ± 0.40 ab | 39.54 ± 0.40 a | 86.00 ± 0.59 a | |
| New Star | 0.94 ± 0.03 f | 33.79 ± 0.50 ab | 39.85 ± 0.54 a | 47.31 ± 0.63 g | |
| Summit | 1.65 ± 0.04 c | 32.57 ± 1.03 ab | 35.47 ± 1.35 b | 57.02 ± 0.54 e | |
| Lapins | 1.29 ± 0.04 d | 31.91 ± 0.39 b | 30.86 ± 1.45 c | 59.23 ± 0.49 d | |
| Sunburst | 1.17 ± 0.05 e | 31.65 ± 0.48 b | 32.02 ± 1.36 bc | 68.10 ± 0.53 c | |
| Germersdorfer | 1.30 ± 0.05 d | 34.96 ± 1.00 a | 29.96 ± 2.04 c | 54.62 ± 0.42 f | |
| Mean | 1.54 ± 0.05 A | 32.97 ± 0.58 A | 35.00 ± 0.99 A | 61.44 ± 0.53 A | |
| Colt | SHG | 2.12 ± 0.05 a | 33.47 ± 0.43 ab | 34.98 ± 0.97 b | 47.54 ± 0.30 h |
| June Early | 1.71 ± 0.05 b | 31.61 ± 0.74 b | 38.61 ± 0.37 b | 71.27 ± 0.62 b | |
| Hedelfinger | 2.11 ± 0.06 a | 34.11 ± 0.44 a | 40.42 ± 1.17 a | 86.94 ± 0.57 a | |
| New Star | 1.07 ± 0.03 d | 34.65 ± 0.34 a | 40.07 ± 0.72 a | 49.27 ± 0.73 g | |
| Summit | 1.67 ± 0.08 b | 32.63 ± 0.34 b | 35.65 ± 0.64 ab | 57.14 ± 0.40 e | |
| Lapins | 1.32 ± 0.04 c | 32.10 ± 0.92 b | 30.75 ± 1.26 c | 60.04 ± 0.58 d | |
| Sunburst | 1.19 ± 0.06 d | 31.70 ± 0.30 b | 31.36 ± 1.36 c | 68.13 ± 0.44 c | |
| Germersdorfer | 1.36 ± 0.05 c | 34.99 ± 1.32 a | 29.99 ± 2.26 c | 54.68 ± 0.38 f | |
| Mean | 1.57 ± 0.05 A | 33.16 ± 0.60 A | 35.23 ± 1.09 A | 61.88 ± 0.50 A |
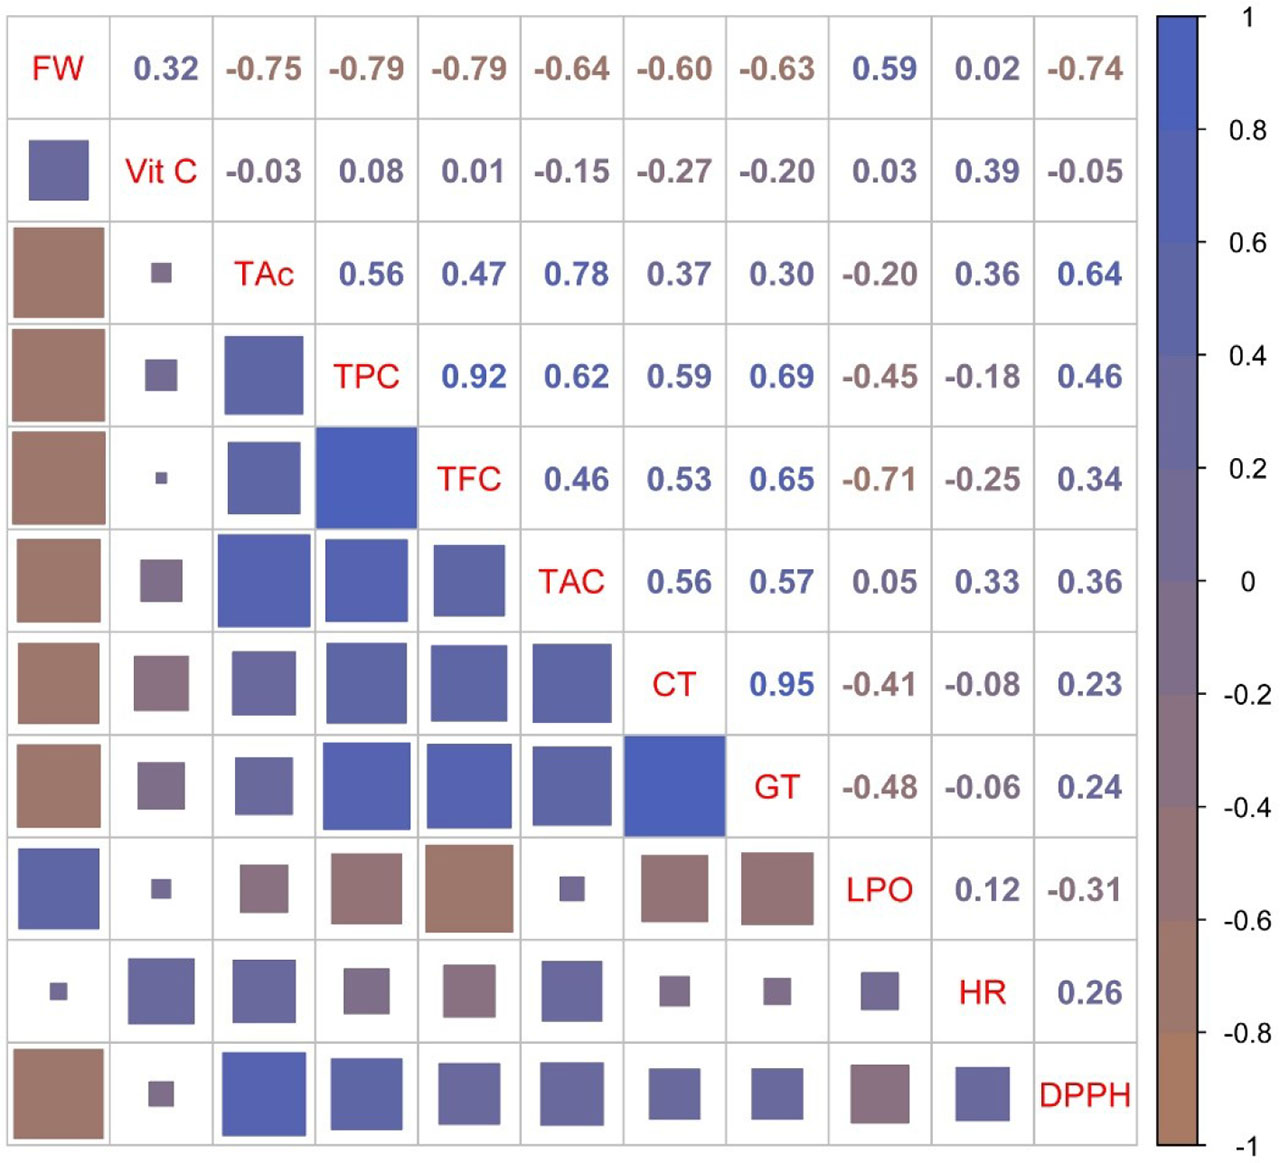
Fig. 2:
Pearson’s correlation coefficients for 11 studied fruit quality properties of 8 commercial sweet cherry cultivars. The size of the square for each correlation and the color reflect the statistical significance and magnitude of the correlation coefficient (r). Brown squares indicate negative correlations, whereas blue stands for positive correlations.
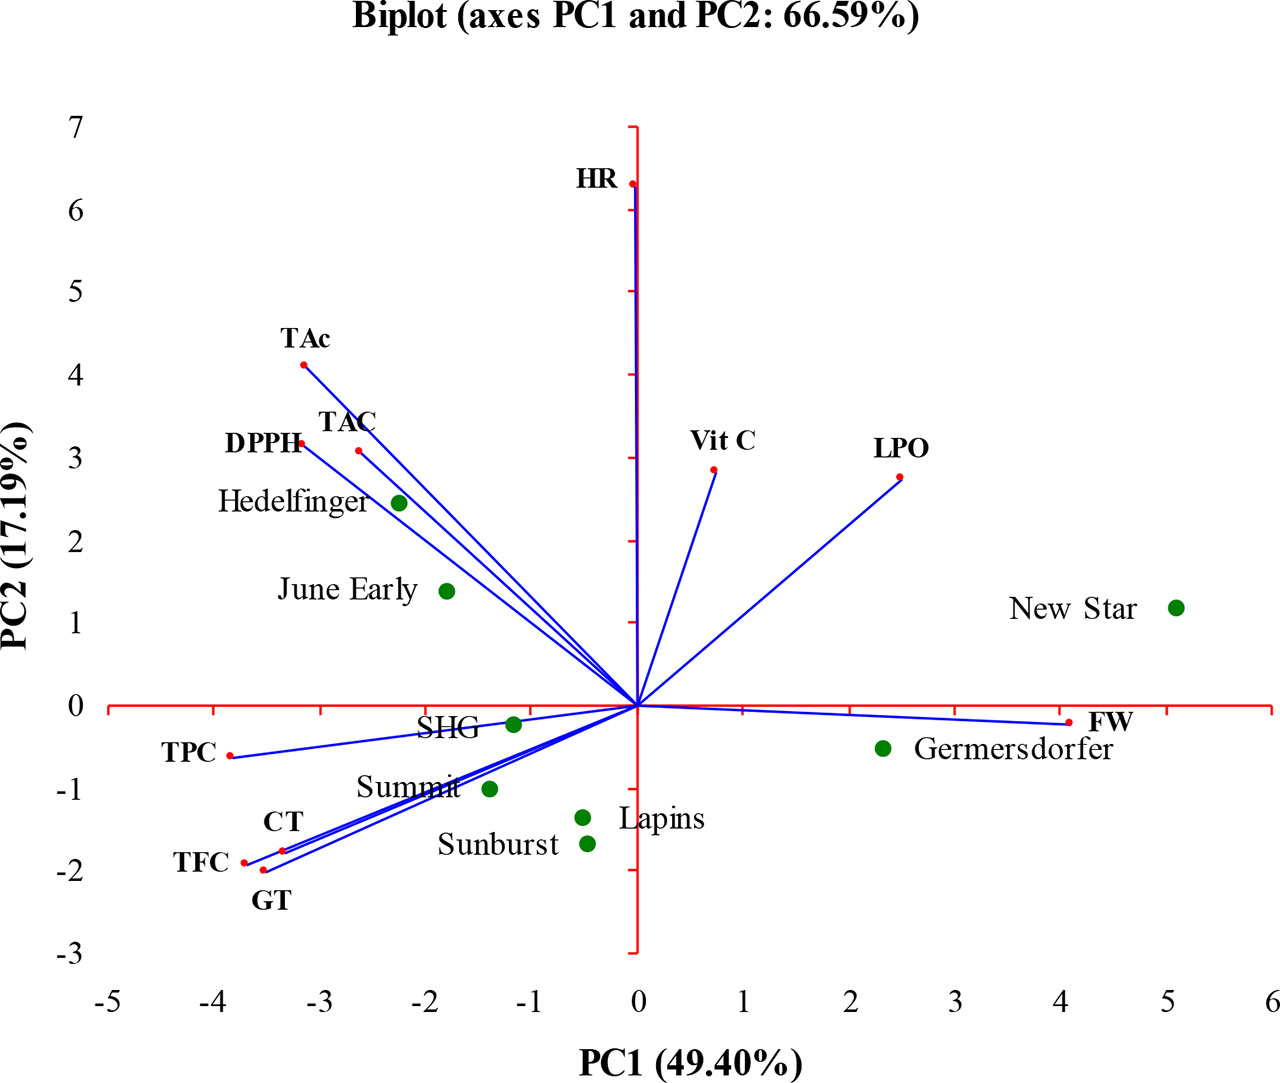
Fig. 3:
Segregation of 8 sweet cherry cultivars according to their fruit weight, phenolic compounds content and antioxidant activity determined by principal component analysis (PCA).