
The walnut tree is a monoecious species, which means it has male and female flowers on the same tree but at different locations. It is primarily wind-pollinated and exhibits dichogamy, a mechanism that prevents self-fertilization. This makes the walnut an outcrossing species with a heterozygous genetic structure, leading to wide genetic diversity and phenological variation. In Turkey, walnuts have been mainly cultivated from non-grafted seedlings for many years. However, recent research has focused on identifying superior genotypes from natural populations for breeding programs (Muradoğlu, 2005; Akça, 2016). Initially, cultivars in fruit crops were classified based on morphological traits such as leaves, flower structure, and fruit shape. However, genotypes were significantly affected by changing environmental conditions, making it difficult to establish clear relationships between characters (Güler et al., 2024). Biotechnological methods, such as molecular markers, have been introduced alongside classic breeding techniques to reduce breeding time in walnut breeding (Vahdati et al., 2019). Recent genetic studies have utilized DNA-based markers to accurately characterize and identify the genetic resources of walnut trees (Ruiz-Garcia et al., 2011; Itoo et al., 2023).
In walnut breeding programs, hybridization and selection traditionally require lengthy periods, prompting the adoption of biotechnological methods like molecular markers to expedite breeding timelines. Thus, classic and biotechnical techniques have been integrated into breeding programs, with recent years witnessing the application of various molecular methods to characterize and identify plant genetic resources (Badenes and Parfitt, 1998; Li and Quiros, 2000). Molecular marker technologies, particularly DNA-based markers, offer precise results independent of environmental influences, enabling targeted gene tracking and exploration of biotechnological DNA levels (Adhikari et al., 2017). These markers are pivotal in genetic applications such as genetic tagging, mapping, phylogenetic analysis, and gene discovery (Filiz and Koc, 2011). Among the efficient and widely utilized molecular markers there are Random Amplified Polymorphic DNA (RAPD) and Inter-Simple Sequence Repeat (ISSR) markers, which swiftly evaluate and characterize genetic material, facilitating cultivar identification and genome fingerprinting (Welsh and McClelland, 1990). These markers are cost-effective, labor-efficient, and offer rapid identification of cultivars, genetic resource variation, population structure analysis, gene tagging, genetic mapping, and genome fingerprinting, even without prior genome sequence information (Biabani et al., 2013; Doğan et al., 2014; Güler et al., 2024).
A recent addition to the molecular marker arsenal is retrotransposon-based amplification technology specifically the Inter-Primer Binding Site (iPBS) retrotransposons. These Long Terminal Repeat (LTR) retrotransposons, applicable in both plants and animals, serve as universal DNA markers capable of enhancing genome size and generating variations, thereby making them highly effective molecular markers (Kalendar et al., 2010; Schulman et al., 2004). Different retrotransposon marker systems have found widespread use in evolutionary and genetic diversity studies due to their versatility, ease of use, and high genotype resolution (Feschotte et al., 2002; Kalendar and Schulman, 2006).
Despite the application of various molecular markers, genetic relationships among walnut genotypes remain incompletely understood, prompting the use of new and combined markers. However, few studies have comprehensively explored genetic diversity using multiple markers simultaneously within the same walnut population materials. This study evaluated the efficiency of RAPD, ISSR, and iPBS markers and assessed the genetic diversity and relationships among walnut genotypes collected from the Sanliurfa regions of Turkey. This is the first study that characterized walnut genotypes using the iPBS retrotransposon markers in combination with ISSR and RAPD.
In the current study, we have identified twenty promising walnut genotypes with superior fruit characteristics over two consecutive growing seasons, according to UPOV criteria. These genotypes, which naturally grow on their roots, were collected from seven different regions (city center, Eyyubiye, Karaköprü, Haliliye, Bozova, and Harran districts) in Şanlıurfa. The study comprised 5 genotypes from Karaköprü, 4 from city center, 3 each from Haliliye and Viranşehir, 2 each from Eyyübiye and Bozova and one genotype from Harran. The map illustrating the collection site is represented in Fig. 1. The geographic coordiates for each genotype are provided in Tab. 1.
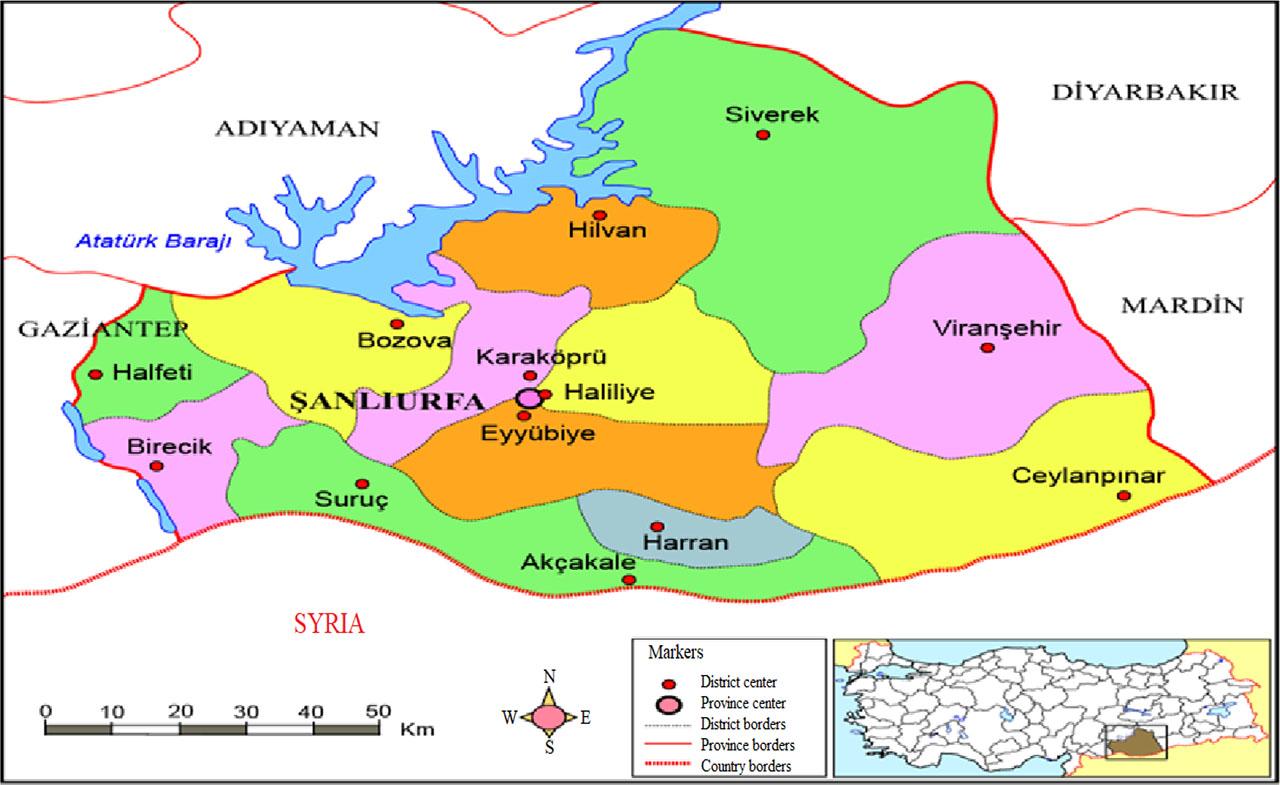
The map of Şanlıurfa province illustrates the locations of collection sites. In the bottom right corner, a map of Türkiye shows the location of Şanlıurfa province.
Geographic coordinates and altitudes of promising walnut genotypes.
| Genotype No | Coordinate | Altitude |
|---|---|---|
| 8 | 37°20′41″N 38°58′10″E | 631 m |
| 15 | 37°05′05″N 39°02′57″E | 420 m |
| 18 | 37°02′17″N 39°37′17″E | 518 m |
| 26 | 37°02′13″N 39°37′21″E | 526 m |
| 27 | 37°06′05″N 38°48′13″E | 515 m |
| 29 | 37°20′46″N 38°58′16″E | 656 m |
| 30 | 37°17′19″N 39°00′18″E | 584 m |
| 31 | 37°02′17″N 39°37′24″E | 527 m |
| 36 | 37°18′31″N 38°50′09″E | 742 m |
| 45 | 37°08′34″N 38°32′45″E | 796 m |
| 48 | 37°00′15″N 39°00′26″E | 390 m |
| 61 | 37°18′26″N 38°36′03″E | 746 m |
| 73 | 37°18′31″N 38°50′11″E | 741 m |
| 75 | 37°16′20″N 38°41′14″E | 714 m |
| 76 | 37°18′28″N 38°36′01″E | 748 m |
| 89 | 37°18′29″N 38°50′13″E | 738 m |
| 90 | 37°13′44″N 38°42′55″E | 754 m |
| 94 | 36°48′22″N 39°29′00″E | 470 m |
| 103 | 37°02′19″N 39°37′24″E | 511 m |
| 118 | 37°16′24″N 38°41′15″E | 710 m |
First, we carefully collected and labeled leaf samples and transported them to the laboratory in sterile 50 ml tubes stored in an icebox to maintain their integrity. Upon arrival, one leaf from each sample was promptly frozen with liquid nitrogen and then homogenized using a mortar and pestle under liquid nitrogen conditions to ensure DNA isolation. Around 100 mg of the homogenized tissue were transferred into 1.5 ml microcentrifuge tubes and treated with preheated (65°C) extraction and lysis buffer. This was followed by two rounds of chloroform: isoamyl alcohol mix (24:1) and a precipitation step using 100% isopropanol. The resulting DNA was quantified using a DS-11 FX+ spectrophotometer (Denovix, USA) and diluted to a concentration of 10 ng/μl with sterile ultra-pure water. The template DNA samples were then stored at −20 ℃ until further use.
The study utilized three iPBS markers as described by Kalendar et al. (2010), in addition to two ISSR (Godwin et al., 1997) and three RAPD (Lynch and Milligan, 1994) markers (Tab. 1), to produce distinct and well-defined fragments for the walnut genotypes collected from Şanlıurfa Province. The RAPD analysis used three primers: OPF10 with the sequence GGAAGCTTGG, OPA18 (AGGTGACCGT), and OPAZ04 (CCAGCCTCAG). For the ISSR markers, two primers were employed: HR08 (GA)8YC, represented by the sequence GAGAGAGAGAGAGAGAYC, and SDo7 (CT)8RG, with the sequence CTCTCTCTCTCTCTCTRG. Lastly, the iPBS analysis included four primers: 2376 (TAGATGGCACCA), 2238 (ACCTAGCTCATGATGCCA), 2394 (GAGCCTAGGCCA), and 2415 (CATCGTAGGTGGGCGCCA). These primers were selected for their suitability in amplifying polymorphic regions to enhance the understanding of genetic diversity within the studied population.
PCR amplification with the selected primers was conducted in a 25 μL reaction mixture comprising 1× Dream Taq Buffer, 0.2 mM dNTPs, 1 μM primer concentration, 1.2 units of Dream Taq DNA polymerase (Thermo Fischer Scientific, USA), 0.04 units of Pfu DNA polymerase (Thermo Fischer Scientific, USA), and 20 ng template DNA. The PCR reactions were performed using a T100 thermocycler under optimized conditions: for iPBS markers, 35 cycles of 30 s at 94°C, 30 s at 50–62°C (depending on primers), and 2 min at 72°C; for ISSR markers, 60 s at 94°C, 60 s at 52–54°C (depending on primers), and 90 s at 72°C; for RAPD markers, 60 s at 94°C, 30 s at 36°C, and 90 s at 72°C. Each PCR reaction included an initial denaturation step of 3 min at 94°C and a final extension step of 10 min at 72°C. The amplified fragments were separated on a 1.6% (w/v) agarose gel in 1x TAE buffer for over 2 hours and stained with ethidium bromide. Visualization was achieved using a UV transilluminator (G: BOX F3, Syngene, UK). All PCR amplifications were repeated at least twice, and only reproducible bands were considered for evaluation. The iPBS analyses generated a binary data matrix scoring fragments as present (1) or absent (0) at specific positions. The effectiveness of each marker system in assessing genetic variation, as well as the determination of resolving power (RP) and polymorphic information content (PIC) values, followed methodologies proposed by Prevost and Wilkinson (1999) and Roldàn-Ruiz et al. (2000), respectively.
The primers’ sequences and codes, along with their characteristics such as GC content (%), total bands (TB), polymorphic bands (PB), percentage of polymorphic bands (PPB %), polymorphism information content (PIC), and resolving power (RP), were documented. Mantel tests were conducted to evaluate correlations between different sets of molecular markers using GenALEX ver. 6.5 (Peakall and Smouse, 2012). Data matrices generated from the marker systems were merged and transformed into genetic similarity matrices utilizing Jaccard’s similarity coefficient. The Numerical Taxonomy System (NTSYS-pc version 2.10e program, Rohlf, 2000) was employed to conduct an unweighted pair group method using arithmetic average (UPGMA) clustering analysis. Population structure analysis was performed using a Bayesian model-based algorithm on the binary matrix of individuals, implemented in the software package Structure v.2.3.4 (Pritchard et al., 2000).
The RAPD primers consistently produced polymorphic bands yielding a total of 23 amplified polymorphic bands across the genotypes. The number of polymorphic bands ranged from 6 (OPAZ04 primer) to 10 (OPA18 primer) bands, averaging 7.77 bands per primer pair with a polymorphism rate of 75.53%. The PIC values varied from 0.24 (OPF10 primer) to 0.40 (OPAZ04 primer), averaging 0.31 per primer. The RP ranged from 3.50 (OPF10 primer) to 6.70 (OPA18 primer), with an average of 4.93 (Tab. 2).
The information of RAPR, ISSR, and iPBS markers used to evaluate walnut genotypes
| Primer ID | Primer sequences (5′–3′) | Tm | GC (%) | TB | PB | PPB | PIC | RP | |
|---|---|---|---|---|---|---|---|---|---|
| RAPD | OPF10 | GGAAGCTTGG | 36.0 | 60.0 | 10 | 7 | 70.00 | 0.24 | 3.50 |
| OPA18 | AGGTGACCGT | 36.0 | 60.00 | 14 | 10 | 71.43 | 0.30 | 6.70 | |
| OPAZ04 | CCAGCCTCAG | 36.0 | 70.00 | 7 | 6 | 85.71 | 0.40 | 4.60 | |
| Total | 31 | 23 | - | - | - | ||||
| Mean | 10.33 | 7.77 | 75.53 | 0.31 | 4.93 | ||||
| ISSR | HR08 | GAGAGAGAGAGAGAGAYC | 52.0 | 52.8 | 9 | 6 | 66.67 | 0.22 | 3.00 |
| SDo7 (CT)8RG | CTCTCTCTCTCTCTCTRG | 54.0 | 52.8 | 13 | 11 | 84.62 | 0.27 | 4.80 | |
| Total | 22 | 17 | - | - | - | ||||
| Mean | 11.00 | 8.50 | 75.65 | 0.25 | 3.90 | ||||
| iPBS | 2376 | TAGATGGCACCA | 43.1 | 50.0 | 17 | 13 | 76.47 | 0.22 | 5.30 |
| 2238 | ACCTAGCTCATGATGCCA | 55.5 | 50.0 | 18 | 12 | 66.67 | 0.21 | 5.30 | |
| 2394 | GAGCCTAGGCCA | 48.5 | 66.7 | 14 | 10 | 71.43 | 0.21 | 4.00 | |
| 2415 | CATCGTAGGTGGGCGCCA | 62.5 | 66.7 | 16 | 12 | 75.00 | 0.22 | 4.60 | |
| Total | 65 | 47 | - | - | - | ||||
| Mean | 16.25 | 11.75 | 72.39 | 0.22 | 4.80 | ||||
GC (%): percentages of guanine-cytosine content, TB: total band, PB: polymorphic band, PPB (%): percentage of the polymorphic band, PIC: polymorphism information content, RP: resolving power
The ISSR primers amplified a total of 22 fragments, all of which were polymorphic (75.65%). Fragment amplification varied from 6 (HR08 (GA)8YC primer) to 11 (SDo7 (CT)8RG primer), averaging 8.50 fragments per primer. PIC values ranged from 0.22 (HR08 (GA)8YC primer) to 0.27 (SDo7 (CT)8RG primer), averaging 0.25 per primer. The RP values ranged from 3.00 (HR08 primer) to 4.80 (SDo7 primer), with an average of 3.90 (Tab. 2).
The iPBS primers generated a total of 65 bands, with 72.39% of them being polymorphic. Fragment amplification ranged from 10 (2394 primer) to 13 (2376 primer), averaging 11.75 fragments per primer. PIC values ranged from 0.21 (2238 and 2394 primers) to 0.22 (2376 and 2415 primers), averaging 0.22 per primer. The RP values ranged from 4.00 (2394 primer) to 5.30 (2376 primer), with an average of 4.80 (Tab. 2).
Diversity parameters obtained by different molecular markers utilized on walnuts indicate that the iPBS marker system has a mean number of different alleles (Na) of 1.723, a number of effective alleles (Ne) of 1.256, Shannon’s information index (I) of 0.275, expected heterozygosity (He) of 0.170, and unbiased expected heterozygosity (uHe) of 0.174. The ISSR marker system shows a higher genetic diversity with a mean Na of 1.773, Ne of 1.460, I of 0.392, He of 0.263, and uHe of 0.270. The RAPD marker system presents a mean Na of 1.742, Ne of 1.440, I of 0.391, He of 0.261, and uHe of 0.268. The combined marker system, integrating data from all marker types, provides a comprehensive view with a mean Na of 1.737, Ne of 1.342, I of 0.327, He of 0.211, and uHe of 0.217 (Tab. 3). These findings highlight that the ISSR marker system exhibits the highest genetic diversity among the walnut genotypes, whereas the iPBS marker system shows the lowest. The combined analysis yields intermediate values, reflecting an integrated measure of genetic diversity across all marker systems.
Diversity parameters obtained by different molecular markers utilized on walnuts.
| N | Na | Ne | I | He | uHe | ||
|---|---|---|---|---|---|---|---|
| iPBS | Mean | 20.000 | 1.723 | 1.256 | 0.275 | 0.170 | 0.174 |
| Std. Err. | 0.000 | 0.056 | 0.034 | 0.029 | 0.020 | 0.020 | |
| ISSR | Mean | 20.000 | 1.773 | 1.460 | 0.392 | 0.263 | 0.270 |
| Std. Err. | 0.000 | 0.091 | 0.085 | 0.059 | 0.043 | 0.044 | |
| RAPD | Mean | 20.000 | 1.742 | 1.440 | 0.391 | 0.261 | 0.268 |
| Std. Err. | 0.000 | 0.080 | 0.064 | 0.048 | 0.034 | 0.035 | |
| Combined | Mean | 20.000 | 1.737 | 1.342 | 0.327 | 0.211 | 0.217 |
| Std. Err. | 0.000 | 0.041 | 0.031 | 0.023 | 0.017 | 0.017 |
N= Number of alleles, Na = Number of different alleles, Ne = Number of effective alleles, I = Shannon’s information index, He = Expected heterozygosity, uHe = Unbiased expected heterozygosity.
The correlation analysis of the three marker types and combined markers linked to the Mantel test showed a significant correlation among the markers. The results are submitted in Tab. 4. The lowest correlation was monitored between the RAPD and iPBS markers (r=0.006), while the highest correlation was determined between the iPBS markers and the combination of the three-marker analysis (r=0.786). Mantel test results displayed a significant correlation with the r-value larger than 0.5 among the three marker types, the combined data with RAPD (0.541) and iPBS markers (0.786), whereas the correlations were observed all less than 0.5 between other molecular markers. These differences are due to the development characteristics of the molecular markers. Therefore, the use of combined molecular markers will make significantly contributions to the definitions of diversity and relationships of walnut genetic resources.
Mantel test correlation coefficient between studied molecular markers based on RAPD, ISSR, iPBS, and combined data
| RAPD | ISSR | iPBS | |
|---|---|---|---|
| ISSR | 0.277 | ||
| iPBS | 0.006 | 0.068 | |
| Combined | 0.541 | 0.469 | 0.786 |
The clustering analysis of walnut genotypes was performed using three different marker systems: RAPD, ISSR, and iPBS, as well as a combined analysis of all markers. The results were presented in the form of dendrograms, which showed the genetic relationships and clustering patterns among the genotypes (Fig. 2). In the RAPD dendrogram, the genotypes were clustered into three main groups. The red cluster contained genotypes 8, 26, 27, 29, 36 48, and 61 indicating a close genetic relationship among these genotypes. The green cluster included genotypes 15, 30, 31, 76, 89, 90, and 91 showing another distinct genetic grouping. The blue cluster comprised genotypes 18, 45, 73, 75, 103, and 118 which were more genetically distant from the other two clusters (Fig. 2).
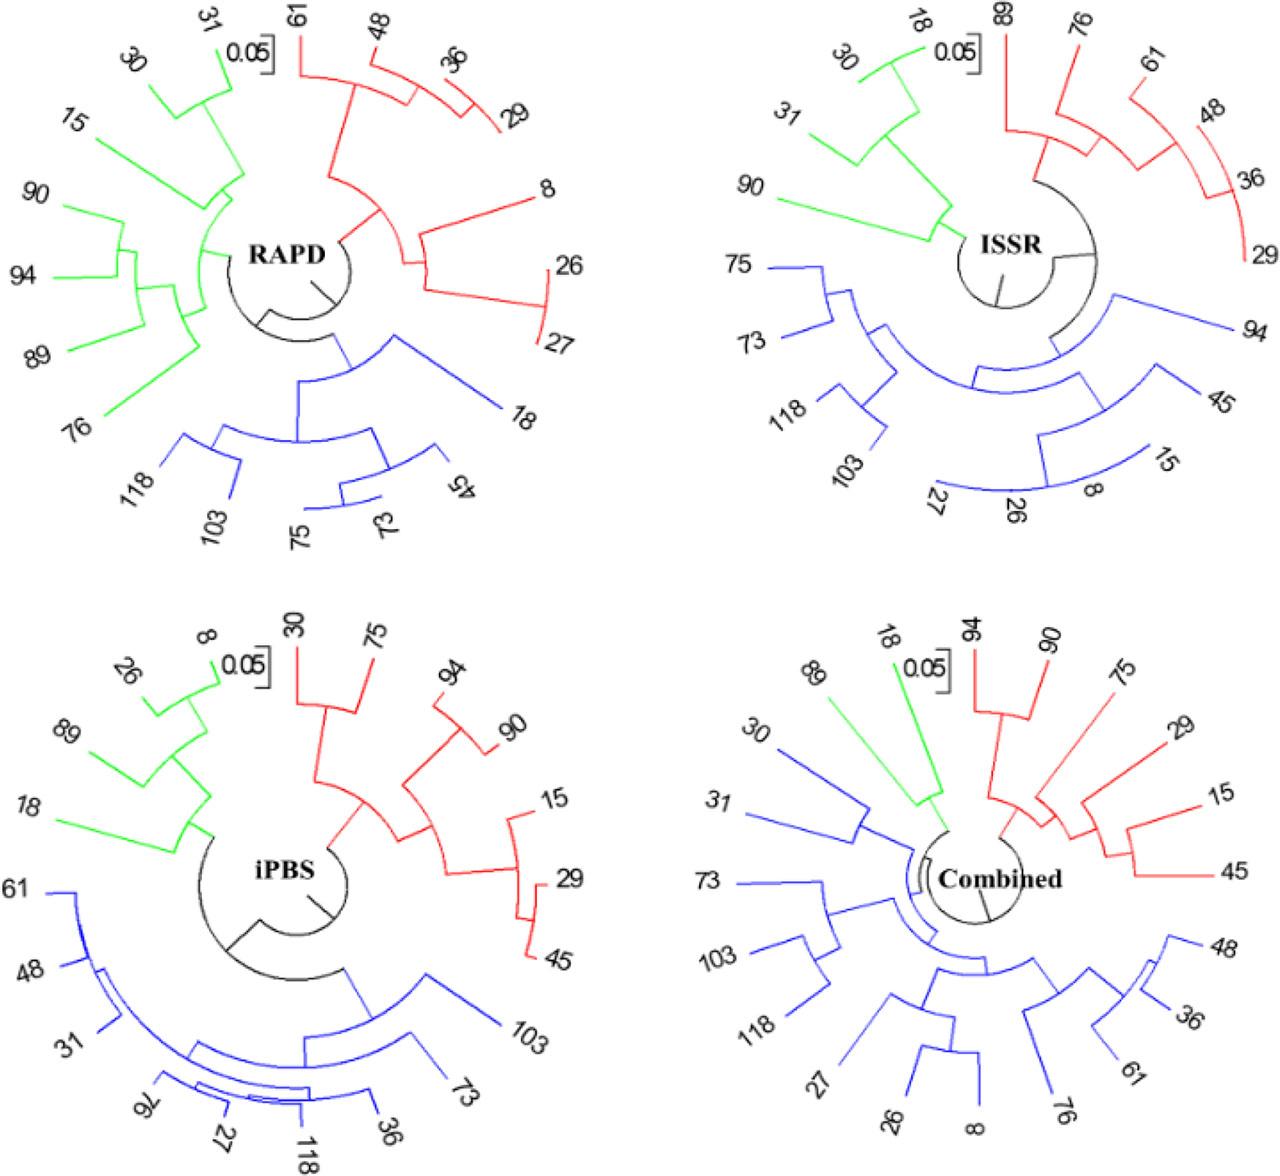
Dendrogram of 20 promising walnut genotypes using UPGMA method based on RAPD, ISSR, iPBS, and combined data.
The ISSR dendrogram also revealed three main clusters. The red cluster included genotypes 29, 36, 48, 61, 76, and 89. The green cluster contained genotypes 18, 30, 31, and 90 indicating another distinct grouping. The blue cluster comprised the rest as 8, 15, 26, 27 together with 45, 73, 75, 94, 103, and 118, showing a more diverse genetic relationship (Fig. 2).
The iPBS dendrogram showed a slightly different clustering pattern with three main groups. The red cluster included genotypes 15, 29, 30, 45, 75, 90, and 94 similar to the RAPD and ISSR results. The green cluster contained genotypes 8, 18, 26, and 89, indicating another distinct grouping. The blue cluster comprised the rest of the genotypes, showing a more diverse genetic relationship (Fig. 2).
The combined analysis dendrogram, which integrated the data from RAPD, ISSR, and iPBS markers, provided a more comprehensive view of the genetic relationships among the genotypes. The red cluster included genotypes 15, 29, 45, 75, 90, and 94 consistently indicating their close genetic relationship across all marker systems. The green cluster contained genotypes 18 and 89.. The blue cluster comprised most of the genotypes as 8, 26, 27, 30, 31, 36, 48, 61, 73, 76, 103, and 118, exhibiting a broader genetic diversity (Fig. 2).
The clustering analysis using different marker systems revealed consistent genetic relationships among some walnut genotypes, particularly in the cluster containing genotypes 8, 26, and 27 which appeared closely related across all analyses. The other clusters possessed some variability depending on the marker system used, indicating different aspects of genetic diversity being captured by each marker type. The combined analysis provided a more robust understanding of the genetic structure of the walnut genotypes, integrating the strengths of each marker system to give a comprehensive view of their genetic relationships.
The PCoA results for the twenty promising walnut genotypes, based on ISSR, RAPD, iPBS, and combined markers, revealed distinct clustering patterns and genetic relationships (Fig. 3). The principal coordinates of the analyzed twenty promising walnut genotypes depend on the applied molecular markers. In the ISSR marker analysis, PC 1 explained 33.75% and PC 2 explained 24.59% of the variance. It was observed that genotypes 94, 73, and 75 were closely related, clustered near the center, indicating strong genetic similarities. Another distinct group included genotypes 48, 36, 89, and 29, which also exhibited close genetic relationships. In contrast, genotypes 15, 27, and 26 were positioned further apart from the other clusters, reflecting broader genetic diversity within this group. Genotype 76, while slightly isolated, showed some genetic similarity to the central cluster (Fig. 3).
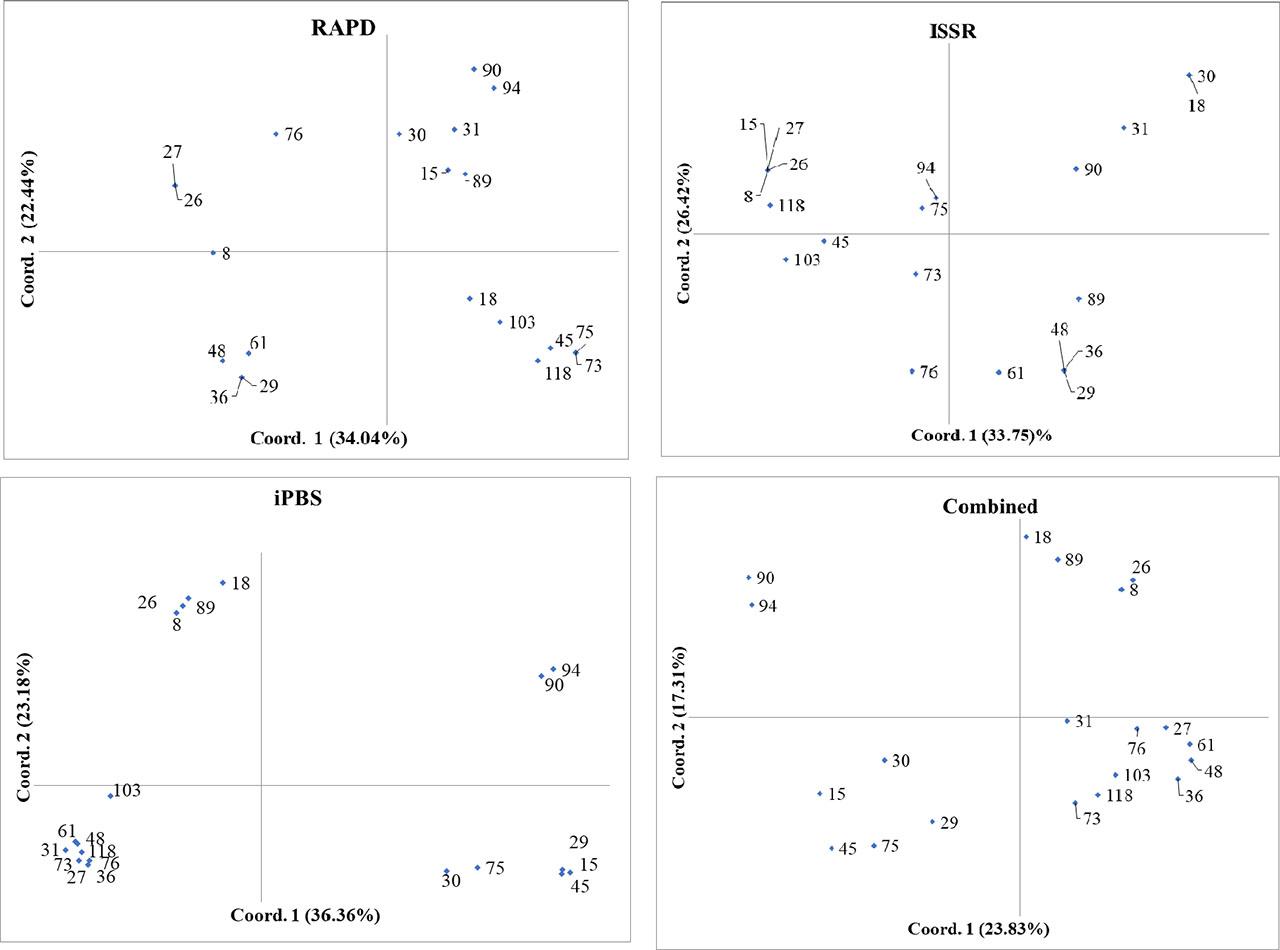
The principal coordinates of the analyzed twenty promising walnut genotypes depend on the applied molecular markers. Each point on the graph represents a specific genotype, with the positioning revealing the similarity or divergence among them based on the molecular data applied in the analysis.
For the RAPD marker analysis, PC 1 accounted for 34.04% and PC 2 for 22.44% of the variance. This analysis identified that genotypes 94, 90, 30, 31, 15, and 89 formed a closely related cluster, indicating significant genetic similarity. Another distinct cluster included genotypes 26, 27, and 8, positioned close to each other. Additionally, genotypes 61, 48, 36, and 29 exhibited greater genetic diversity and were more spread out. One of the main groups consisted of genotypes 18, 45, 75, 73, 103, and 118, which were positioned further from the main clusters, highlighting significant genetic variation (Fig. 3).
In the iPBS marker analysis, PC 1 explained 36.36% and PC 2 explained 23.81% of the variance. The analysis indicated that genotypes 94 and 90 formed a closely related cluster, demonstrating significant genetic similarities. Another cluster included genotypes 26, 8, 18, and 89, which were closely grouped. Additionally, genotypes 27, 31, 36, 48, 61, 73, 76, 103, and 118 showed broader genetic diversity and were more dispersed. Genotypes 30 and 75 were positioned further from the main clusters, indicating substantial genetic variation (Fig. 3). The combined PCoA analysis, integrating data from ISSR, RAPD, and iPBS markers, provided a comprehensive view of genetic relationships. PC 1 explained 23.83% and PC 2 explained 17.31% of the variance. This analysis revealed that genotypes 8, 18, 26 and 89 consistently formed a closely related cluster across all marker systems, demonstrating robust genetic similarities. Genotypes 90 and 94 also closely related, forming another distinct genetic grouping. Genotypes 15, 29, 30, 45, and 75 exhibited broader genetic diversity and were more dispersed compared to the other clusters On the other hand, the biggest cluster was formed by genotypes 27, 31, 36, 48, 61, 73, 76, 103, and 108, resulting in a total of four clusters in the PCA while there were three in the clustering analysis (Fig. 3). These results underscore the value of using multiple marker systems to capture a nuanced understanding of genetic diversity and relationships among walnut genotypes, providing essential insights for breeding and conservation programs.
The genetic structure of walnut genotypes was analyzed using STRUCTURE, and the results are displayed in Fig. 4a. The bar plot illustrates how individual genotypes are assigned to different genetic clusters, each represented by a different color. The analysis revealed three main genetic clusters. The red cluster primarily includes genotypes 8,30, 36, 76, 73, and 118 which exhibit a high proportion of red color, indicating their genetic similarity and grouping into one cluster. The green cluster consists mainly of genotypes 15, 18, 27, 61, 89, 90, 94, and 103, characterized by a significant proportion of green color, signifying their genetic distinctiveness from the red cluster. Lastly, genotypes 26, 29, 31, 45, 48 and 75 display a high proportion of blue color, indicating that they form a separate genetic cluster (Fig. 4a).
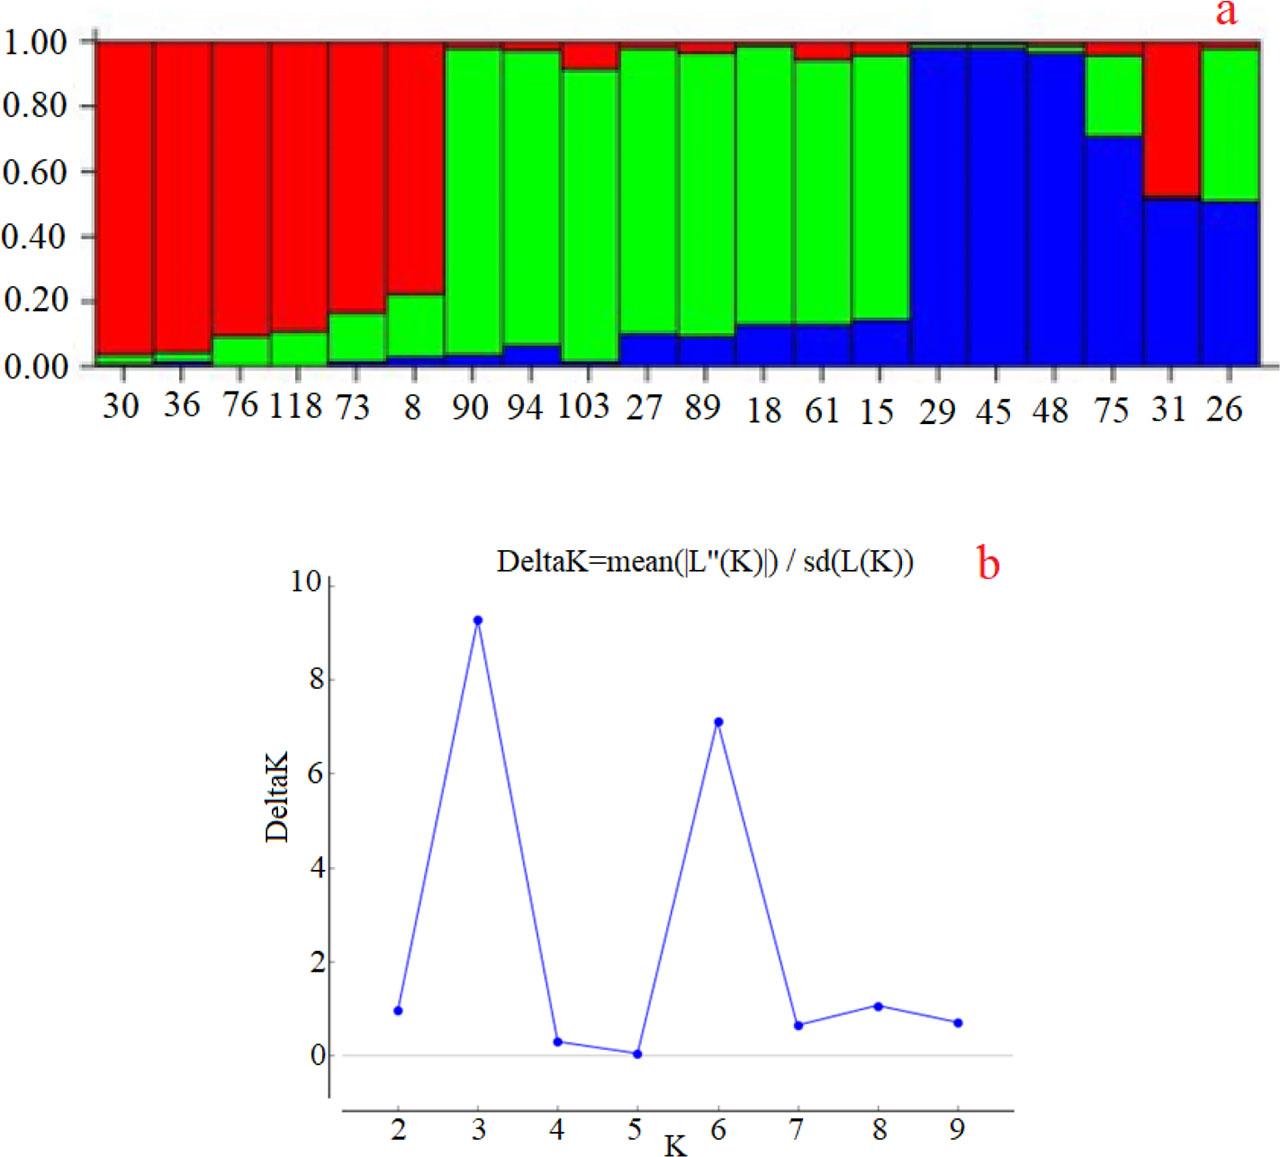
The genetic structure of walnut genotype populations carried out using STRUCTURE HARVESTER. The proportions of gene contributions (a) and Delta K values according to the Evanno test (b). Different colors represent the genetic participation ratio for each relevant group.
Some genotypes exhibit mixed colors, indicating admixture or genetic similarity to more than one cluster. For example, genotypes 15, 61, and 89 show a mix of red, green, and blue colors, suggesting they have genetic contributions from all three clusters. Genotypes 26 and 75 showed a high proportion of green, indicating their close relationship with green-colored genotypes. Additionally, genotype 31 consisted of nearly equal parts red and blue, suggesting it is a mixture of these two clusters (Fig. 4a). The Delta K plot indicates the population number of clusters (K) (Fig. 4b). The highest peak in the plot corresponds to the optimal number of clusters, K=3, confirming the presence of three distinct genetic clusters among the walnut genotypes analyzed. These results provide insights into the genetic structure and diversity of the walnut genotypes, identifying clear genetic groupings and highlighting genotypes with mixed ancestry. Understanding this genetic structure is crucial for breeding and conservation programs, as it helps identify genetically distinct groups and manage genetic resources more effectively.
The study utilized RAPD, ISSR, and iPBS markers to evaluate genetic variations in walnut genotypes, revealing significant polymorphism rates and genetic diversity. The RAPD markers produced an average of 7.77 polymorphic bands per primer pair with a polymorphism rate of 75.53%, comparable to findings by Pop et al. (2013) who reported a mean polymorphism rate of 76.3% for RAPD markers across walnut accessions. Similarly, ISSR markers in this study showed an average of 8.50 polymorphic fragments per primer with a 75.65% polymorphism rate, which aligns with Christopoulos et al. (2010), who reported an 82.8% polymorphism rate using ISSR markers in Greek walnut populations. The iPBS markers demonstrated a slightly lower polymorphism rate of 72.39%. Shah et al. (2019) reported lower polymorphism rates for RAPD markers (27.78%) but higher for ISSR markers (93.05%) in walnut genotypes. The total number of bands and polymorphic bands produced by iPBS markers in our study was higher compared to studies on other species such as Nicotiana tabacum L. (Yaldız et al., 2018), which also reported high polymorphism rates but fewer bands. The differences in the number of polymorphic bands and polymorphism rates observed in this study compared to other research might be attributed to the genetic makeup of the walnut genotypes studied and the specific markers used.
Our PIC values for RAPD markers (average 0.31) are consistent with Doğan et al. (2014), who reported similar values for walnut genotypes, while Christopoulos et al. (2010) and İpek et al. (2019) reported slightly lower PIC values for ISSR markers in walnuts. High RP values for RAPD markers were reported in cotton varieties (Iqbal et al., 1997) and melon (Garcia-Mas et al., 2000). These results confirm the robustness and informativeness of RAPD and ISSR markers in capturing genetic diversity, as supported by studies on other species such as cicer (Andeden et al., 2013), Turkish okra germplasm (Yıldız et al., 2015), and faba bean germplasm (Wang et al., 2012). The high number of bands, polymorphic bands, and polymorphism rates observed in our study indicate that RAPD, ISSR, and iPBS markers are effective tools for assessing genetic diversity in walnut genotypes. The PIC and RP values further highlight the informativeness and resolving power of these markers, supporting their use in genetic studies across various species.
The Mantel test results indicated a significant correlation among the three marker types and their combinations, with the highest correlation (r=0.786) observed between the iPBS markers and the combined marker analysis. This suggests that iPBS markers provide complementary genetic information when used alongside other markers, supporting the notion by Doğan et al. (2014), who also reported significant correlations between RAPD and ISSR markers. The significant correlations (r>0.5) among the marker types and combined data with RAPD (0.541) and iPBS markers (0.786) are consistent with previous findings that integrating different marker systems enhances the resolution of genetic diversity assessments (Amom et al., 2020). The lowest correlation between RAPD and iPBS markers (r=0.006) suggests that these markers capture different aspects of genetic variation, similar to findings by Virk et al. (2000), who noted differences in genetic variability revealed by various marker systems. Yıldız et al. (2015)’s study on Turkish okra germplasm by iPBS retrotransposon markers reported similar significant correlations among different marker systems, supporting the value of using multiple markers for comprehensive genetic diversity studies. Ganesh Ram et al. (2008) also highlighted significant correlations between marker types, supporting the integration of multiple marker systems for accurate genetic diversity analysis.
The clustering and PCoA analyses of walnut genotypes using RAPD, ISSR, and iPBS markers, as well as their combined data, revealed consistent genetic relationships and clustering patterns. Genotypes such as 8, 26, 27, and 48 consistently clustered together across all analyses, indicating close genetic relationships. This consistency is in line with the study by Shah et al. (2019), which demonstrated similar clustering patterns using RAPD and ISSR markers. However, variations in clustering patterns depending on the marker type highlight the unique genetic insights provided by each marker system, as noted by Souframanien and Gopalakrishna (2004). The combined analysis offered a more comprehensive view of genetic relationships, integrating the strengths of each marker type and providing a balanced distribution among samples. This supports the findings by Atia et al. (2021) according to which combining multiple marker systems yields more accurate results in genetic relationship assessments.
The structural genetic analysis using combined markers demonstrated clear division into three main groups, consistent with the UPGMA analysis and PCoA results. This finding aligns with the study by Özcan et al. (2020), who reported similar clustering patterns using the UPGMA method for different walnut genotypes. The high similarity observed between certain genotypes in this study, such as between genotypes 48 and 61, suggests strong genetic relationships possibly due to gene flow, similar to the observations by Özcan et al. (2020) in their analysis of walnut genotypes. This emphasizes the importance of combined marker analysis in providing a robust understanding of genetic relationships, as different markers can target various regions of the genome, offering a comprehensive view of genetic diversity (Karp et al., 1997).
Comparative analysis with existing literature shows that our findings are consistent with previous studies on walnuts and other species, confirming the effectiveness of these markers in detecting genetic diversity. The high PIC and RP values for RAPD and ISSR markers underscore their robustness and informativeness, while the complementary insights provided by iPBS markers highlight the value of using multiple marker systems. The Mantel test results further demonstrated significant correlations among the marker types, particularly between iPBS markers and the combined marker analysis, indicating the importance of integrating different markers to enhance genetic diversity assessments. Clustering and PCoA analyses revealed consistent genetic relationships and clustering patterns, with some genotypes showing close genetic relationships across all marker systems. In conclusion, this study highlights the utility of RAPD, ISSR, and iPBS markers in assessing genetic diversity and relationships among walnut genotypes. The integration of multiple marker systems provides a comprehensive understanding of genetic variability, which is crucial for conservation and breeding programs. Future studies should continue to explore the combined use of these and other molecular markers to further elucidate the genetic structure and diversity of walnuts and other important plant species.