
Fig. 1
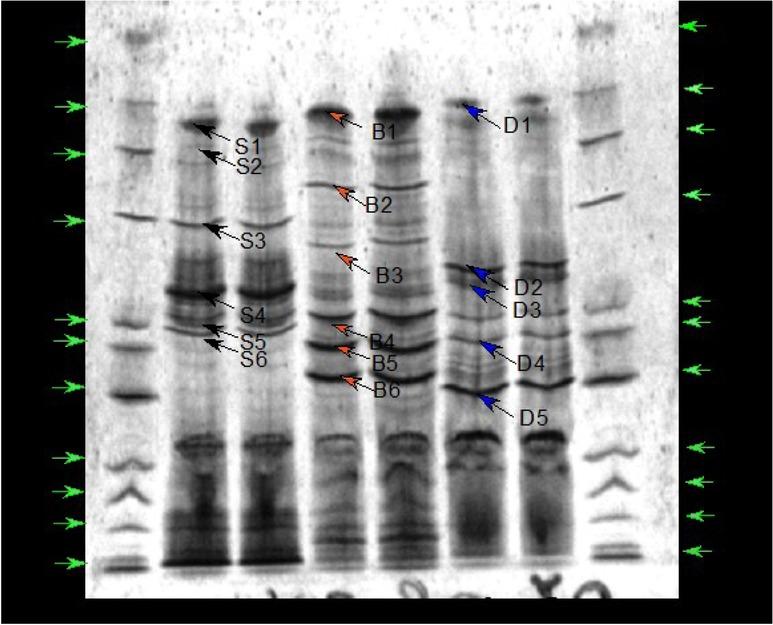
Fig. 2
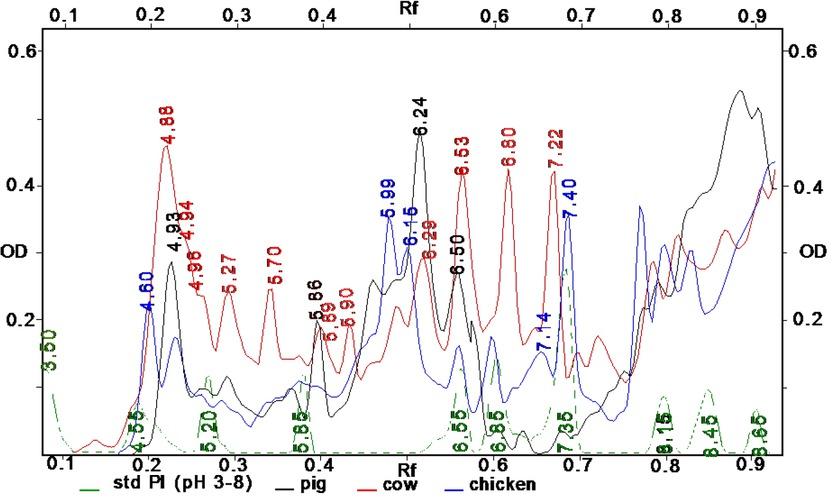
Fig. 3
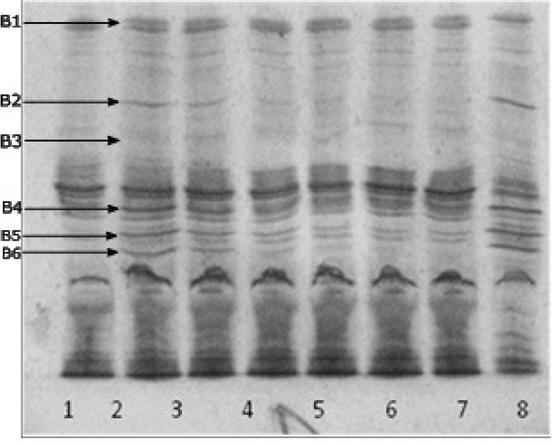
Fig. 4
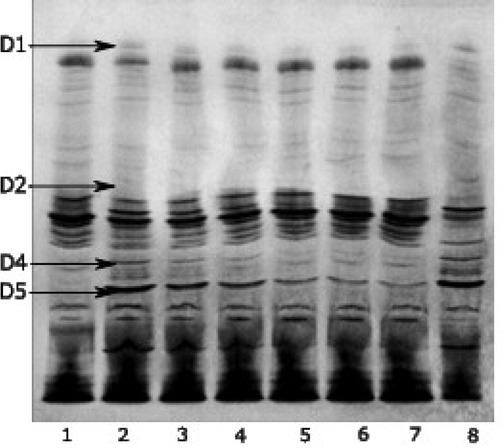
Fig. 5
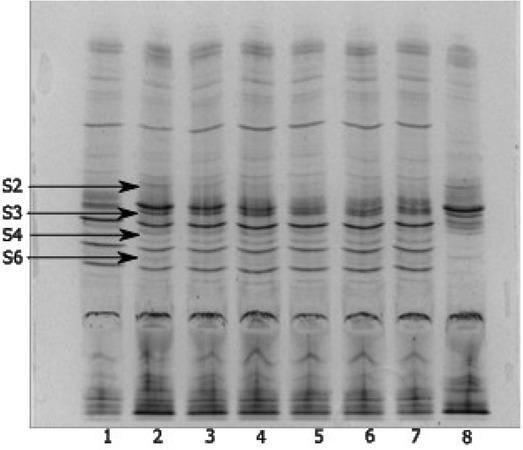
Fig. 6
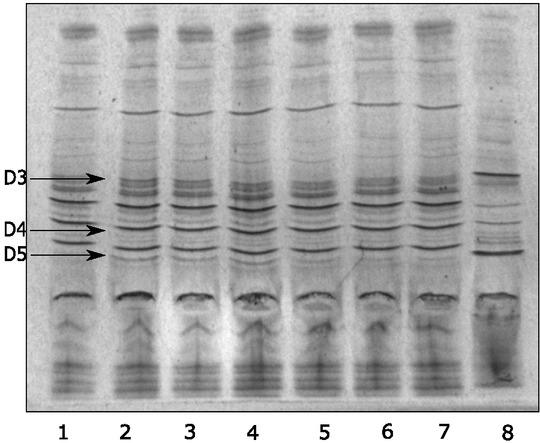
Fig. 7
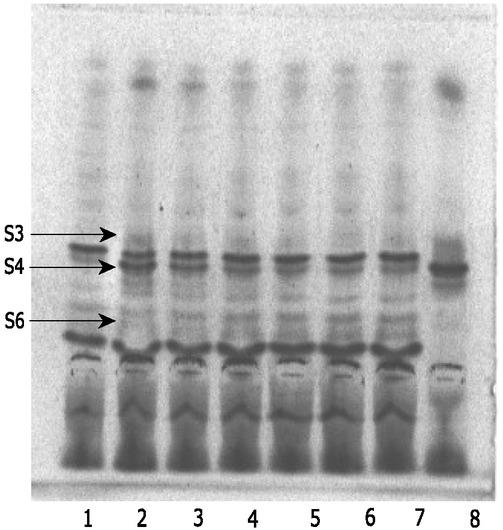
Fig. 8
Percentage of samples of pork with poultry meat admixtures (50%, 25%, 10%, 5%, 4%, 3%, 2%, 1%, 0_5%, and 0_2%) in which it was possible to observe the bands D1, D2, D4, and D5
| Poultry meat (%) | |||||||||||
|---|---|---|---|---|---|---|---|---|---|---|---|
| Band | 50 | 25 | 10 | 5 | 4 | 3 | 2 | 1 | 0.5 | 0.2 | |
| Percentage of positive findings | |||||||||||
| D1 | 100 | 100 | 100 | 100 | 0 | 0 | 0 | 0 | 0 | 0 | |
| D2 | 100 | 100 | 100 | 100 | 80 | 20 | 0 | 0 | 0 | 0 | |
| D4 | 100 | 100 | 100 | 100 | 80 | 40 | 0 | 0 | 0 | 0 | |
| D5 | 100 | 100 | 100 | 100 | 100 | 100 | 100 | 100 | 80 | 60 | |
Percentage of bovine meat with poultry meat admixtures (50%, 25%, 10%, 5%, 4%, 3%, 2%, 1%, 0_5%, and 0_2%) in which it was possible to observe the bands D3, D4, and D5
| Poultry meat (%) | ||||||||||
|---|---|---|---|---|---|---|---|---|---|---|
| Band | 50 | 25 | 10 | 5 | 4 | 3 | 2 | 1 | 0.,5 | 0.,2 |
| Percentage of positive findings | ||||||||||
| D3 | 100 | 100 | 100 | 80 | 0 | 0 | 0 | 0 | 0 | 0 |
| D4 | 100 | 100 | 100 | 60 | 0 | 0 | 0 | 0 | 0 | 0 |
| D5 | 100 | 100 | 100 | 100 | 100 | 100 | 100 | 100 | 80 | 40 |
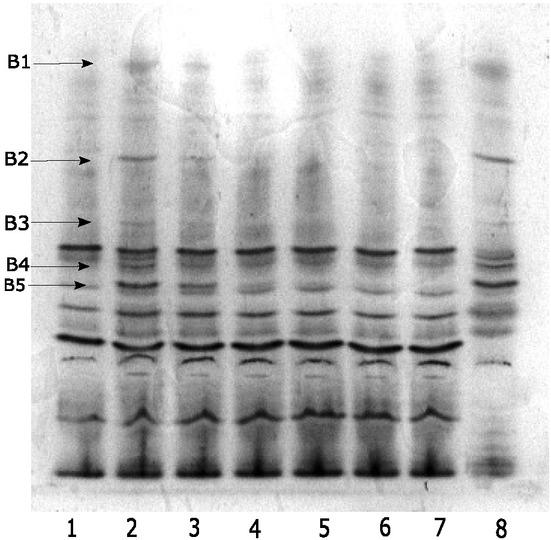
Percentage of samples of pork with beef admixtures (50%, 25%, 10%, 5%, 4%, 3%, 2%, 1%, 0_5%, and 0_2%) in which it was possible to observe bands B1, B2, B3, B4, B5, and B6
| Cattle | meat (%) | |||||||||
|---|---|---|---|---|---|---|---|---|---|---|
| Band | 50 | 25 | 10 | 5 | 4 | 3 | 2 | 1 | 0.5 | 0.2 |
| Percentage of positive findings | ||||||||||
| B1 | 100 | 100 | 100 | 100 | 100 | 100 | 20 | 0 | 0 | 0 |
| B2 | 100 | 100 | 100 | 100 | 100 | 100 | 40 | 0 | 0 | 0 |
| B3 | 100 | 100 | 100 | 100 | 100 | 100 | 40 | 0 | 0 | 0 |
| B4 | 100 | 100 | 100 | 100 | 100 | 100 | 60 | 0 | 0 | 0 |
| B5 | 100 | 100 | 100 | 100 | 100 | 100 | 80 | 20 | 0 | 0 |
| B6 | 100 | 100 | 100 | 100 | 100 | 100 | 40 | 20 | 0 | 0 |
Percentage of samples of poultry meat with pork admixtures (50%, 25%, 10%, 5%, 4%, 3%, 2%, 1%, 0_5%, and 0_2%) in which it was possible to observe the S3, S4, and S6 bands
| Pork (%) | ||||||||||
|---|---|---|---|---|---|---|---|---|---|---|
| Band | 50 | 25 | 10 | 5 | 4 | 3 | 2 | 1 | 0.5 | 0.2 |
| Percentage of positive findings | ||||||||||
| S3 | 100 | 80 | 40 | 0 | 0 | 0 | 0 | 0 | 0 | 0 |
| S4 | 100 | 100 | 100 | 100 | 100 | 100 | 60 | 60 | 0 | 0 |
| S6 | 100 | 100 | 100 | 100 | 100 | 60 | 0 | 0 | 0 | 0 |
The pI values of selected pig, bovine, and poultry muscle proteins
| Selected bands | Characteristics of the variability of pI value in the selected protein bands of pork, cattle, and poultry meat | ||||||||||||||
|---|---|---|---|---|---|---|---|---|---|---|---|---|---|---|---|
| Sample No | Mean | Minimum | Max | SD | CV% | ||||||||||
| 1 | 2 | 3 | 4 | 5 | 6 | 7 | 8 | 9 | 10 | ||||||
| pI value of selected protein band of pig muscle | |||||||||||||||
| S1 | 4.93 | 4.92 | 4.92 | 4.93 | 4.91 | 4.92 | 4.96 | 4.96 | 4.94 | 4.98 | 4.94 | 4.91 | 4.98 | 0.02 | 0.46 |
| S2 | 4.96 | 4.93 | 4.94 | 4.95 | 4.97 | 4.96 | 4.98 | 4.96 | 4.95 | 4.96 | 4.96 | 4.93 | 4.98 | 0.01 | 0.30 |
| S3 | 5.84 | 5.86 | 5.89 | 5.89 | 5.89 | 5.84 | 5.88 | 5.84 | 5.77 | 5.81 | 5.85 | 5.77 | 5.89 | 0.04 | 0.71 |
| S4 | 6.24 | 6.26 | 6.27 | 6.23 | 6.24 | 6.24 | 6.23 | 6.27 | 6.21 | 6.23 | 6.24 | 6.21 | 6.27 | 0.02 | 0.33 |
| S5 | 6.5 | 6.55 | 6.54 | 6.53 | 6.52 | 6.52 | 6.52 | 6.52 | 6.53 | 6.54 | 6.53 | 6.5 | 6.55 | 0.01 | 0.17 |
| S6 | 6.52 | 6.52 | 6.55 | 6.56 | 6.53 | 6.53 | 6.52 | 6.5 | 6.52 | 6.53 | 6.53 | 6.5 | 6.56 | 0.02 | 0.28 |
| pI value of selected protein band of cattle muscle | |||||||||||||||
| B1 | 4.86 | 4.84 | 4.82 | 4.84 | 4.84 | 4.89 | 4.8 | 4.82 | 4.82 | 4.84 | 4.84 | 4.8 | 4.89 | 0.02 | 0.52 |
| B2 | 5.27 | 5.21 | 5.19 | 5.28 | 5.23 | 5.26 | 5.23 | 5.24 | 5.29 | 5.21 | 5.24 | 5.19 | 5.29 | 0.03 | 0.63 |
| B3 | 5.9 | 5.89 | 5.92 | 5.92 | 5.9 | 5.88 | 5.91 | 5.9 | 5.91 | 5.95 | 5.91 | 5.88 | 5.95 | 0.02 | 0.33 |
| B4 | 6.53 | 6.52 | 6.52 | 6.51 | 6.54 | 6.53 | 6.55 | 6.54 | 6.55 | 6.54 | 6.53 | 6.51 | 6.55 | 0.01 | 0.20 |
| B5 | 6.8 | 6.84 | 6.82 | 6.82 | 6.81 | 6.76 | 6.8 | 6.82 | 6.81 | 6.82 | 6.81 | 6.76 | 6.84 | 0.02 | 0.31 |
| B6 | 7.22 | 7.2 | 7.22 | 7.19 | 7.2 | 7.17 | 7.17 | 7.17 | 7.2 | 7.22 | 7.2 | 7.17 | 7.22 | 0.02 | 0.29 |
| pI value of selected protein band of poultry muscle | |||||||||||||||
| D1 | 4.59 | 4.59 | 4.62 | 4.61 | 4.58 | 4.58 | 4.61 | 4.62 | 4.61 | 4.62 | 4.6 | 4.58 | 4.62 | 0.02 | 0.36 |
| D2 | 6.15 | 6.14 | 6.12 | 6.12 | 6.12 | 6.15 | 6.16 | 6.16 | 6.18 | 6.21 | 6.15 | 6.12 | 6.21 | 0.03 | 0.47 |
| D3 | 6.2 | 6.22 | 6.24 | 6.23 | 6.22 | 6.22 | 6.22 | 6.19 | 6.24 | 6.23 | 6.22 | 6.19 | 6.24 | 0.02 | 0.26 |
| D4 | 6.53 | 6.51 | 6.52 | 6.53 | 6.53 | 6.5 | 6.54 | 6.53 | 6.56 | 6.53 | 6.53 | 6.5 | 6.56 | 0.02 | 0.25 |
| D5 | 7.4 | 7.42 | 7.41 | 7.39 | 7.41 | 7.37 | 7.38 | 7.39 | 7.42 | 7.41 | 7.4 | 7.37 | 7.42 | 0.02 | 0.23 |
Percentage of cattle meat with porcine meat admixtures (50%, 25%, 10%, 5%, 4%, 3%, 2%, 1%, 0_5%, and 0_2%) in which it was possible to observe the bands S2, S3, S4, and S6
| Porcine meat (%) | ||||||||||
|---|---|---|---|---|---|---|---|---|---|---|
| Band | 50 | 25 | 10 | 5 | 4 | 3 | 2 | 1 | 0.,5 | 0.,2 |
| Percentage of positive findings | ||||||||||
| S2 | 100 | 100 | 60 | 0 | 0 | 0 | 0 | 0 | 0 | 0 |
| S3 | 100 | 100 | 100 | 100 | 80 | 40 | 0 | 0 | 0 | 0 |
| S4 | 100 | 100 | 100 | 80 | 100 | 40 | 0 | 0 | 0 | 0 |
| S6 | 100 | 100 | 100 | 80 | 100 | 40 | 0 | 0 | 0 | 0 |
The percentage of samples of poultry meat with bovine meat admixtures (50%, 25%, 10%, 5%, 4%, 3%, 2%, 1%, 0_5%, and 0_2%) in which it was possible to observe B1, B2, B3, B4, and B5 bands
| Cattle meat (%) | ||||||||||
|---|---|---|---|---|---|---|---|---|---|---|
| Band | 50 | 25 | 10 | 5 | 4 | 3 | 2 | 1 | 0.,5 | 0.,2 |
| Percentage of positive findings | ||||||||||
| B1 | 100 | 100 | 100 | 100 | 80 | 60 | 0 | 0 | 0 | 0 |
| B2 | 100 | 100 | 100 | 100 | 80 | 60 | 60 | 0 | 0 | 0 |
| B3 | 100 | 100 | 100 | 100 | 80 | 60 | 0 | 0 | 0 | 0 |
| B4 | 100 | 100 | 100 | 100 | 80 | 60 | 0 | 0 | 0 | 0 |
| B5 | 100 | 100 | 100 | 100 | 100 | 80 | 20 | 0 | 0 | 0 |