
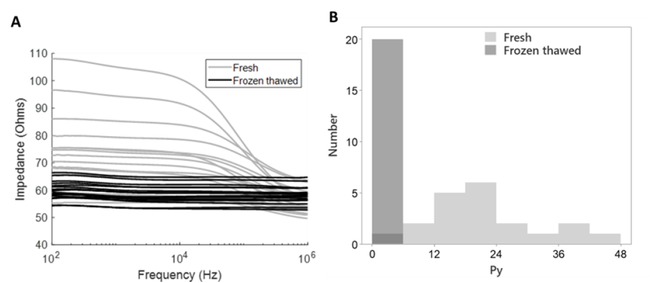
Figure 2
Individual impedance response spectra and Py values indicate almost complete separation of refrigerated and subsequently frozen-thawed pork samples (N=20 for each test group and one specific electrode position). A. Impedance spectra before freezing (refrigerated) and after thawing (frozen-thawed). B. Histogram plot of Py values for all pork sirloin samples, as extracted from one specific position measurement.
Table 1
Summary of the analyzed full factorial design (ANOVA) with Py as response and a two-level factor encoding for potentially confounding effects (R/FT = refrigerated/frozen-thawed; On/Al = electrode position ‘on-top’ into back muscle/see Fig. 1C, D versus ‘along’, through back muscle/see Fig. 1A, B; Pos = Position of electrode, left and right side of the sample; * = p > 0.2).
| Py | Variables | Explained variance (adj.) (%) | p-value |
|---|---|---|---|
| Main factors | R/FT | 12.8 | <0.001 |
| On/Al | - | * | |
| Interaction | F/FT. On/Al | - | * |
| F/FT. Pos | 1.4 | 0.106 | |
| Covariates | Driploss (22.5 ± 1.2g) | - | ** |
| Weight (335.4 ±7.4g) | 3.7 | 0.009 | |
| Error | 79.5 | - |
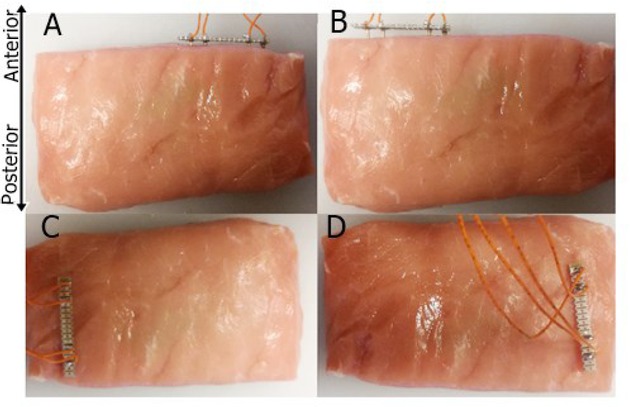
Figure 1
Measuring the bioimpedance of sirloin cuts. Four different positions were chosen for the electrode, two with the electrode inserted perpendicular to the anterior-posterior axis of the LTL (A, B; approximately also perpendicular to the main muscle fiber direction) and two positions along the anterior-posterior axis (C, D; approximately in line with the main muscle fiber direction C, D). The side facing the camera is the dorsal side of the LTL muscle (depicted axes: anterior/posterior & left/right).
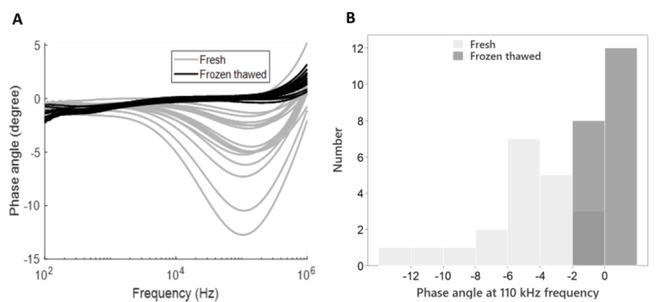
Figure 3
Individual impedance phase angle responses in pork before and after freezing-thawing (N=20 per treatment group). A. The phase angle of refrigerated and frozen-thawed meat measured in one specific position. B. The distribution of phase angle values at 110 kHz reveals apparent differences between refrigerated and frozen-thawed samples.