

Table 1:
Phases of thematic analysis.
| Phase | Title of Phase | Content of Phase |
|---|---|---|
| 1 | Familiarization with data | Transcribe and thoroughly review all interviews, identifying the initial key topics that emerge. |
| 2 | Generating codes | Systematically code documents, assigning primary codes and subcodes where necessary. Create code segments encompassing all potential themes. |
| 3 | Searching themes | Organize codes into broader themes, considering relationships between themes, codes, and different levels of thematic hierarchy. |
| 4 | Reviewing themes | Examine the functionality of themes in relation to codes and the entire dataset. Review and refine the analysis, recoding any missed data within themes. Develop a thematic map |
| 5 | Defining and naming themes | Conduct a detailed analysis of each theme, establishing coherent definitions and names for each. Explore how each theme contributes to the overall narrative. |
| 6 | Producing report | Select statements from themes that capture their essence. Relate themes to the research question and existing literature, producing report for dissemination. |
[i] Note. According to Braun and Clarke (2020) philosophically and procedurally. This plurality in TA is often not recognised by editors, reviewers or authors, who promote ‘coding reliability measures’ as universal requirements of quality TA. Focusing particularly on our reflexive TA approach, we discuss quality in TA with reference to ten common problems we have identified in published TA research that cites or claims to follow our guidance. Many of the common problems are underpinned by an assumption of homogeneity in TA. We end by outlining guidelines for reviewers and editors – in the form of twenty critical questions – to support them in promoting high(er, own design
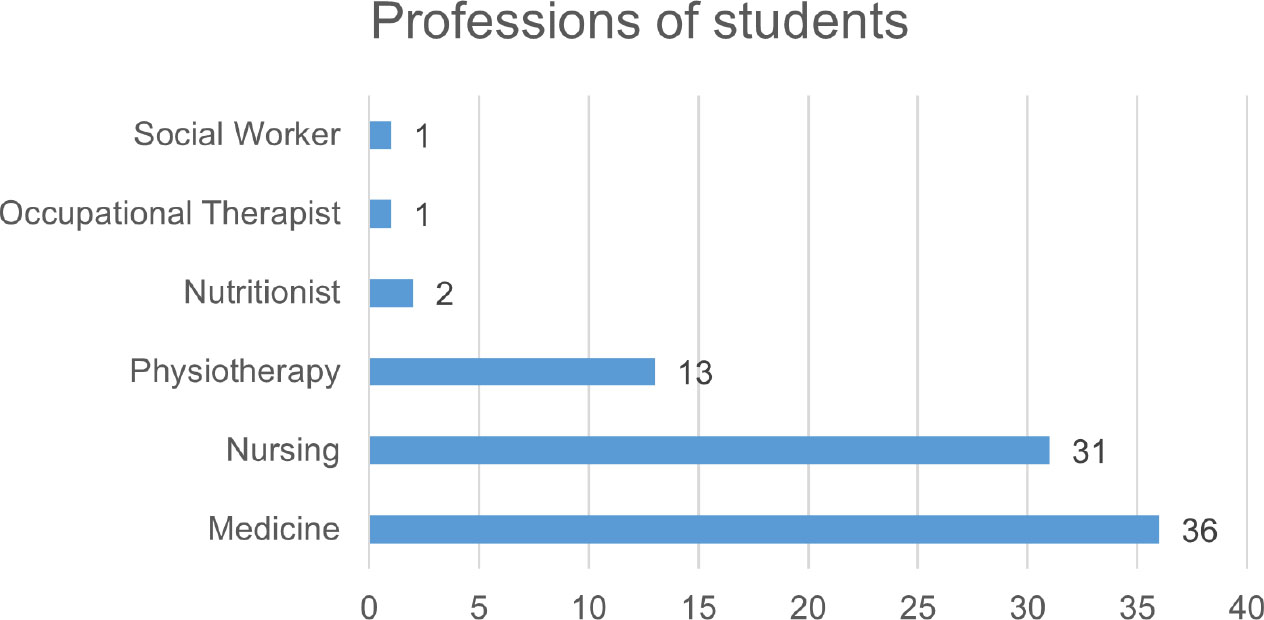
Figure 1:
Professions in ZIPAS®-project, own design.
Table 2:
Categories with subcodes, own design.
| Categories | |
|---|---|
| Successful IPC | Lack of IP interaction |
| Successful IPE | Hindering factors |
Benefits
| Enabling factors |
| Quality of care | Profession-specific delimination |
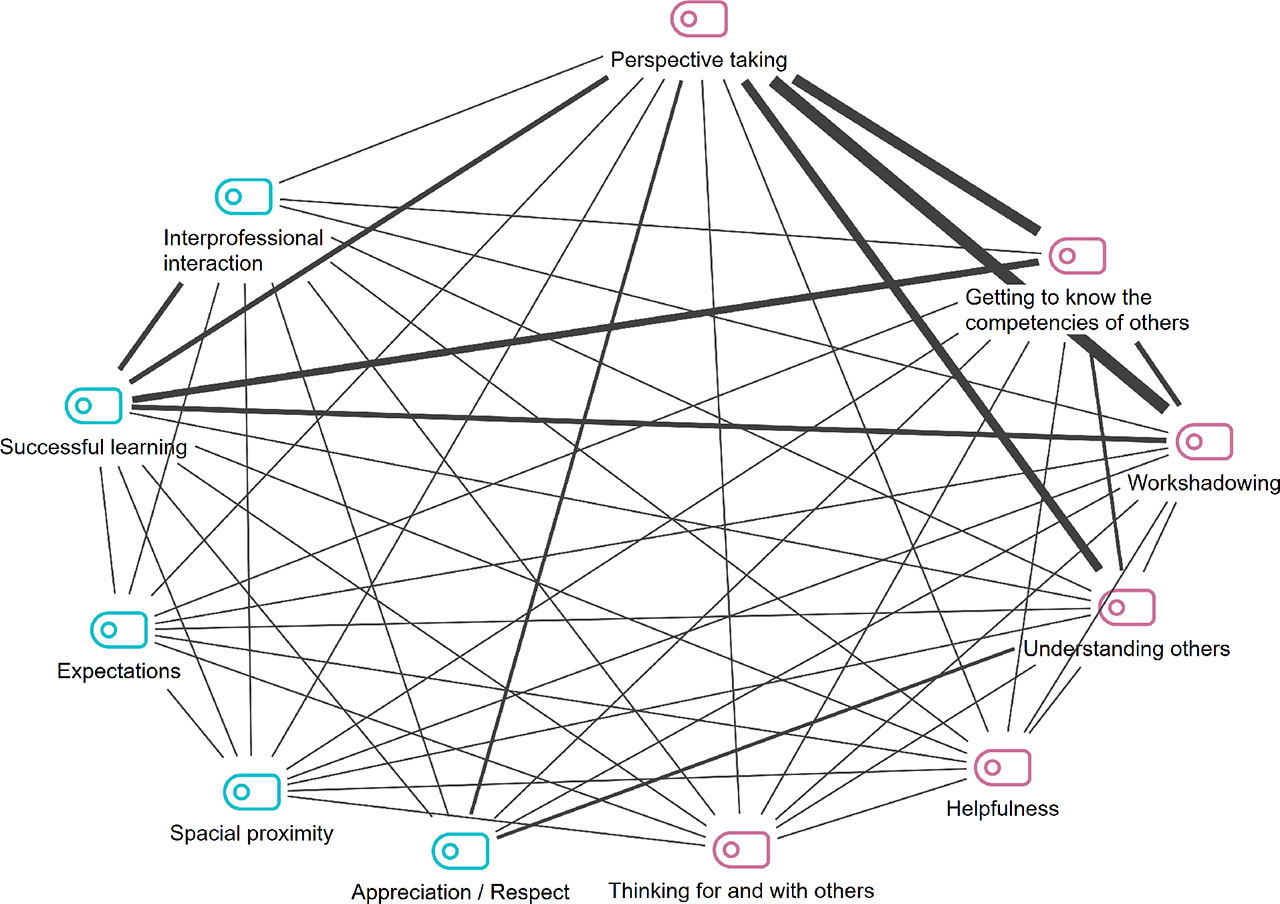
Figure 2:
Code-relations model, Visual Tools MAXQDA, 2024.
Note. The strength of the line is in relation to the frequency of the relationships.
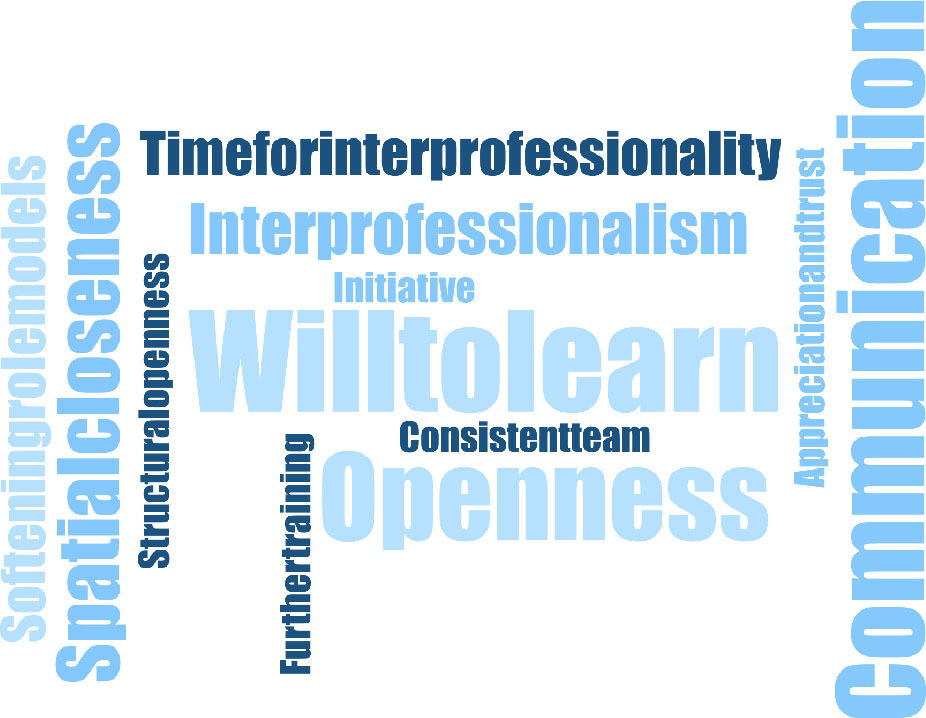
Figure 3:
Word-cloud Fostering factors, own design.
Note. The font size represents the relative frequency of mentions of a term, colors are irrelevant.
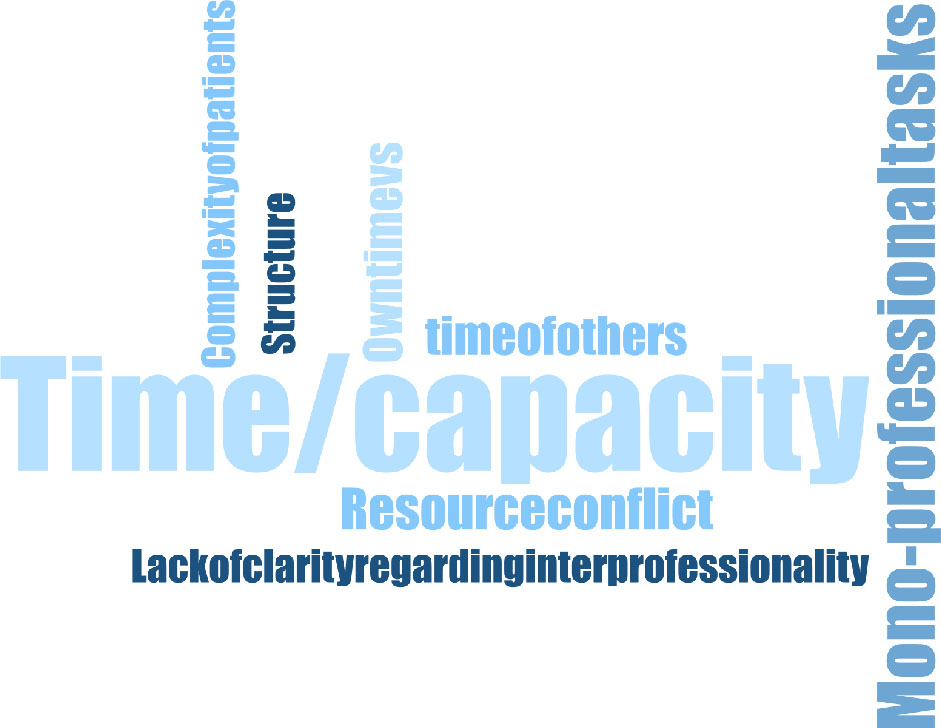
Figure 4:
Word-cloud Hindering factors, own design.
Note. The font size represents the relative frequency of mentions of a term, colors are irrelevant.