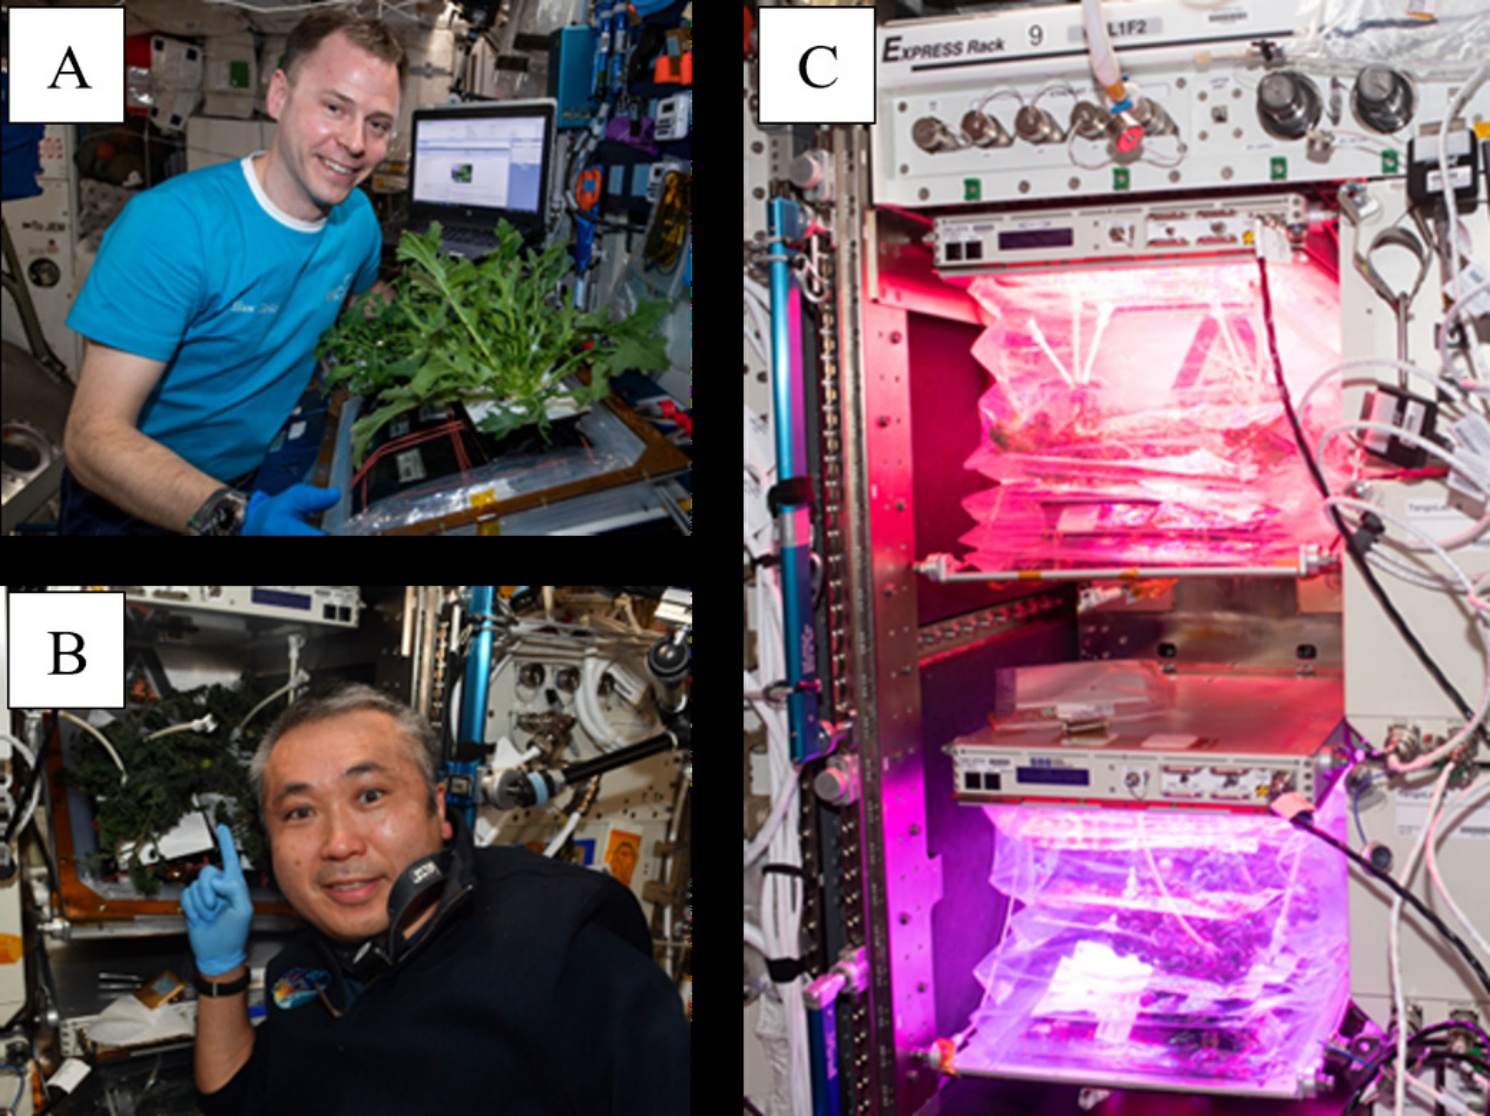
Figure 1.
A) Mizuna grown during the VEG-04A experiment. B) JAXA Astronaut Koichi Wakata pointing to the VEG-05 tomato experiment. C) VEG-05 experiment in an express rack with red-rich lighting on top and blue-rich lighting below (Credit: NASA).
Table 1.
Pre-flight process CCP to eliminate or reduce microbiological hazards.
| Pre-flight: Process Step/Control Point | Microbiological Hazard | Critical control measures | Control limit (Critical control limits. *) | Monitoring procedure | Verification |
|---|---|---|---|---|---|
| Ground processing-pillows, wicks, substrate | Introduction of microbes via handling and materials. | Sterilize components by autoclave or ethylene oxide sterilization. Aseptic technique used while assembling. Includes engineering controls such as use of laminar flow for assembly and use of PPE. | Sterilization conditions achieved.* | Biological indicators in each cycle for verification of sterilization processes. | Biological indicators are negative for growth. Laminar flow bench certification. Verification and record of assembly SOP. |
| Disinfectant wipe preparation | Introduction of microbes via handling and materials. | Autoclave materials. Aseptic technique used while assembling. Includes engineering controls such as use of laminar flow for assembly and use of PPE. | 1% ProSan disinfectant pH<3.0* | Biological indicators in each cycle for verification of sterilization processes. Check pH of ProSan solution after autoclaving using pH probe or pH paper. | Biological indicators are negative for growth. pH<3.0 after testing |
| Ground Processing-Seed | Introduction of microbes via handling and indigenous microbes present on seeds | Disinfection (Chlorine gas disinfection) (Massa et al, 2017). Use of sanitary handling practices. *Certification of pathogen-free seed. | Exposure time to chlorine gas. The time can vary depending on the type of seed but is pre-determined.* | Timer set- start and end time recorded. Seeds tested for microbial growth and germination post-disinfection with chlorine gas. | 90 % of seeds free of bacterial and fungal growth while maintaining 90% germination. Results verified and recorded per SOP. Certification paperwork from seed supplier verified pathogen-free. |
| Packing | no | - | - | ||
| Transport | no | - | - |
Table 2.
In-flight GAPs and control processes to eliminate or reduce microbiological hazards.
| In-flight: Process: Control Point | Microbiological Hazard | GAPs | Control processes | Monitoring procedure | Verification |
|---|---|---|---|---|---|
| Initiation of Veggie hardware for crop growth | Introduction of microbes via handling. | Use of sanitary handling-gloves. | Verification of installation procedures. | Photographs-depends on crew procedure requirements. | |
| Watering | Introduction of microbes via water supply or unsanitary handling. | Water is potable quality and treated with biocide. | ISS-acceptable biocide | In-flight and ground-based microbial and biocide monitoring. | NASA standards. Total bacteria: <50 CFU/mL Coliforms: undetectable |
| Crop growth | Potential contamination from air and human presence. Increase in indigenous flora due to availability of nutrients and water on surfaces. Microbial growth due to accumulation of dead plant material/debris. | Use of sanitary handling. Minimize handling of plants before harvest. Control humidity and water accumulation. Removal of visible microbial growth and debris. * | Plant health. No microbial growth visible on plants and associated surfaces. | Photographs taken by the crew. | Ground scientists confirming plant health status and any visual evidence of microbial growth. |
| Harvest | Introduction of microbes due to harvest procedures and human handling. | Sanitized instruments should be used, and gloves worn. Limited repeated cut harvests due to increased microbial growth. | 30 s contact to ProSan wipe. | Ground scientists view harvest videos for support and verification of crew procedures. | NASA standards for non-thermostabilized food. ** |
| Post-harvest produce sanitizing | Microbial presence established during plant growth and introduction via handling. | Sanitize produce before consumption. | 30 S contact to ProSan wipe. | Ground EVT and post-flight microbiological analysis of return samples. | NASA standards for non-thermostabilized food. ** |
| Post-harvest facility cleaning | Microbial presence established during plant growth and introduction via handling. Dead plant debris and inedible biomass. | Remove and discard used plant pillows and any debris. Wipe Veggie facility surfaces using disinfectant wipes (Currently 1% ProSan-see Table 1). | 100% removal of debris and residual plant matter. | Visual inspection by the crew. | Visual verification by the crew. |
Table 3.
Mean bacterial (APC) and fungal counts on mizuna leaves (CFU/g) from the VEG-04A experiments, including the EVT, Ground control, and Flight.
| Mizuna VEG-04A-Red-rich | Mizuna VEG-04A-Blue-rich | |||||||||
|---|---|---|---|---|---|---|---|---|---|---|
| EVT | Ground Control | Flight | EVT | Ground Control | Flight | |||||
| BS | AS | BS | AS | BS | BS | AS | BS | AS | BS | |
| APC | 1.2×10⁶ (1/5) | 61 | 184 | 311 | 1.7×10⁶ (5/5) | 1,100 | 95 | 1,300 | 295 | 5.2×10⁴ (2/3) |
| Fungi | 268 | 61 | 124 | 74 | 3.4×10⁴ | 106 | 95 | 555 | 94 | 3.9×10³ |
| Pathogen screening | NEG | NEG | NEG | NEG | NEG | NEG | NEG | NEG | NEG | NEG |
[i] BS=before sanitizing; AS = after sanitizing. EVT (n=6 per light treatment). Ground control (n=6 per light treatment) and Flight samples (n=5 in red-rich and n=3 in the blue-rich treatment) as described in Buncheck et al, 2024. The number of plants of total evaluated, in which counts exceed the NASA thermostabilized standard for APC, is shown in parentheses. <DL=below detection limit. Pathogen screening included Salmonella spp, Staphylococcus aureus, coliforms, and E. coli.
Table 4.
Mean bacteria (APC) and fungal counts on mizuna leaves (CFU/g) from the VEG-04B EVT (n=6 per light treatment).
| EVT Mizuna VEG-04B-Red-rich | EVT Mizuna VEG-04B-Blue-rich | |||||
|---|---|---|---|---|---|---|
| Harvest 1 | Harvest 2 | Harvest 3 | Harvest 1 | Harvest 2 | Harvest 3 | |
| APC BS | 2.1×10⁶ (4/6) | 8.2 × 10³ | 3.1 × 10⁴ (2/5) | 8.2 × 10⁵ (2/5) | 3.3 × 10⁵ (4/5) | 6.7 × 10⁶ (5/5) |
| APC AS | 1.6 × 10³ | 347 | 6.4 × 10³ | 3.1 × 10³ | 4.1 × 10³ | 2.8 × 10³ |
| Fungi BS | 1.2 × 10³ | 400 | 9.2 × 10³ | 260 | 31 | 2.2 × 10⁵ |
| Fungi AS | 22 | 2.1 × 10³ | 899 | <DL | 573 | 498 |
| Pathogen screening | NEG | NEG | NEG | NEG | NEG | NEG |
[i] BS=before sanitizing, AS=After sanitizing. Ground control (n=6 per light treatment) and flight samples (n=6 until harvest 1, then n=5 in red-rich and n=3 in the blue rich treatment) as described in Bunchek et al, 2024. Number of plants of total evaluated in which counts exceed NASA thermostabilized standard for APC are shown in parenthesis. <DL=below detection limit. Pathogen screening included Salmonella spp, Staphylococcus aureus, coliforms, and E. coli.
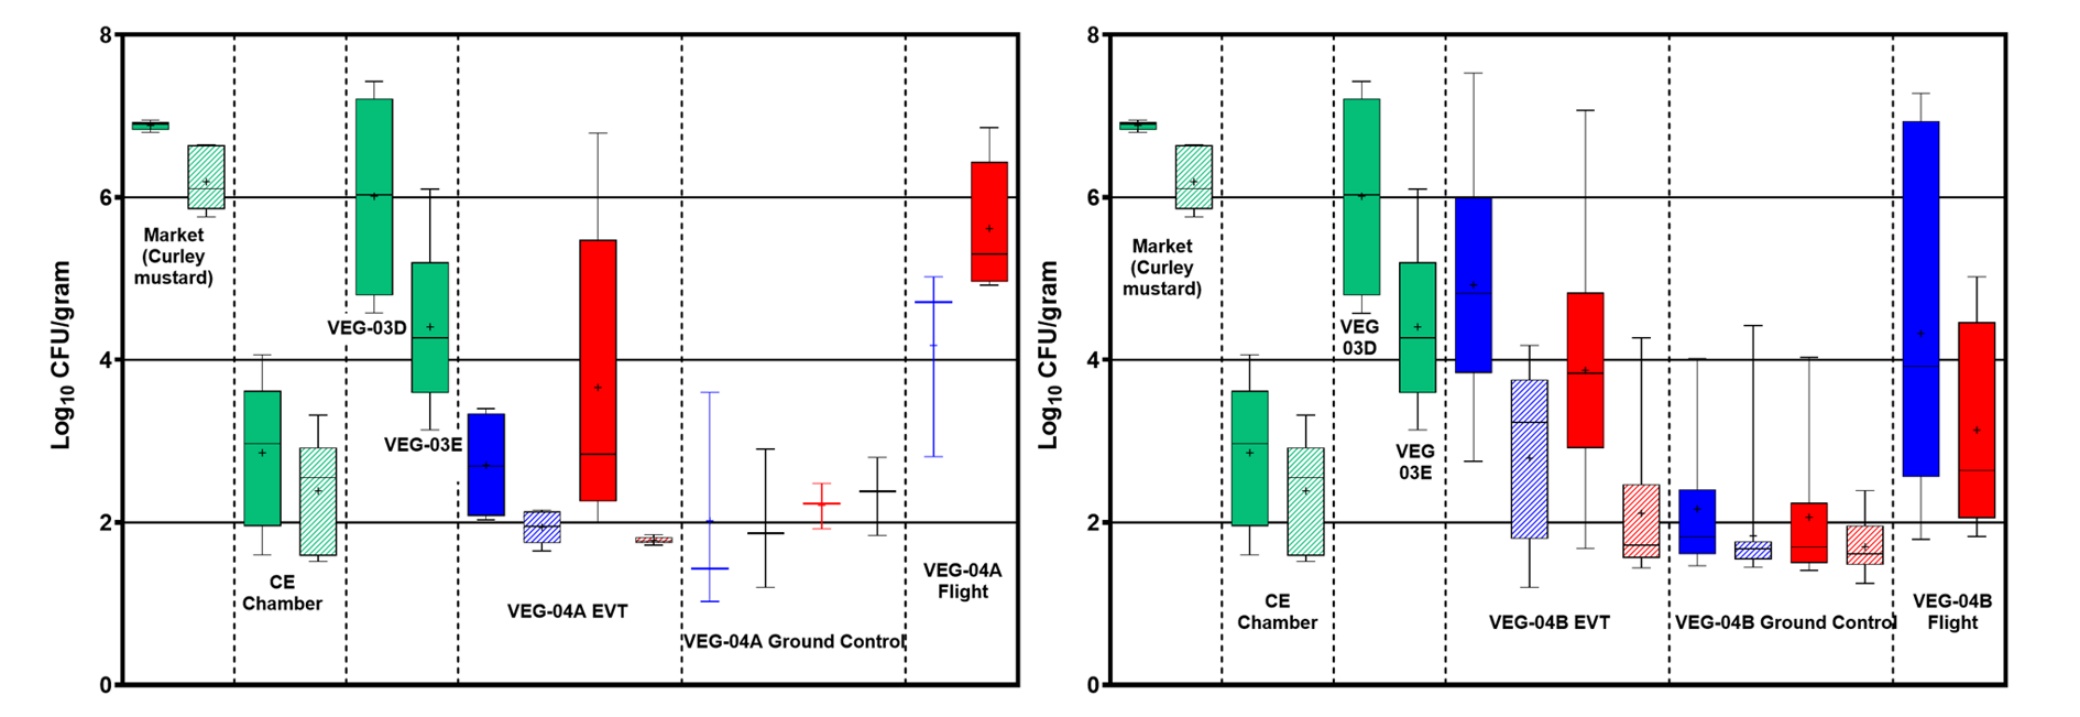
Figure 2.
Box-and-whisker plots of VEG-04A (left) and VEG-04B (right) mizuna APC (Log10 CFU/g) compared to a similar mustard variety from the market, mizuna grown in CE chambers at KSC, and VEG-03D and VEG-03E ISS tech demos. Whiskers are min and max values; the median is indicated by the line across each box, and + indicates the mean. Solid boxes were non-sanitized leaves; patterned boxes were sanitized with ProSan® wipes. Red or blue indicate light-rich treatments in the VEG-04 experiments. Data from VEG-04A and 04B were adapted from Bunchek et al, 2024. Data from VEG-03D and VEG-03E were adapted from Hummerick et al, 2021.
Table 5.
Mean bacteria (APC) and fungal counts (CFU/g) on tomatoes per gram from the VEG-05 EVT (n=6 per light treatment).
| EVT Tomato VEG-05-Red-rich | EVT Tomato VEG-05-Blue-rich | |||||
|---|---|---|---|---|---|---|
| Harvest 1 | Harvest 2 | Harvest 3 | Harvest 1 | Harvest 2 | Harvest 3 | |
| APC | 54 | 504 | 21 | 1000 | 74,300 (2/6) | 70 |
| Fungi | <DL | <DL | <DL | <DL | <DL | <DL |
| Pathogen screening | NEG | NEG | NEG | NEG | NEG | NEG |
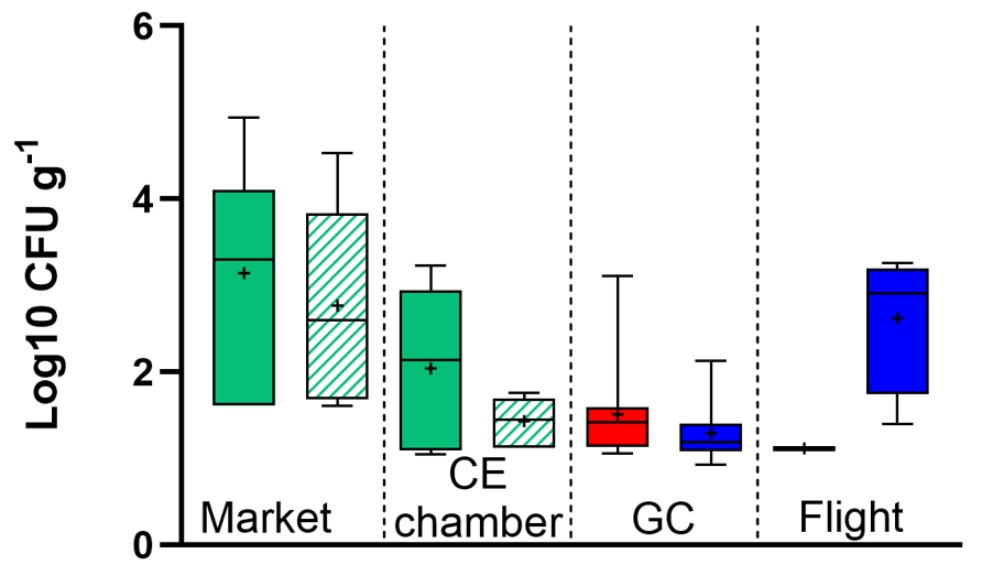
Figure 3.
Box-and-whisker plots of VEG-05 tomato APC (Log10 CFU/g) compared to market tomatoes and those grown in CE chambers at KSC. Whiskers are the minimum and maximum values; the median is indicated by the line across each box, and + indicates the mean. Solid boxes were non-sanitized fruit; patterned boxes were sanitized with ProSan® wipes. Red or blue indicate light-rich treatments in the VEG-05 experiments. Data from Veg-05A were adapted from Spern et al, 2026.