
Figure 1:
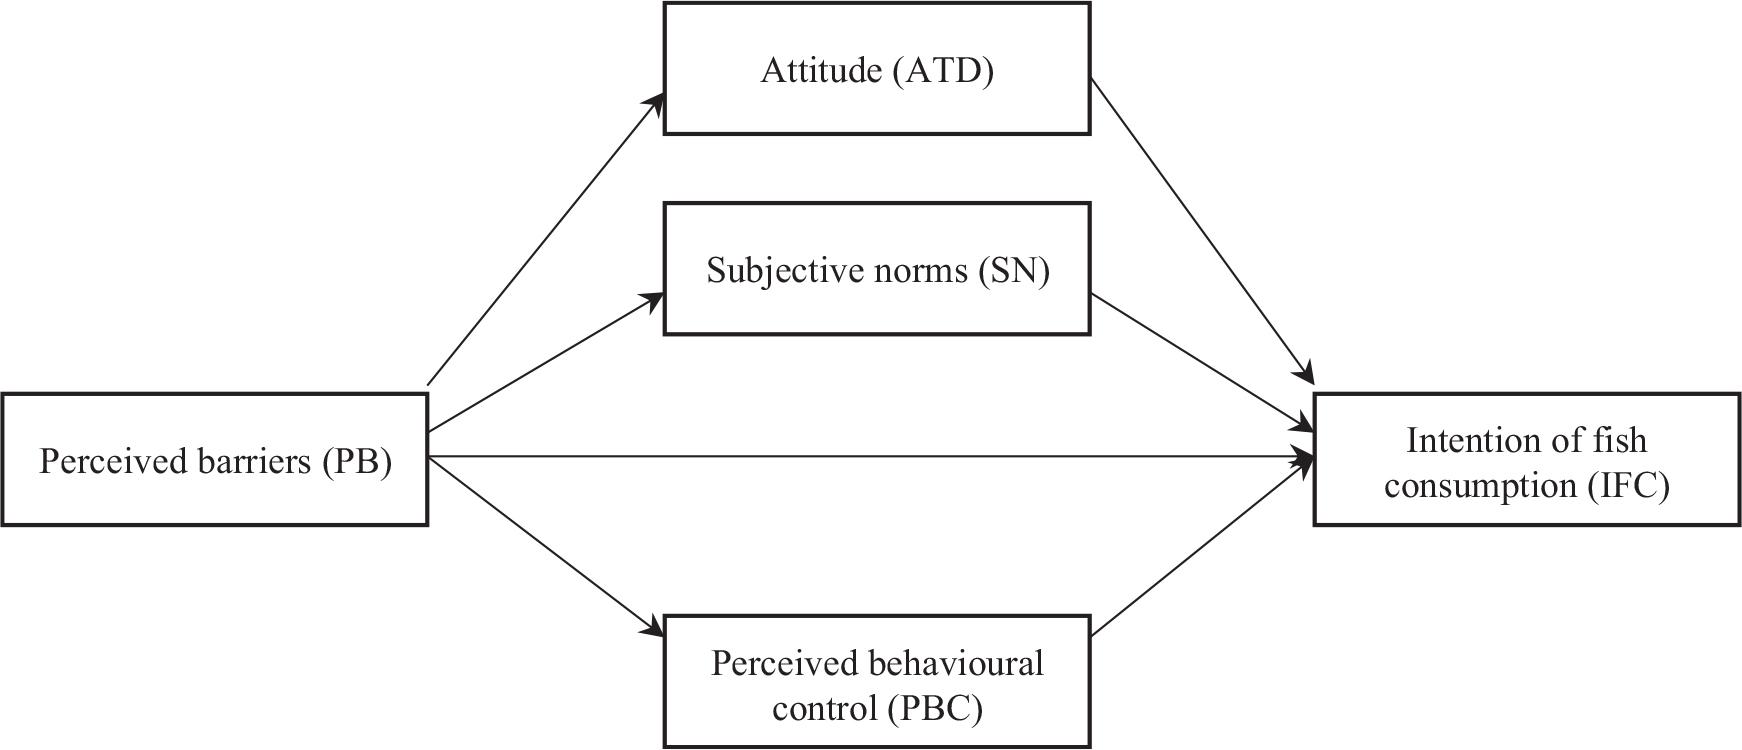
Figure 2:
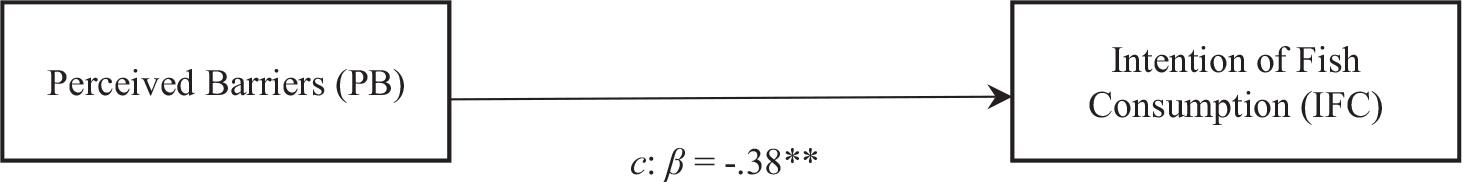
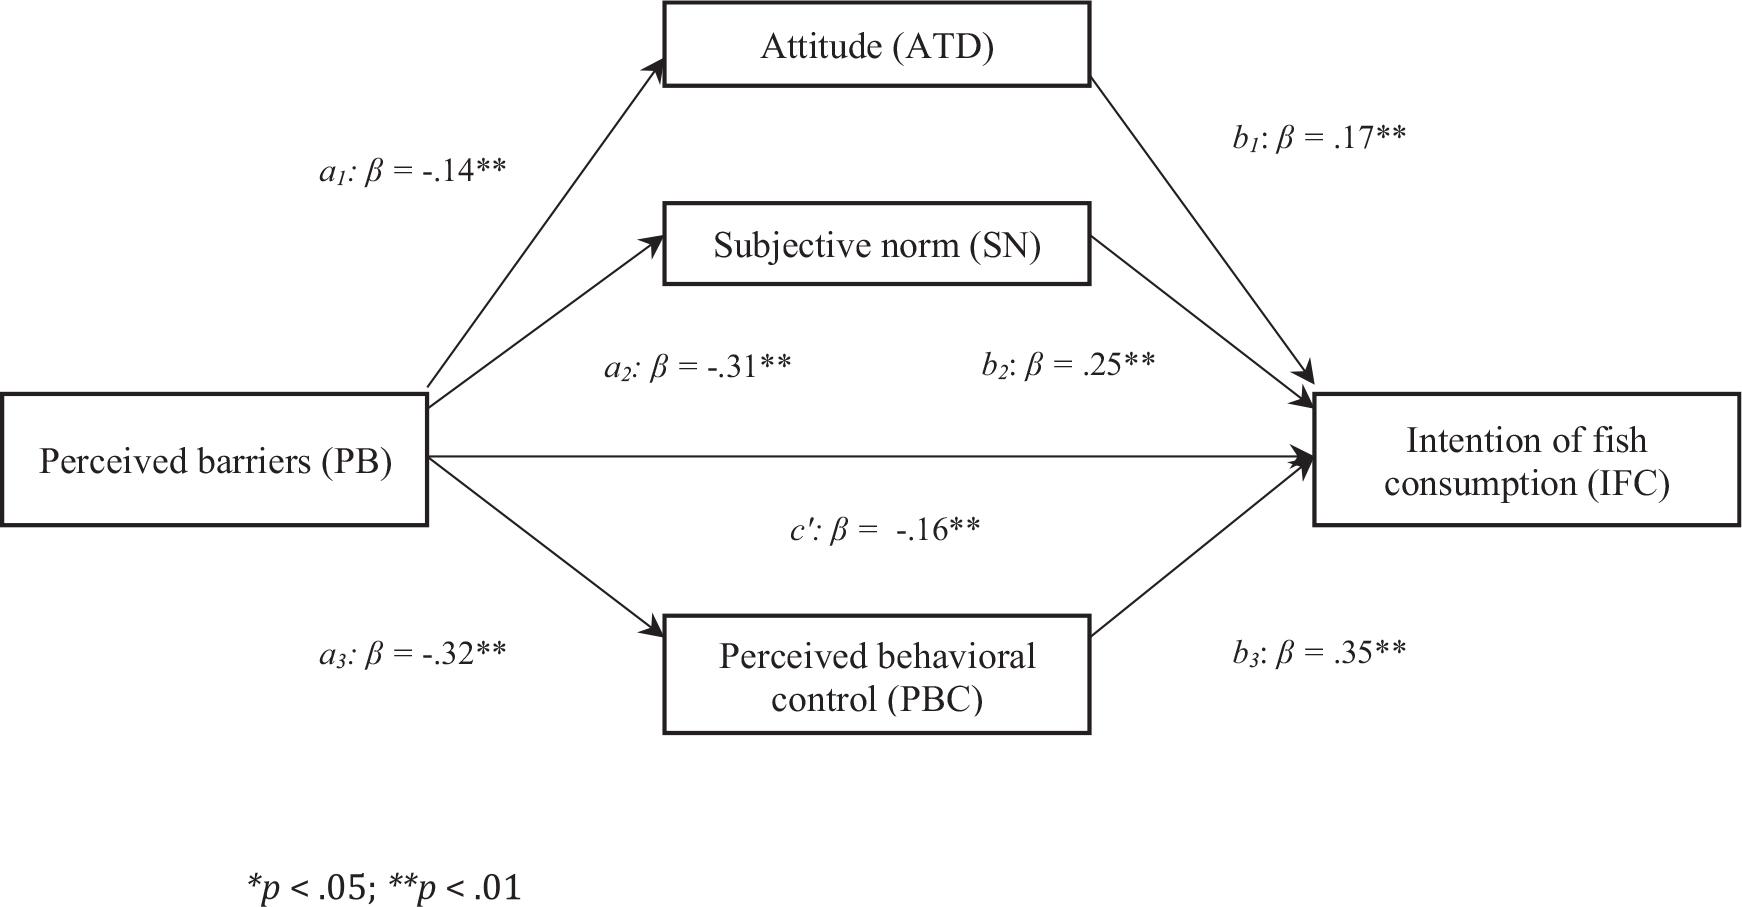
Figure 3:
EFA for Perceived Barriers (PB)_
| Items | Extraction | Factor Loading | Item-total correlations | Total Variance |
|---|---|---|---|---|
| PB1 | 0.566 | 0.752 | 0.673 | 59.631 |
| PB2 | 0.623 | 0.791 | 0.720 | |
| PB3 | 0.521 | 0.722 | 0.639 | |
| PB4 | 0.610 | 0.782 | 0.703 | |
| PB5 | 0.560 | 0.748 | 0.661 | |
| PB6 | 0.709 | 0.842 | 0.775 | |
| PB7 | 0.660 | 0.813 | 0.738 | |
| PB8 | 0.518 | 0.720 | 0.628 |
Regression coefficients and summary information for the model with mediating variables
| Antecedent | Consequent | |||||||||||||||
|---|---|---|---|---|---|---|---|---|---|---|---|---|---|---|---|---|
| M1 (ATD) | M2 (SN) | M3 (PBC) | Y (IFC) | |||||||||||||
| β | SE | p | β | SE | p | β | SE | p | β | SE | P | |||||
| X (PB) | a1 | -.14 | .03 | < .01 | a2 | -.31 | .05 | < .01 | a3 | -.32 | .04 | < .01 | c’ | -.16 | .05 | < .01 |
| M1 (ATD) | b1 | .17 | .07 | < .01 | ||||||||||||
| M2 (SN) | b2 | .25 | .05 | < .01 | ||||||||||||
| M3 (PBC) | b3 | .35 | .05 | < .01 | ||||||||||||
| Constant | iM1 | 4.63 | .07 | < .01 | iM2 | 4.56 | .12 | < .01 | iM3 | 3.86 | .11 | < .01 | iy | .58 | .24 | < .01 |
| R2 | .04 | .09 | .10 | .33 | ||||||||||||
| F (df) | 22.51*** (1;482) | 46.29*** (1;482) | 52.52*** (1;482) | 58.09*** (4;479) | ||||||||||||
| Indirect effect | K2 = -.18 β= -.22 SE= .04 95% CI [-.29, -.15] | |||||||||||||||
Correlation coefficients between variables
| Bivariate correlation | Descriptive statistics | ||||||||
|---|---|---|---|---|---|---|---|---|---|
| 1 | 2 | 3 | 4 | 5 | N | M | SD | ||
| 1 | Perceived barriers | - | 529 | 2.58 | .86 | ||||
| 2 | Attitude | -.21** | - | 529 | 4.3 | .57 | |||
| 3 | Subjective norms | -.29** | .23** | - | 529 | 3.79 | .94 | ||
| 4 | Perceived behavioural control | -.31** | .22** | .53** | - | 529 | 3.09 | .89 | |
| 5 | Intention of fish consumption | -.32** | .25** | .56** | .49** | - | 529 | 2.96 | 1.01 |