
Tabelle 1
Anteile an ausgewählten Fettsäuregruppen (GC-Analytik bzw. MIR-Schnellanalytik) in der Milch (ausgewählter Praxisbetriebsdatensatz)
Table 1. Proportions of important groups of fatty acids (GC-analysis or MIR-analysis) in the milk (selected farms dataset)
| Fettsäuren1 | Wirtschaftsweise (W) | Saison (S) | Saison × Wirtschaftsweise (S × W)2 | se | P-Werte | |||||||
|---|---|---|---|---|---|---|---|---|---|---|---|---|
| bio | kon | So | Wi | So bio | So kon | Wi bio | Wi kon | W | S | S × W | ||
| GC-Analytik | ||||||||||||
| SFA, g/100 g FA | 70,4 | 72,5 | 70,0 | 72,9 | 67,9b | 72,1a | 73,0a | 72,9a | 1,08 | 0,108 | < 0,001 | < 0,001 |
| MUFA, g/100 g FA | 25,4 | 23,9 | 26,0 | 23,2 | 27,8a | 24,2ab | 23,0b | 23,5b | 1,02 | 0,233 | < 0,001 | 0,001 |
| PUFA, g/100 g FA | 4,16 | 3,58 | 3,98 | 3,76 | 4,33a | 3,63bc | 4,00ab | 3,53c | 0,28 | 0,003 | 0,088 | 0,364 |
| UFA, g/100 g FA | 29,6 | 27,4 | 30,0 | 27,0 | 32,1a | 27,9b | 27,0b | 27,0b | 1,13 | 0,092 | < 0,001 | 0,001 |
| CLA, g/100 g FA | 1,11 | 0,75 | 1,07 | 0,79 | 1,33a | 0,82b | 0,90b | 0,69b | 0,12 | 0,010 | < 0,001 | 0,014 |
| iso FA, g/100 g FA | 1,89 | 1,85 | 1,86 | 1,87 | 1,91 | 1,81 | 1,86 | 1,88 | 0,11 | 0,701 | 0,886 | 0,241 |
| ω-3-FA, g/100 g FA | 1,12 | 0,81 | 0,91 | 1,03 | 1,05ab | 0,76b | 1,19a | 0,86ab | 0,17 | 0,043 | 0,143 | 0,754 |
| ω-6-FA, g/100 g FA | 1,93 | 2,01 | 2,00 | 1,94 | 1,95 | 2,05 | 1,91 | 1,98 | 0,11 | 0,538 | 0,239 | 0,772 |
| ω-6/ω-3-Verhältnis | 1,75 | 2,70 | 2,36 | 2,10 | 1,87 | 2,85 | 1,64 | 2,56 | 0,40 | 0,071 | 0,150 | 0,851 |
| MIR-Schellanalytik | ||||||||||||
| SFA, g/100 g FA | 67,0 | 69,5 | 66,8 | 69,7 | 64,9b | 68,7a | 69,2a | 70,3a | 1,33 | 0,068 | < 0,001 | 0,029 |
| MUFA, g/100 g FA | 26,9 | 25,3 | 27,2 | 25,0 | 28,8a | 25,6b | 25,0b | 25,0b | 1,00 | 0,075 | < 0,001 | 0,003 |
| PUFA, g/100 g FA | 3,09 | 2,80 | 3,18 | 2,71 | 3,40a | 2,96b | 2,78b | 2,64b | 0,29 | 0,001 | 0,002 | 0,245 |
| UFA, g/100 g FA | 33,0 | 30,5 | 33,2 | 30,3 | 35,1b | 31,3a | 30,8a | 29,7a | 1,33 | 0,068 | < 0,001 | 0,029 |
Tabelle 2
Beziehungen zwischen den Ergebnissen der GC- und MIR-Analytik für die Fettsäuregruppen SFA, MUFA, PUFA und UFA
Table 2. Relationship between results from GC- and MIR-analyses for the fatty acid groups SFA, MUFA, PUFA und UFA
| arithm. Mittel1,2 | Standardabw.1,2 | lineares Regressionsmodell1,2 | P-Wert | r | Standardfehler Schätzung1 | Mittlerer Absolutfehler1 | |||
|---|---|---|---|---|---|---|---|---|---|
| GC | MIR | GC | MIR | ||||||
| SFA2 | 72,0 | 68,8 | 2,42 | 2,49 | SFA-GC = 8,50 + 0,9229 × SFA – MIR | < 0,001 | 0,95 | 0,78 | 0,66 |
| MUFA2 | 24,2 | 25,7 | 2,32 | 1,83 | MUFA-GC = −6,85 +1,2050 × MUFA – MIR | < 0,001 | 0,95 | 0,76 | 0,65 |
| PUFA2 | 3,83 | 2,87 | 0,396 | 0,350 | PUFA-GC = 2,00 + 0,6391 × PUFA – MIR | 0,004 | 0,57 | 0,34 | 0,27 |
| UFA2 | 28,0 | 31,2 | 2,43 | 2,49 | UFA-GC = −0,81 + 0,9220 × UFA – MIR | < 0,001 | 0,95 | 0,82 | 0,71 |
2 SFA bzw. SFA-GC oder SFA-MIR = gesättigte Fettsäuren, ermittelt mit GC- oder MIR-Analytik; MUFA bzw. MUFA-GC oder MUFA-MIR = einfach ungesättigte Fettsäuren, ermittelt mit GC- oder MIR-Analytik; PUFA bzw. PUFA-GC oder PUFA-MIR = mehrfach ungesättigte Fettsäuren, ermittelt mit GC- oder MIR-Analytik; UFA bzw. UFA-GC oder UFA-MIR = ungesättigte Fettsäuren, ermittelt mit GC- oder MIR-Analytik
Tabelle 3
Bland-Altman-Analyse zu den Ergebnissen der GC- und MIR-Analytik für die Fettsäuregruppen SFA, MUFA, PUFA und UFA
Table 3. Bland-Altman analysis of the results from GC- and MIR-analysis for the fatty acid groups SFA, MUFA, PUFA and UFA

Abbildung 1
Gegenüberstellung der Ergebnisse aus GC- bzw. MIR-Analytik für die Fettsäuregruppen UFA, MUFA, PUFA und SFA (in g/100 g FA; ●…konventionell Winterfütterung, ○…bio Winterfütterung, ▪…konventionell Sommerfütterung, □…bio Sommerfütterung)
Figure 1. Comparison of results from GC- and MIR-analysis for the fatty acid groups UFA, MUFA, PUFA and SFA (in g/100 g FA; ●...conventional winter feeding, ○...organic winter feeding, ▪...conventional summer feeding, □...organic summer feeding)
Tabelle 4
Milchinhaltsstoffe und Fettsäurekonzentration, gemessen mit der MIR-Analyse für die biologisch bzw. konventionell wirtschaftenden Lieferbetriebe bei Sommer bzw. Winterfütterung
Table 4. Milk constituents and fatty acid concentrations measured with MIR analysis for the organic or conventional farmers in a summer- or winter-feeding period
| Wirtschaftsweise (W) | Saison (S) | Saison × Wirtschaftsweise (S × W) | se | P-Werte | ||||||||
|---|---|---|---|---|---|---|---|---|---|---|---|---|
| bio | kon | So | Wi | So bio | So kon | Wi bio | Wi kon | W | S | S × W | ||
| Fett, % | 4,18 | 4,35 | 4,13 | 4,40 | 4,05d | 4,20c | 4,31b | 4,50a | 0,23 | < 0,001 | < 0,001 | 0,118 |
| Eiweiß, % | 3,31 | 3,47 | 3,33 | 3,45 | 3,27d | 3,40b | 3,35c | 3,54a | 0,15 | < 0,001 | < 0,001 | < 0,001 |
| Laktose, % | 4,84 | 4,86 | 4,87 | 4,83 | 4,86b | 4,88a | 4,83c | 4,84c | 0,06 | 0,004 | < 0,001 | 0,053 |
| Harnstoff, mg/100 ml | 22 | 24 | 24 | 22 | 23b | 26a | 22c | 23b | 5,41 | < 0,001 | < 0,001 | 0,282 |
| SFA, g/100 g FA | 66,1 | 67,8 | 65,3 | 68,6 | 64,2d | 66,3c | 68,0b | 69,2a | 2,39 | < 0,001 | < 0,001 | 0,002 |
| MUFA, g/100 g FA | 26,7 | 25,8 | 27,6 | 24,9 | 28,2a | 27,0b | 25,2c | 24,6d | 1,82 | < 0,001 | < 0,001 | 0,008 |
| PUFA, g/100 g FA | 3,4 | 3,2 | 3,4 | 3,2 | 3,5a | 3,2c | 3,3b | 3,2d | 0,30 | < 0,001 | < 0,001 | 0,021 |
| UFA, g/100 g FA | 33,9 | 32,2 | 34,7 | 31,4 | 35,8a | 33,7b | 32,0c | 30,8d | 2,39 | < 0,001 | < 0,001 | 0,002 |
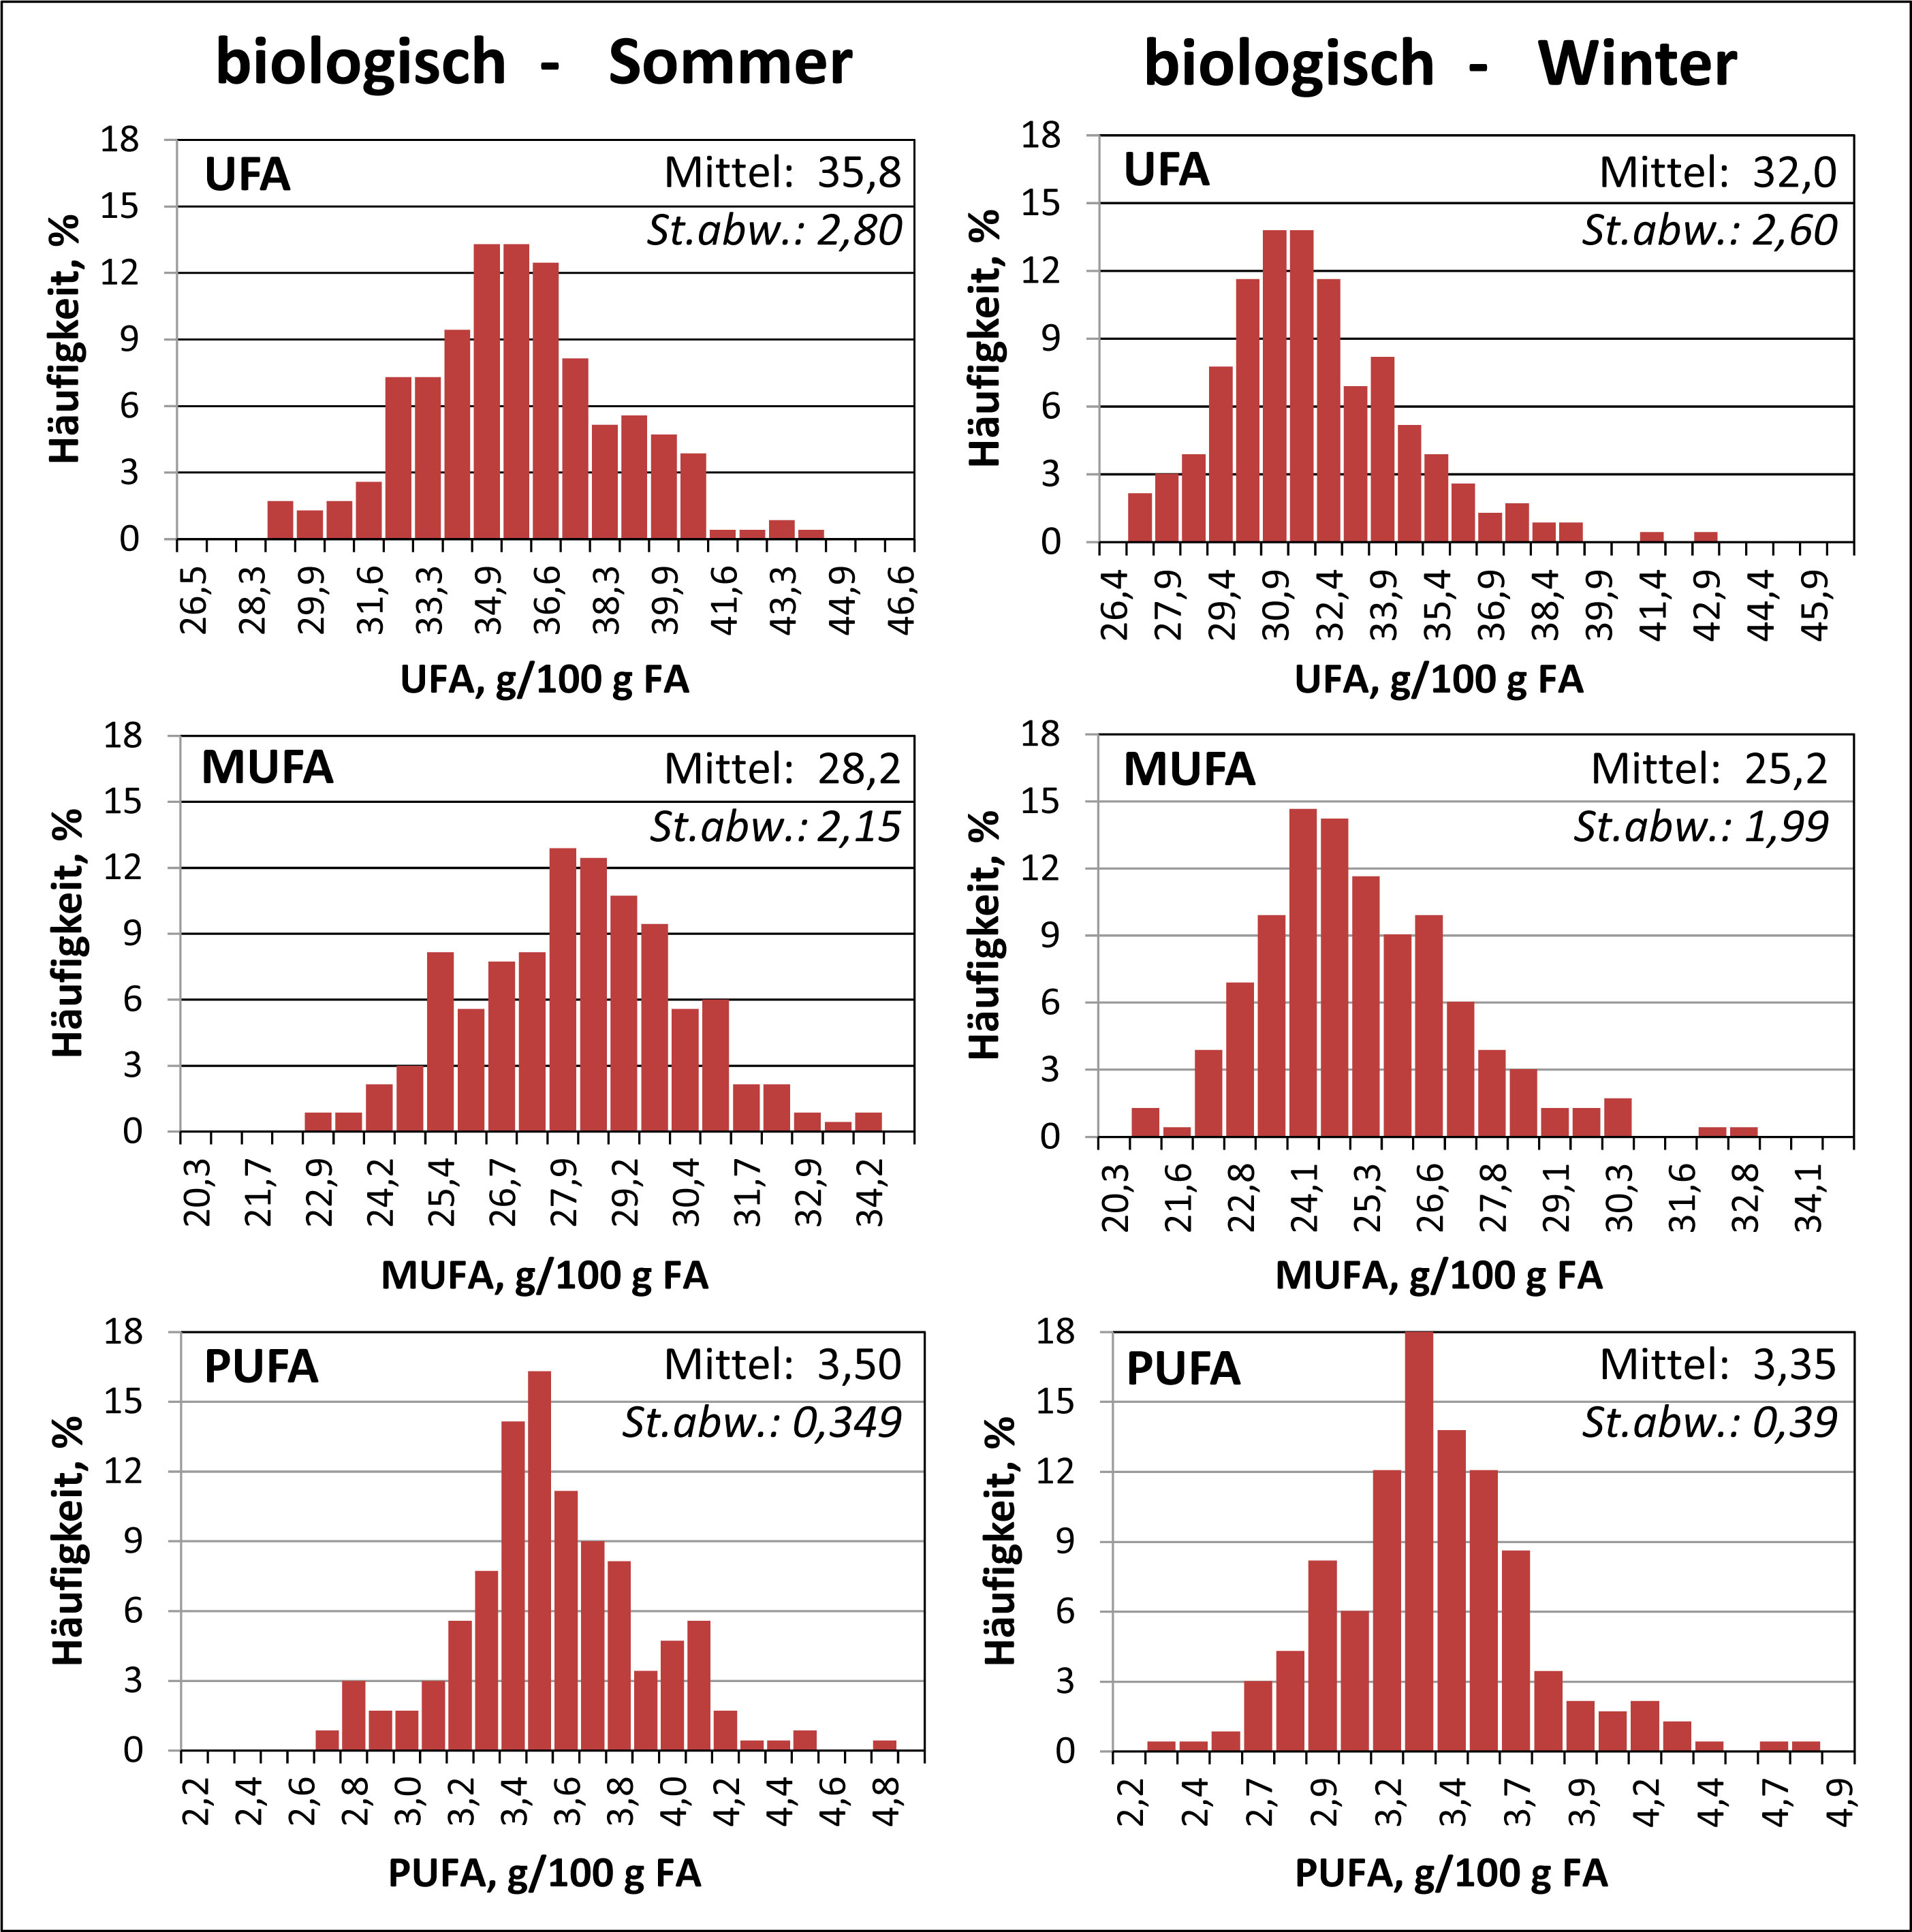
Abbildung 2
Häufigkeitsverteilung der Fettsäurekonzentrationen für UFA, MUFA und PUFA der Milch der biologisch wirtschaftenden Betriebe in der Sommer- (links) und Winterfütterungssituation (rechts) aus der MIR-Analytik
Figure 2. Frequency distribution of fatty acid concentrations for UFA, MUFA and PUFA in the milk of the organic farms in a summer (left) or winter feeding period (right) from MIR-analysis