
Table 1.
Growth performance and feed efficiency of rainbow trout fed the control diet or diets supplemented with 107 (Y7) and 108 (Y8) cfu/g yeast. Data are mean ± SD of three replicates
| Initial weight (g) | Final weight (g) | SGR (%/d) | WG (%) | FCR | |
|---|---|---|---|---|---|
| Control | 10.1±0.06 | 19.9±0.40 | 2.24±0.05 | 96.0±2.98 | 1.02±0.03 |
| Y7 | 10.1±0.15 | 19.8±0.59 | 2.25±0.06 | 96.3±3.54 | 1.01±0.04 |
| Y8 | 10.0±0.15 | 19.5±0.21 | 2.22±0.08 | 94.7±4.80 | 1.03±0.05 |
| P-value | 0.966 | 0.641 | 0.863 | 0.866 | 0.855 |
| F-value | 0.467 | 0.479 | 0.151 | 0.148 | 0.161 |
Table 2.
Blood leukocytes of rainbow trout fed the control diet or diets supplemented with 107 (Y7) and 108 (Y8) cfu/g yeast. Data are mean ± SD of three replicates
| WBC (1000 cell/µL) | Lymphocyte (%) | Neutrophil (%) | Monocyte (%) | |
|---|---|---|---|---|
| Control | 18.0±7.94 | 90.7±0.58 | 7.33±0.88 | 2.00±1.00 |
| Y7 | 21.7±7.51 | 90.3±3.79 | 7.67±2.52 | 2.33±1.53 |
| Y8 | 19.3±4.93 | 89.7±2.08 | 8.00±1.00 | 2.33±1.53 |
| P-value | 0.812 | 0.887 | 0.903 | 0.943 |
| F-value | 0.216 | 0.123 | 0.103 | 0.059 |
Table 3.
Intestinal total bacteria, LAB and Vibrio sp. counts of rainbow trout fed the control diet or diets supplemented with 107 (Y7) and 108 (Y8) cfu/g yeast. Data are mean ± SD of three replicates
| Total viable cell (logcfu/g ww) | LAB (logcfu/g ww) | Vibrio sp. (logcfu/g ww) | |
|---|---|---|---|
| Control | 7.03±0.31 b | 2.84±0.10 a | 2.73±0.21 c |
| Y7 | 6.07±0.31 a | 3.33±0.27 b | 2.07±0.15 b |
| Y8 | 6.60±0.26 ab | 3.43±0.26 b | 0.80±0.13 a |
| P-value | 0.019 | 0.038 | <0.001 |
| F-value | 8.16 | 5.95 | 106 |
| Cohen’s d | Control vs. Y7 = 3.14 | Control vs. Y7 = 2.65 | Control vs. Y7 = 3.71 |
| Control vs. Y8 = 3.22 | Control vs. Y8 = 11.6 | ||
| Y7 vs. Y8 = 9.01 |
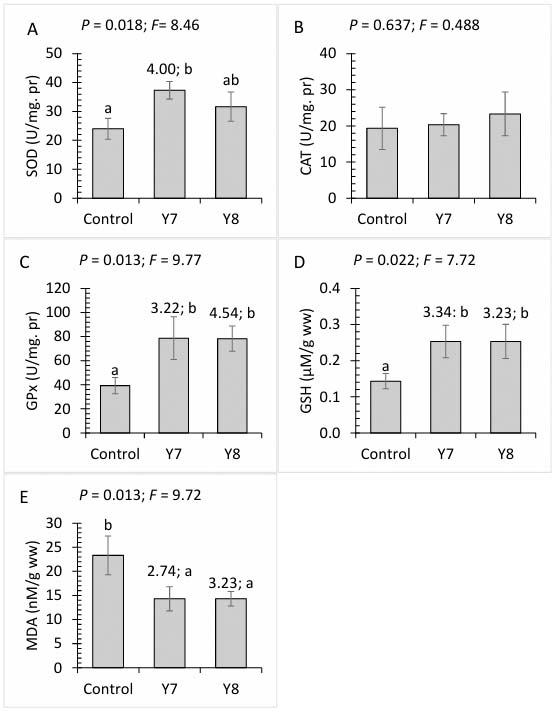
Figure 1.
Hepatic superoxide dismutase (A), catalase (B), glutathione peroxidase (C), reduced glutathione (D) and malondialdehyde (E) of rainbow trout fed the control diet or diets supplemented with 107 (Y7) and 108 (Y8) cfu/g yeast. Data are mean ± SD of three replicates. Different letters above the bars show significant differences among the treatments (Duncan). Values above the bars show effect size (Cohen’s d) of the treatment compared to control
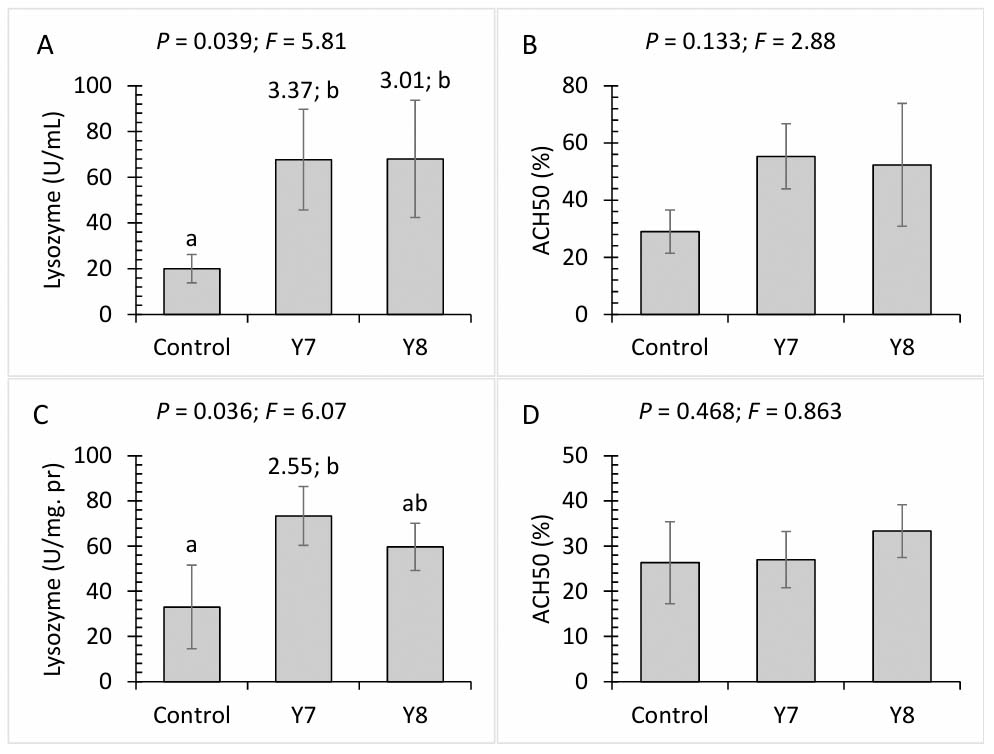
Figure 2.
Lysozyme and ACH50 activities in plasma (A and B) and skin mucus (C and D) of rainbow trout fed the control diet or diets supplemented with 107 (Y7) and 108 (Y8) cfu/g yeast. Data are mean ± SD of three replicates. Different letters above the bars show significant differences among the treatments (Duncan). Values above the bars show effect size (Cohen’s d) of the treatment compared to control
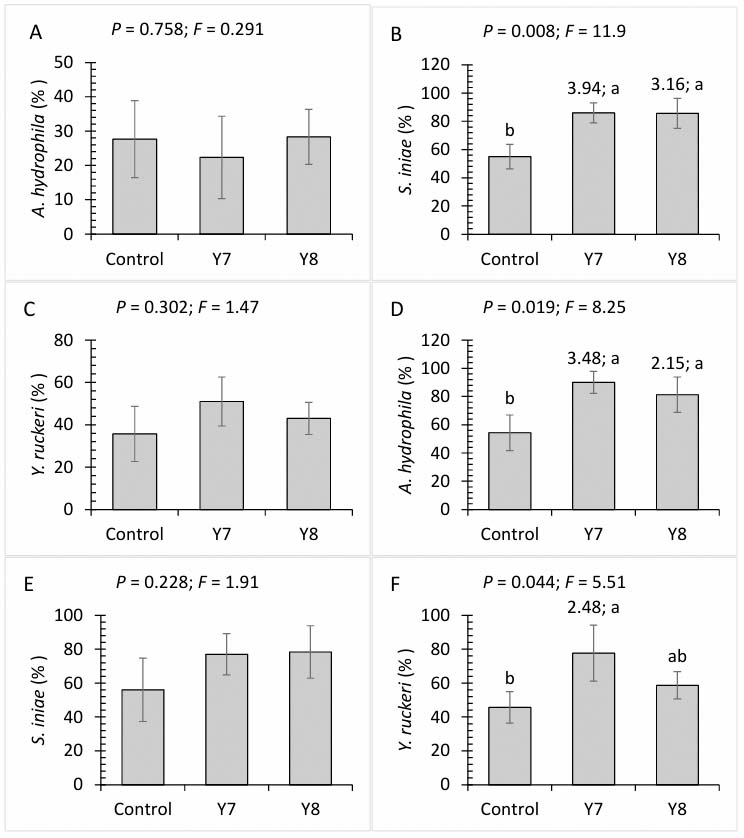
Figure 3.
Bactericidal activities in plasma (A-C) and skin mucus (C-F) of rainbow trout fed the control diet or diets supplemented with 107 (Y7) and 108 (Y8) cfu/g yeast. Data are mean ± SD of three replicates. Different letters above the bars show significant differences among the treatments (Duncan). Values above the bars show effect size (Cohen’s d) of the treatment compared to control
Table 4.
Biochemical responses of rainbow trout fed the control diet or diets supplemented with 107 (Y7) and 108 (Y8) cfu/g yeast and exposed to 24-h crowding stress. Data are mean ± SD of three replicates
| Cortisol (ng/mL) | Glucose (mg/dL) | ALT (U/mg pr) | AST (U/mg pr) | ||
|---|---|---|---|---|---|
| Before stress | Control | 32.0±7.94 a | 44.0±7.55 a | 14.7±2.52 a | 29.3±5.68 a |
| Y7 | 30.3±8.08 a | 44.7±4.93 a | 15.3±3.21 ab | 29.0±6.56 a | |
| Y8 | 33.0±7.21 a | 43.7±4.61 a | 15.0±2.65 ab | 26.7±4.51 a | |
| After stress | Control | 165±11.5 c | 141±25.4 c | 43.0±7.54 c | 77.7±13.0 c |
| Y7 | 104±13.5 b | 97.0±5.20 b | 21.0±4.36 ab | 54.3±6.51 b | |
| Y8 | 99.7±10.5 b | 98.0±11.5 b | 23.0±3.00 b | 55.3±6.51 b | |
| P-value | Yeast | <0.001 | 0.014 | 0.002 | 0.0.25 |
| stress | <0.001 | <0.001 | <0.001 | <0.001 | |
| Interaction | <0.001 | 0.013 | 0.001 | 0.047 | |
| F-value | Yeast | 20.0 | 6.29 | 11.7 | 5.09 |
| stress | 369 | 137 | 48.7 | 89.8 | |
| interaction | 19.7 | 6.40 | 12.9 | 3.98 | |
| Cohen’s d | |||||
| Control before–after | 4.70 | 5.90 | 5.63 | 5.17 | |
| Y7 before–Y7 after | 5.08 | 10.3 | - | 3.88 | |
| Y8 before–Y8 after | 6.10 | 6.72 | - | 5.20 | |
| Control after–Y7 after | 4.88 | 2.90 | 3.69 | 2.39 | |
| Control after–Y8 after | 5.90 | 2.45 | 3.79 | 2.29 | |