
Table 1
Oligonucleotide sequences of primers used for RT-qPCR analysis
| GENE | GENE ACCESSION NUMBER | PRIMER SEQUENCE (5’-3’) | PRODUCT SIZE (BP) |
|---|---|---|---|
| TGFB1 | NM_000660 | CCTTGCGGAAGTCAATGTACA GGCCTTTCCTGCTTCTCATG | 150 |
| CD(ENG) 105 | BC014271 | CACTAGCCAGGTCTCGAAGG CTGAGGACCAGAAGCACCTC | 165 |
| (SFSP1001 A4) | CR450345 | TCTTGGGGAAAAGGACAGATGA CCCAACCACATCAGAGGAGT | 195 |
| ACTB | NM_001101 | CTCAGGAGGAGCAATGATCTTG AAAGACCTGTACGCCAACAC | 132 |
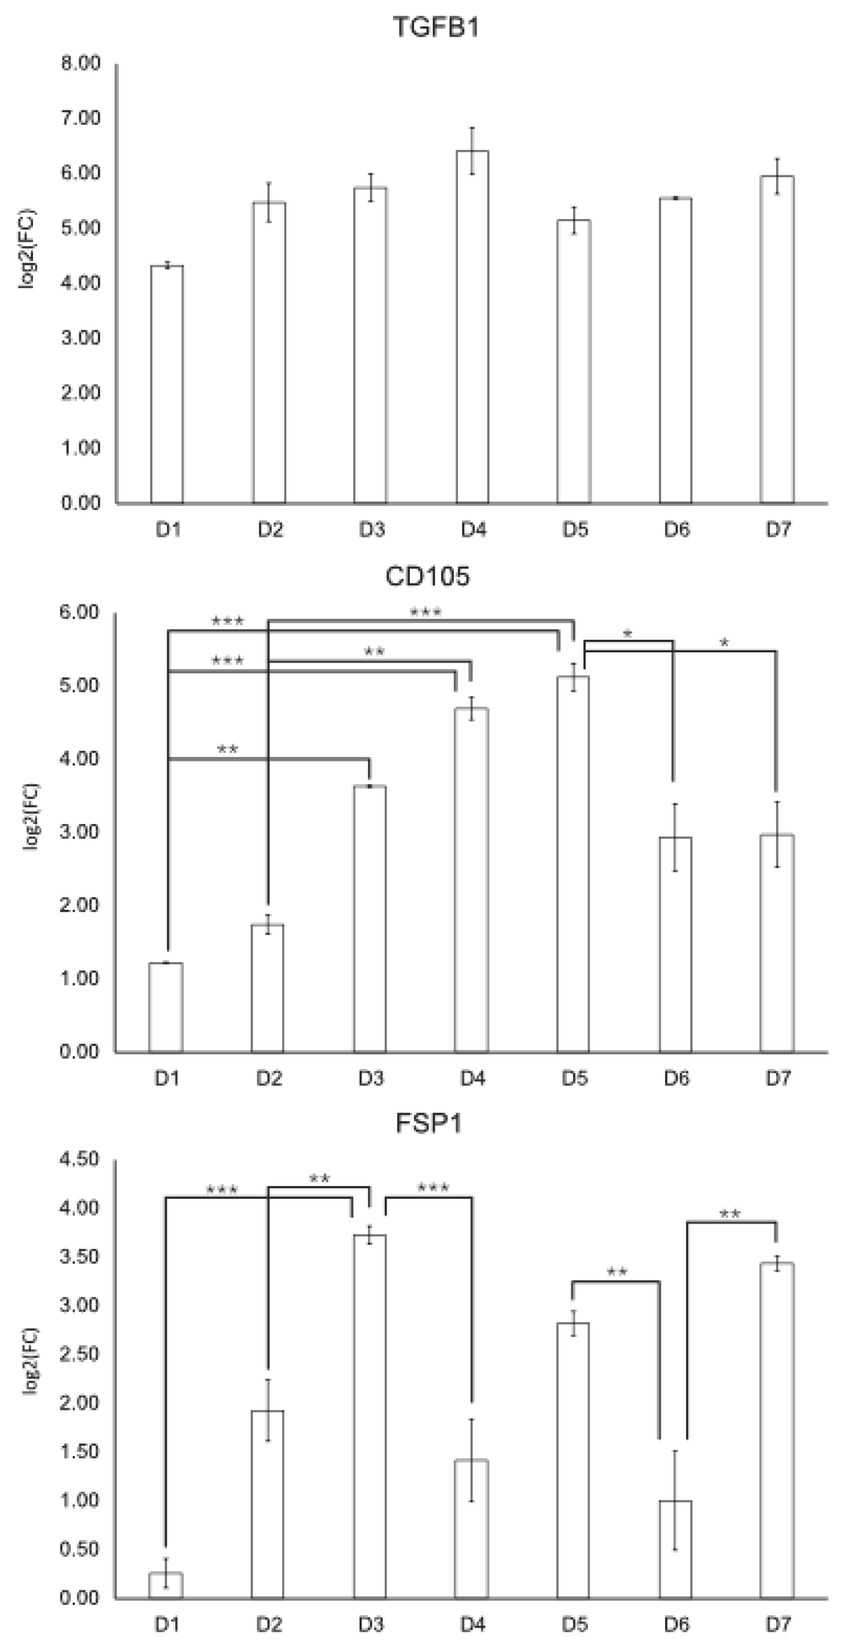
Figure 1
TGFB 1, CD105 and FSP1 expression in granulosa cells during 7-day in vitro culture. Data was presented like logarithm of fold change. Statistical analysis of the data was performed using the T-test and the differences were considered to be significant at the level of p<0.001 (***), p<0.01 (**), p<0.05 (*)