
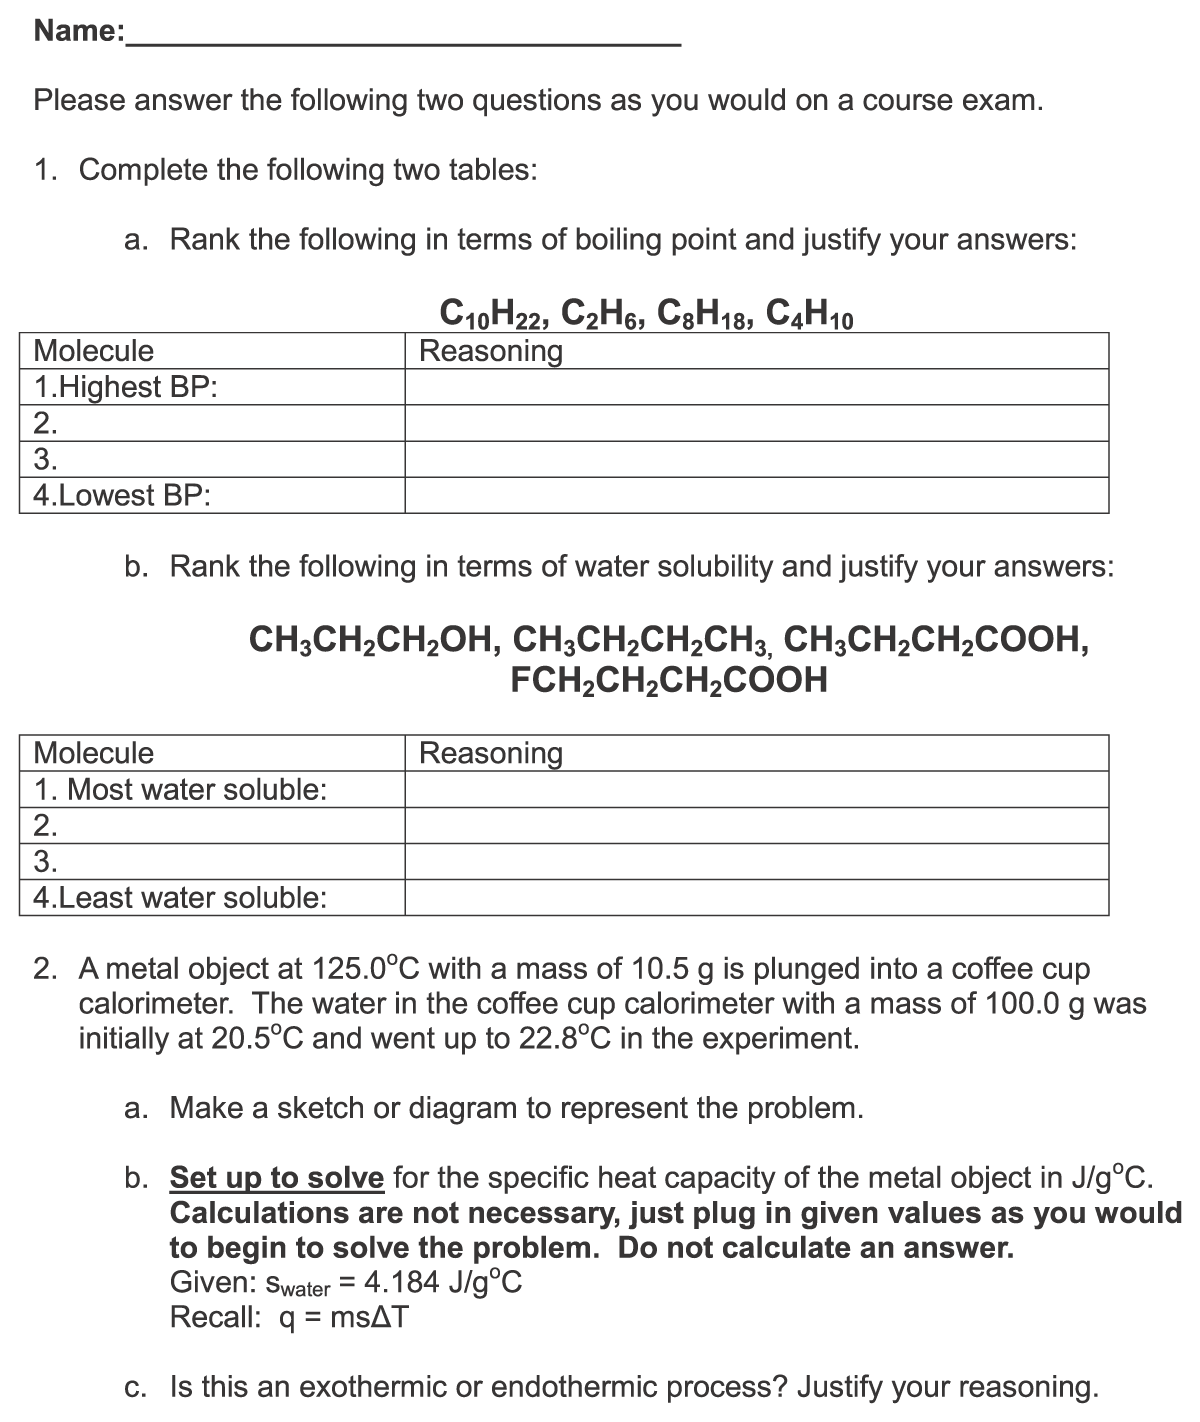
Figure 1
Assessment Instrument (Condensed).
Table 1
Common Problem-Solving Strategies Identified for the Thermodynamics Question.
| STRATEGY | DESCRIPTION |
|---|---|
| Circling | Circling or boxing the answer |
| Margins | Writing notes in the margins of the problem |
| Underlining | Underlining, circling, boxing, or otherwise highlighting written words, formulas, or numbers in the question |
| Topic recall | Specific words, phrases, or diagrams commonly used in instruction are reproduced by the subject in responding to the question |
| Priming equations | Equation is written before putting in numbers for calculations |
| Labeling and variables | Variables and their values are noted on diagrams or in a list |
| Related q’s | The relationship between heat (q) evolved and heat absorbed is specifically stated (qsystem = –qsurroundings) |
| Before and after | Shows how conditions in the coffee cup calorimeter changes in the described experiment (for example, changes in temperature) |
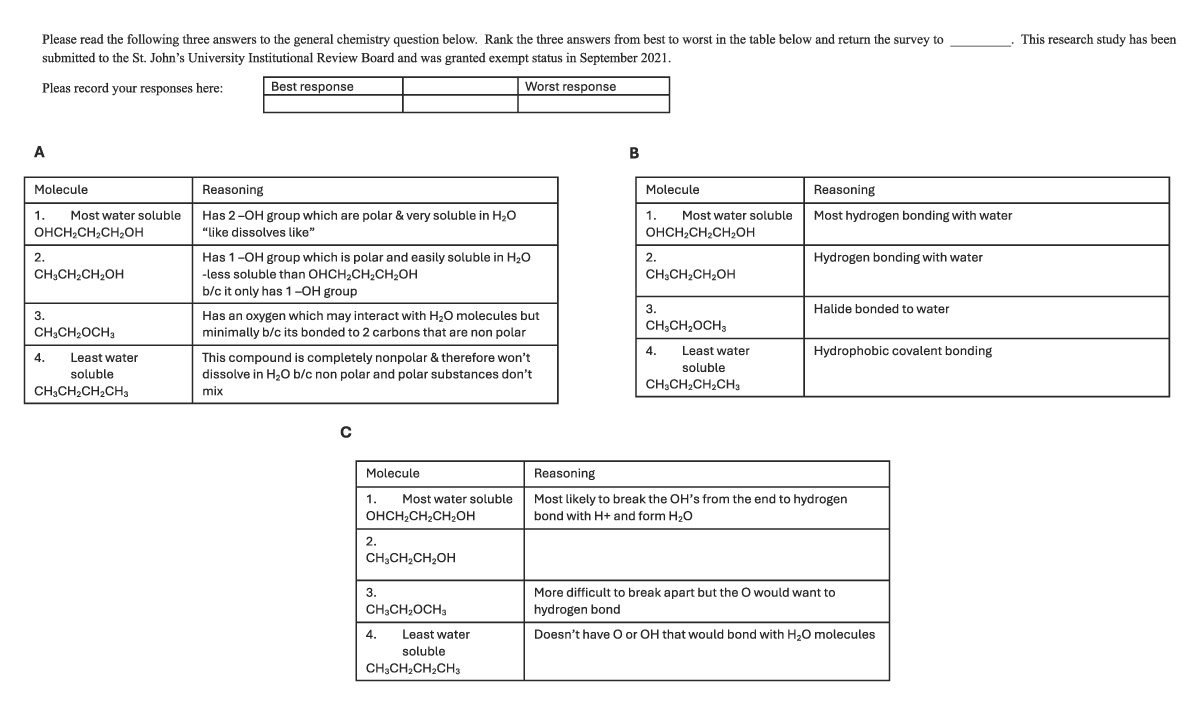
Figure 2
Example Survey Given to Experts to Rank Explanations.
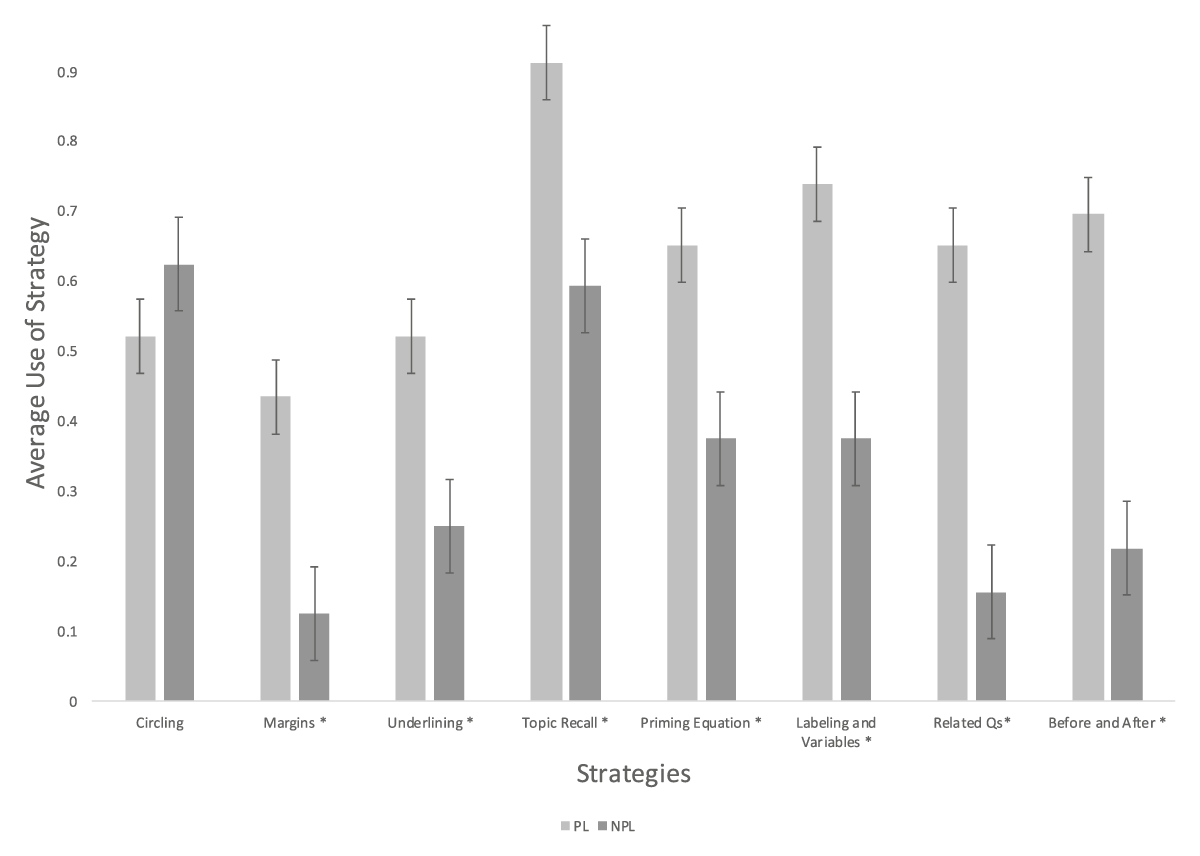
Figure 3
Average Problem-Solving Strategy Use Between Peer Teachers and Comparison Students.
Note. Asterisk * denotes significance.
Table 2
Calculated Significance (p) of Each Problem-Solving Strategy (p = 0.05 CI Two-Tailed) and Effect Size Calculated by Cohen’s d.
| STRATEGY | SIGNIFICANCE | COHEN’S d | EFFECT SIZE |
|---|---|---|---|
| Circling | 0.46 | 0.550 | Medium |
| Margins | 0.015* | 0.554 | Medium |
| Underlining | 0.045* | 0.551 | Medium |
| Topic recall | 0.0043* | 0.549 | Medium |
| Priming equations | 0.044* | 0.550 | Medium |
| Labeling variables | 0.0063* | 0.549 | Medium |
| Related q’s | 0.00020* | 0.553 | Medium |
| Before and after | 0.00035* | 0.550 | Medium |
[i] Note. Asterisk * denotes significance.
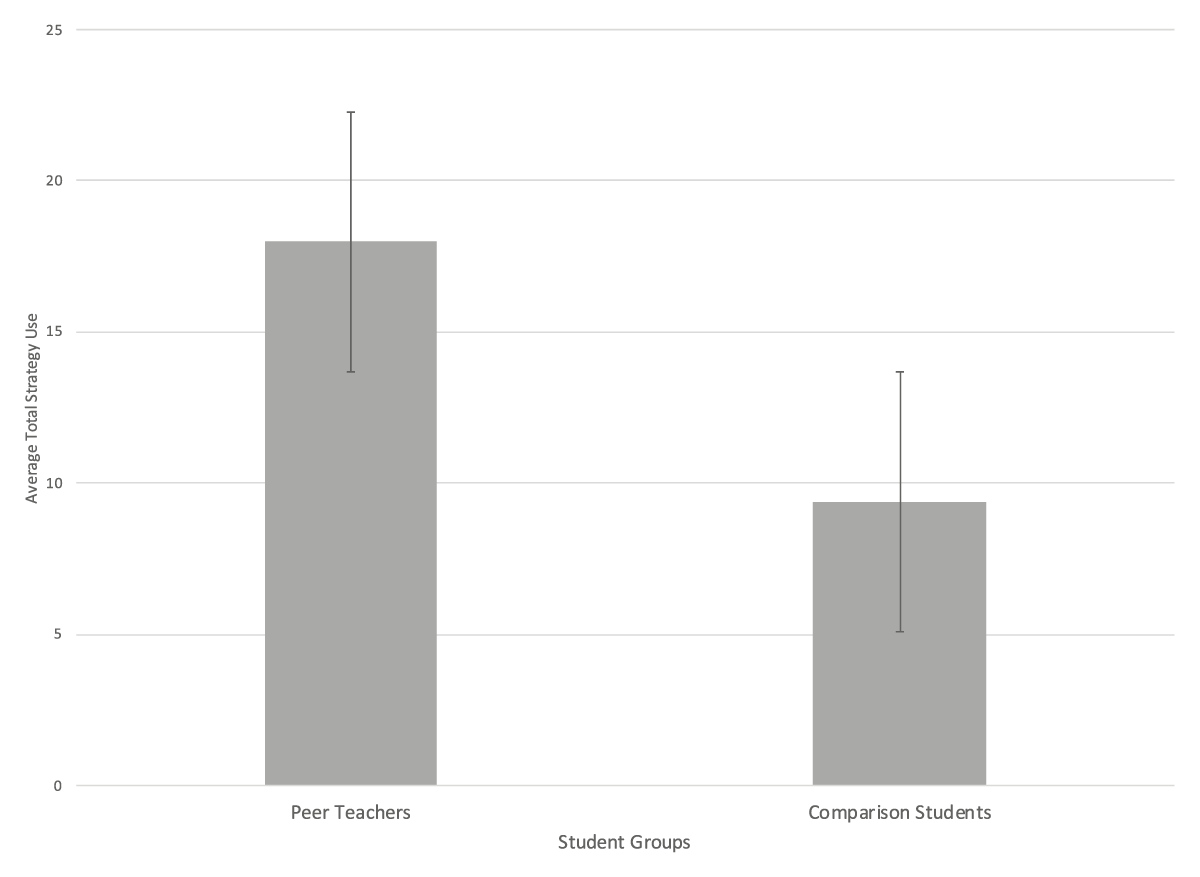
Figure 4
Normalized Average Use of Identified Problem-Solving Strategies for Peer Teachers and Comparison Students.
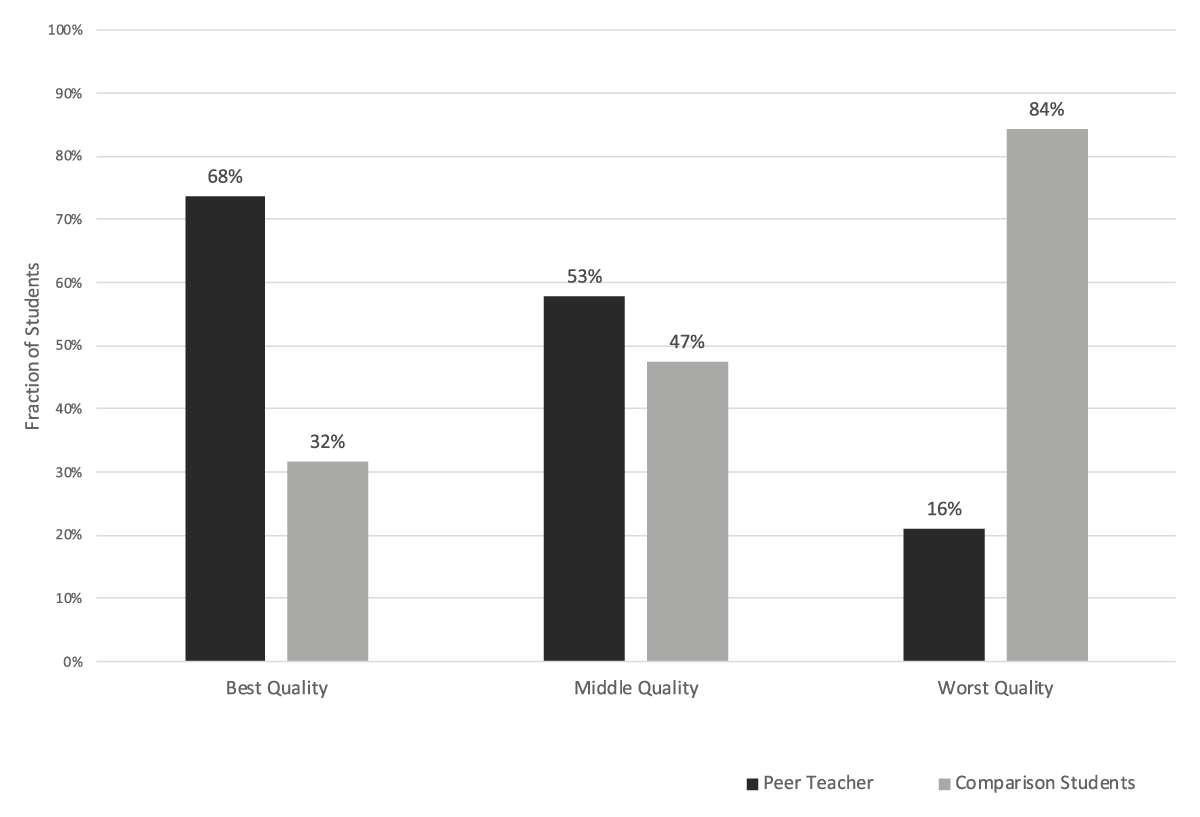
Figure 5
Expert Ranking of Written Explanations.
Note. All written explanations were correct in content.