
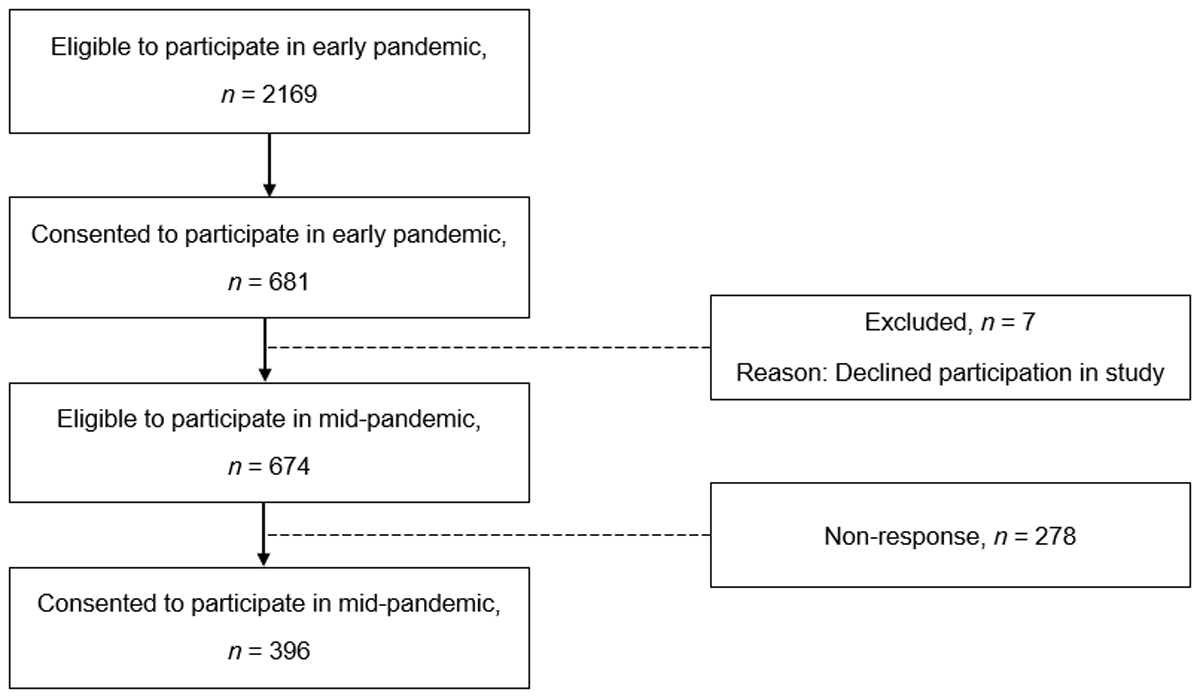
Figure 1
Flowchart with invited participants, numbers at each time point, and dropouts between time points (early and mid-pandemic).
Table 1
Definition and distribution of observations on support indicators, both early and mid-pandemic.
| INDICATOR & DEFINITION | NOT OFFERED n (%) | NOT PARTICIPATED n (%) | PARTICIPATED n (%) | TOTAL n |
|---|---|---|---|---|
| Room – Access to a quiet space, e.g., a staff room where you can rest and recover | ||||
| Early pandemic | 233 (38.8) | 136 (22.6) | 232 (38.6) | 190 |
| Mid-pandemic | 190 (48.0) | 79 (19.9) | 127 (32.1) | 396 |
| Information – Websites, brochures, or other material on stress management, or mental health | ||||
| Early pandemic | 168 (27.9) | 264 (43.8) | 171 (28.4) | 603 |
| Mid-pandemic | 104 (26.7) | 177 (45.4) | 109 (27.9) | 390 |
| Education – Education or other training regarding potentially traumatic situations at work | ||||
| Early pandemic | 319 (53.0) | 135 (22.4) | 148 (24.6) | 602 |
| Mid-pandemic | 163 (41.6) | 90 (23.0) | 139 (35.5) | 392 |
| Group support – Scheduled appointments to check in on how colleagues feel and to support each other | ||||
| Early pandemic | 205 (34.1) | 111 (18.4) | 286 (47.5) | 602 |
| Mid-pandemic | 193 (49.1) | 48 (12.2) | 152 (38.7) | 393 |
| Supervised group support – Scheduled conversations in a group led by psychologists, priests, HR specialist, or other relevant professionals | ||||
| Early pandemic | 201 (33.3) | 159 (26.4) | 243 (40.3) | 603 |
| Mid-pandemic | 174 (44.7) | 73 (18.8) | 142 (36.5) | 389 |
| Peer support – Initiatives based on collegial support, peer consultation, mentorship, etc. | ||||
| Early pandemic | 247 (41.8) | 147 (24.9) | 197 (33.3) | 591 |
| Mid-pandemic | 202 (52.3) | 75 (19.4) | 109 (28.3) | 386 |
| Individual support – One on one conversations lead by a psychologist, an HR specialist, a manager, or other specialist | ||||
| Early pandemic | 268 (45.0) | 243 (40.8) | 85 (14.3) | 596 |
| Mid-pandemic | 198 (51.4) | 130 (33.8) | 57 (14.8) | 385 |
Table 2
Model comparison of the cross-sectional analysis for both time points.
| k | LL | SCF | #fp | AIC | BIC | SABIC | ENTROPY | VLMR | LMR |
|---|---|---|---|---|---|---|---|---|---|
| T1 | |||||||||
| 2 | –4021.317 | 1.0319 | 29 | 8100.634 | 8228.577 | 8136.508 | .882 | <.0001 | <.0001 |
| 3 | –3812.544 | 1.0443 | 44 | 7713.088 | 7907.208 | 7767.518 | .891 | .2541 | .2567 |
| 4 | –3773.988 | 1.1925 | 59 | 7665.976 | 7926.273 | 7738.961 | .837 | .8811 | .8826 |
| T2 | |||||||||
| 2 | –2561.818 | 1.0968 | 29 | 5181.635 | 5297.096 | 5205.079 | .790 | <.0001 | <.0001 |
| 3 | –2460.109 | 1.1174 | 44 | 5008.218 | 5183.401 | 5043.788 | .802 | <.0001 | <.0001 |
| 4 | –2430.404 | 1.0988 | 59 | 4978.809 | 5213.712 | 5026.504 | .821 | .0426 | .0442 |
[i] Note. k = number of latent classes in the model; LL = model log likelihood; SCF = scaling correction factor of the robust maximum likelihood estimator (MLR); #fp = number of free parameters; AIC = Akaike information criterion; BIC = Bayesian information criterion; SABIC = sample-adjusted BIC; VLMR = p-value of the Vuong-Lo-Mendell-Rubin likelihood ratio test; LMR = p-value of the adjusted Lo–Mendell–Rubin likelihood ratio test.
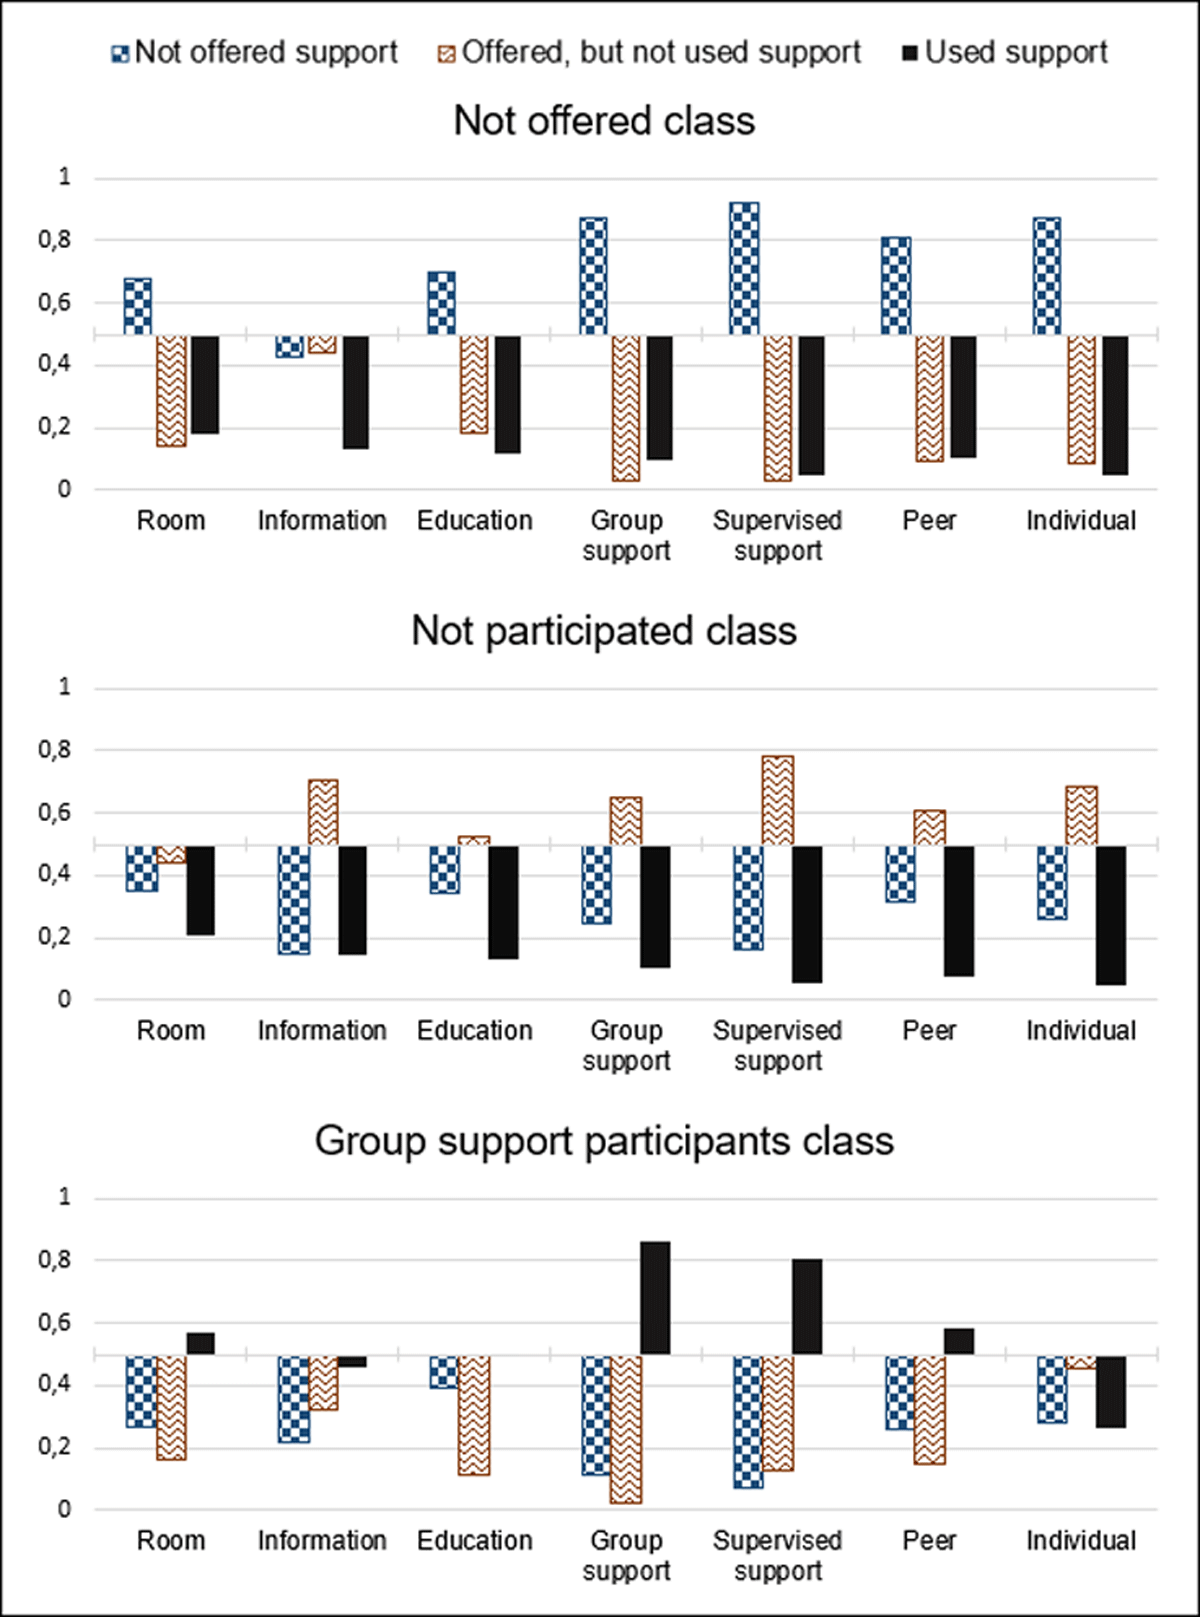
Figure 2
Final three-class solution for both early and mid-pandemic with probability of class membership based on fit-indicators.
Note. The Y-axis shows estimates of item response probability from the LTA structural model. Bars are centered around .5.
Table 3
Prevalence of classes and transitions across time points.
| NOT OFFERED (1) | NOT PARTICIPATED (2) | GROUP SUPPORT PARTICIPANTS (3) | |
|---|---|---|---|
| Class membership based on the most likely latent class pattern (%) | |||
| Early pandemic | 29.0 | 24.1 | 46.8 |
| Mid-pandemic | 39.5 | 16.8 | 43.7 |
| Transition probabilities from early pandemic classes (row) to mid-pandemic classes (columns, %) | |||
| Not offered (1) | 90.2 | 3.8 | 6.0 |
| Not participated (2) | 34.5 | 49.2 | 16.3 |
| Group support participants (3) | 18.6 | 5.6 | 75.8 |
[i] Note. Class membership based on most likely latent class pattern, and transition probabilities based on estimated model from the structural latent transition model.
Table 4
Tests of class similarity.
| MODEL | LL | SCF | #fp | AIC | BIC | SABIC | CAIC | ENTROPY |
|---|---|---|---|---|---|---|---|---|
| Configural | –6272.653 | 1.0808 | 88 | 12721.307 | 13112.530 | 12833.140 | 13200.53 | .692 |
| Structural | –6338.240 | 1.1603 | 46 | 12768.480 | 12972.983 | 12826.939 | 13018.983 | .679 |
| Distributional | –6347.269 | 1.1785 | 44 | 12782.538 | 12978.150 | 12838.455 | 13022.15 | .672 |
| LTA | –6256.423 | 1.0000 | 8 | 12528.846 | 12564.412 | 12539.013 | 12572.412 | .759 |
| Predictive free | –3908.527 | 0.7613 | 74 | 7965.053 | 8245.284 | 8010.560 | 8319.284 | .879 |
| Predictive time varying | –3976.787 | 1.0300 | 32 | 8017.575 | 8138.756 | 8037.254 | 8170.756 | .835 |
| Predictive similarity | –3985.659 | 1.2616 | 18 | 8007.317 | 8075.482 | 8018.387 | 8093.482 | .832 |
| Predictive null model | –4033.934 | 1.0000 | 4 | 8075.868 | 8091.016 | 8078.328 | 8095.016 | .819 |
| Explanatory free | –11377.963 | 0.9480 | 56 | 22867.925 | 23118.116 | 22940.319 | 23174.116 | .746 |
| Explanatory similarity | –11413.552 | 0.9349 | 44 | 22915.105 | 23111.683 | 22971.986 | 23155.683 | .748 |
Table 5
Class membership and work-related characteristics.
| CHARACTERISTIC | NOT OFFERED (1) | NOT PARTICIPATED (2) | ||
|---|---|---|---|---|
| LOGIT | OR [95% CI] | LOGIT | OR [95% CI] | |
| Gender | –0.060 | 0.942 [0.456, 1.946] | –0.353 | 0.702 [0.293, 1.682] |
| Age | 0.004 | 1.004 [0.980, 1.029] | –0.013 | 0.987 [0.959, 1.017] |
| Assistant Nurse | 1.154** | 3.170 [1.385, 7.254] | –0.574 | 0.563 [0.226, 1.408] |
| Nurse | 0.524 | 1.688 [0.785, 3.630] | –0.876* | 0.417*** [0.193, 0.899] |
| Physician | 1.549** | 4.706 [1.711, 12.941] | 0.943 | 2.569 [0.991, 6.659] |
| Frontline | –1.436*** | 0.238*** [0.144, 0.393] | –1.076*** | 0.341*** [0.192, 0.604] |
| Changed tasks | –0.251 | 0.778 [0.478, 1.268] | 0.259 | 1.296 [0.777, 2.161] |
[i] Note. The group support participants class (3) was selected as reference. * = p < .05, ** = p < .01, *** = p < .001.
Table 6
Profile membership and mental health.
| NOT OFFERED (1) | NOT PARTICIPATED (2) | GROUP SUPPORT PARTICIPANTS (3) | ||||
|---|---|---|---|---|---|---|
| M | SD | M | SD | M | SD | |
| Early pandemic | ||||||
| Burnout T1 | 2.27a | 0.69 | 2.32b | 0.80 | 2.68ab | 0.73 |
| Burnout T2 | 2.21c | 0.76 | 2.08d | 0.71 | 2.29cd | 0.77 |
| Sleep disturbance T1 | 3.69 | 1.54 | 3.68 | 1.62 | 3.83 | 1.73 |
| Sleep disturbance T2 | 3.57 | 1.73 | 3.24 | 1.54 | 3.35 | 1.49 |
| Mid-pandemic | ||||||
| Burnout T3 | 2.45e | 0.86 | 1.85ef | 0.55 | 2.50f | 0.72 |
| Burnout T4 | 2.59i | 0.79 | 1.72ij | 0.51 | 2.50j | 0.75 |
| Sleep disturbance T3 | 3.69g | 1.57 | 2.62gh | 1.19 | 3.46h | 1.54 |
| Sleep disturbance T4 | 4.00k | 1.50 | 2.48kl | 1.19 | 3.42l | 1.67 |
[i] Note. Values marked with the same letter within a row differ significantly from each other, all other values are similar within each row (a, b, c, d, e, f, i, j and k: p < .001; g and l: p = .002; h: p = .016).