
When confronted with a crisis, organizations commonly have to make difficult decisions on how to best allocate limited resources (Demerouti & Bakker, 2022). On the one hand, early support actions increase the potential of being able to help both the staff and the organization deal with the crisis. On the other hand, early interventions may be uninformed and unstructured, with the risk of being ineffective or even having negative effects (Maitlis & Sonenshein, 2010). In this study, we investigate how healthcare workers responded to psychological support offered early on and in the middle of the crisis resulting from the COVID-19 pandemic.
During the COVID-19 pandemic, healthcare organizations feared a significant impact on both patient care and the mental health of healthcare workers (Sharifi et al., 2020). The urgent circumstances of the early pandemic stressed the need to assess the well-being and resilience of staff within healthcare organizations (Turner et al., 2021) and prompted the community of mental health professionals to react with calls for psychological support (Holmes et al., 2020). However, these requests left many practical questions unanswered: Which form of support is most effective in an immediate crisis, and what is needed over time? How should support be implemented and adapted to the unforeseen development of a long-term pandemic?
Psychological support as crisis management
Most healthcare organizations chose a proactive crisis management approach, taking early action by implementing multifaceted psychological support programs (Greenberg et al., 2020; Ripp et al., 2020). These programs were often based on guidelines using a range of different tools and support forms, such as social support, stress management, and psychoeducation (Albott et al., 2020; Billings et al., 2020; Chen et al., 2020; Maben & Bridges, 2020; Wu et al., 2020).
The large variation in support types targeted a presumed difference in what type of support would be needed by the diverse occupational groups within healthcare, depending on how and in what way their work environment was affected by the pandemic (Appelbom et al., 2021; Blake et al., 2020; Crittenden et al., 2021; Nembhard et al., 2020). Often, psychological support initiatives targeted mainly frontline staff that were perceived to have greater risk of experiencing high stress levels (Cai et al., 2020), e.g., emergency medicine providers, intensive care staff, or healthcare workers transferred into COVID-19 units (Galanis et al., 2021; Huang et al., 2020; Kok et al., 2021; Kramer et al., 2021; Pappa et al., 2020; Stafseth et al., 2022; Yamane et al., 2022). Some programs also focused specifically on nurses (Maben & Bridges, 2020), a medical profession with high reporting of moral and emotional stress during the pandemic (Couper et al., 2022) and who, as an occupational group, experienced high burnout levels even before the crisis (Bujacz et al., 2021).
Engaging healthcare workers in the support
Despite increased awareness of potential risks to healthcare workers’ mental health during the COVID-19 pandemic (Turner et al., 2021), several studies pointed out the difficulties in involving healthcare staff in different types of support organized at the work sites (Lou et al., 2021; Muller et al., 2020). This underuse has been linked to organizational barriers that made it difficult for healthcare workers to use the offered support (Keyworth et al., 2022). First, support interventions were often rapidly implemented, which limited the possibility of thoroughly planning the feasibility of the interventions (Drury et al., 2021). Understaffing or scheduling problems were reported to hinder healthcare workers interested in using the support from participating (Blake et al., 2020; Juan et al., 2021). Second, interventions were often implemented outside of ordinary support functions such as HR or occupational health services. This limited the availability of resources that could keep the support functions active over time (Appelbom et al., 2021; Blake et al., 2020).
Help-seeking among healthcare workers during a crisis
The underuse of support may also have been related to a discrepancy between what was offered and the type of support healthcare workers wanted (Crittenden et al., 2021). Reports from the COVID-19 pandemic showed that if support content was adjusted according to what healthcare workers highlighted as important, participation rates increased (Chen et al., 2020). Consequently, the effectiveness of psychological support interventions seems to depend on healthcare workers’ general willingness to seek help and engage with it (Demerouti & Bakker, 2022; Pollock et al., 2020).
The tendency among healthcare workers to cope with stress at work by engaging with psychological support during a crisis can therefore be investigated within the help-seeking behavior framework (Rickwood & Thomas, 2012). Importantly, help-seeking as a concept refers not only to the intention to seek help but also to the actual behavior—in this context, engaging (or not) with different types of psychological support (Rickwood & Thomas, 2012). For example, healthcare organizations may want to prioritize support that promotes mental health over time (Joyce et al., 2016), but healthcare workers may prefer resources targeting immediate stress reduction (Kelker et al., 2021).
Therefore, in order to improve the effectiveness of rapidly implemented psychological support programs, more knowledge is needed on the help-seekingbehaviors of healthcare workers during a crisis in relation to the use of different types of psychological support (Pollock et al., 2020). Healthcare workers are a heterogenous group that will likely interact with psychological support in different ways depending on their role-related needs, how the crisis affects their work environment, and to what extent they experience increased stress levels (Kisely et al., 2020; Pappa et al., 2022). Further, both the availability of support and healthcare workers’ help-seeking behavior may vary throughout different stages of a longstanding crisis (Blake et al., 2020). Consequently, more knowledge is also needed on how healthcare workers’ help-seeking behavior may differ both between subgroups of healthcare workers and over time (Pappa et al., 2022).
The present study
This study investigates responses to multifaceted psychological support programs implemented within healthcare during the COVID-19 pandemic. Using person-centered latent class and transition analyses (Morin et al., 2018, 2020), this study aims to explore patterns of help-seeking behavior among healthcare workers during a crisis based on how they engaged with different psychological support formats during consecutive phases of the pandemic. A person-centered analysis relaxes the assumption that everyone in the sample belongs to the same population and can therefore identify subgroups within a heterogenous sample that share similar characteristics (Morin et al., 2020). Such an analysis is therefore especially useful when studying complex longitudinal observational data with many potential interactions (Morin et al., 2018).
In the present study, the complexity of the data lies in the variety of forms of support offered over time during a prolonged crisis. Using a person-centered approach will therefore allow us to not only investigate how healthcare workers differ in their help-seeking behavior but also how they may show different patterns of support use during the early and mid-stages of the crisis depending on their occupational roles, work environment, and mental health. Our research questions are:
How many latent classes can healthcare workers be grouped into based on their help-seeking behavior, and are they similar in the early and mid-pandemic?
How are gender, age, occupational role, and frontline work characteristics during the pandemic associated with membership in certain classes of help-seeking behavior, early as well as mid-pandemic?
How are burnout symptoms and sleep disturbance related to membership in different classes of help-seeking behavior, early as well as mid-pandemic?
Method
Participants and procedure
Data from the early phase of the COVID-19 pandemic were collected in May and June of 2020, and data from the mid-pandemic were collected in February and March 2021. In the early phase of the pandemic, the study sample consisted of 681 (75.8% women, mean age = 44 years) participants from two Swedish hospitals in the Stockholm region. The occupational roles were spread across assistant nurses (22.3%), nurses (35.4%), physicians (17.3%), and other categories of staff, including administrative personnel (21.0%). Half of the sample (49.9%) were frontline workers, and 48.3% stated that they had performed new work tasks related to the COVID-19 situation. Mid-pandemic, 396 participants remained in the sample; 19.6% of them were characterized as frontline staff, and 15.4% reported pandemic-related changes in work tasks. A flowchart with more detailed information on the sample size and number of dropouts is presented in Figure 1.
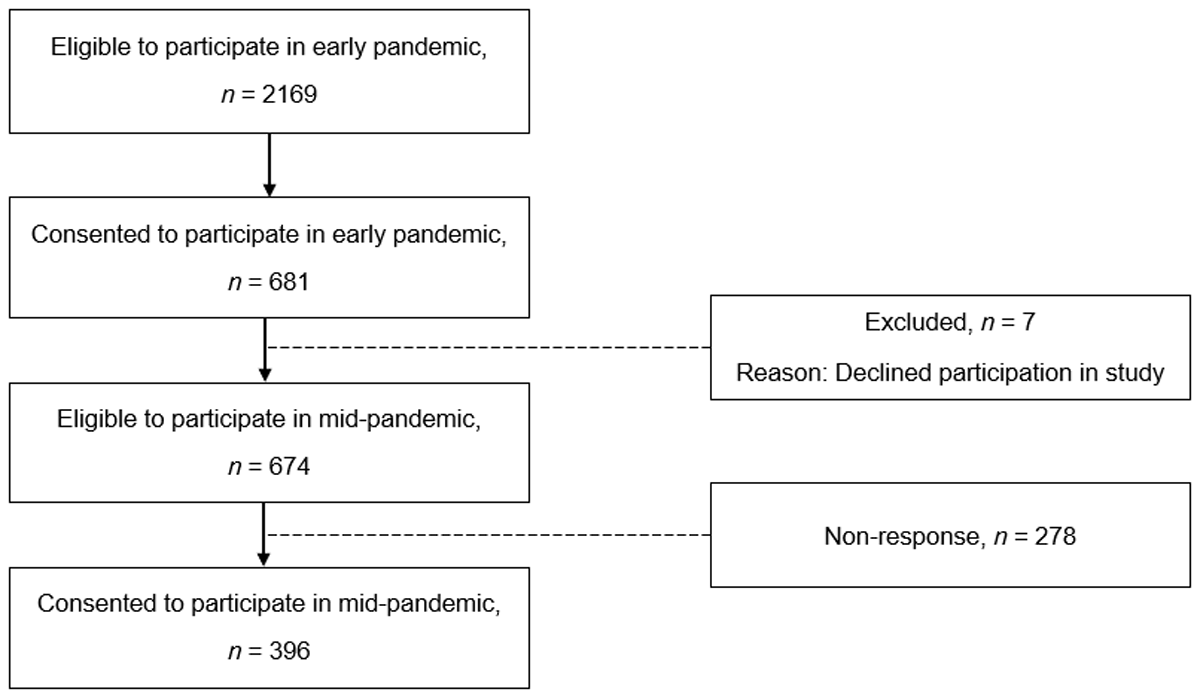
Figure 1
Flowchart with invited participants, numbers at each time point, and dropouts between time points (early and mid-pandemic).
We performed a dropout analysis on all variables included in the statistical analysis. Compared to the dropouts, those who stayed in the study during the mid-pandemic were older (+4.32 years). There were no other statistically significant differences (see Tables S1 and S2 in the supplementary materials).
Participants were recruited through an invitation email containing information about the study and a link to the survey. Email addresses for all staff members were provided to the researchers by the department heads or the Human Resources department. Participants were informed of the study procedure and provided their informed consent. The study was approved by the Swedish Ethical Review Authority (Dnr: 2020-01795), with amendments (2020-03495, 2020-04959).
Measures
Indicators
The help-seeking behavior classes were formed of seven psychological support indicators, i.e., room, information, education, peer support, supervised group support, group support,1 and individual support. Each indicator was measured with an instruction worded “Have you been offered any of the following types of support during the current pandemic?” and a three-point ordinal response scale: no (1), yes, I have been offered but not used or participated in them (2), and yes, I have used or participated in them2 (3). See Table 1 for the distribution of observations on each indicator in early and mid-pandemic and the definition of each indicator.
Table 1
Definition and distribution of observations on support indicators, both early and mid-pandemic.
| INDICATOR & DEFINITION | NOT OFFERED n (%) | NOT PARTICIPATED n (%) | PARTICIPATED n (%) | TOTAL n |
|---|---|---|---|---|
| Room – Access to a quiet space, e.g., a staff room where you can rest and recover | ||||
| Early pandemic | 233 (38.8) | 136 (22.6) | 232 (38.6) | 190 |
| Mid-pandemic | 190 (48.0) | 79 (19.9) | 127 (32.1) | 396 |
| Information – Websites, brochures, or other material on stress management, or mental health | ||||
| Early pandemic | 168 (27.9) | 264 (43.8) | 171 (28.4) | 603 |
| Mid-pandemic | 104 (26.7) | 177 (45.4) | 109 (27.9) | 390 |
| Education – Education or other training regarding potentially traumatic situations at work | ||||
| Early pandemic | 319 (53.0) | 135 (22.4) | 148 (24.6) | 602 |
| Mid-pandemic | 163 (41.6) | 90 (23.0) | 139 (35.5) | 392 |
| Group support – Scheduled appointments to check in on how colleagues feel and to support each other | ||||
| Early pandemic | 205 (34.1) | 111 (18.4) | 286 (47.5) | 602 |
| Mid-pandemic | 193 (49.1) | 48 (12.2) | 152 (38.7) | 393 |
| Supervised group support – Scheduled conversations in a group led by psychologists, priests, HR specialist, or other relevant professionals | ||||
| Early pandemic | 201 (33.3) | 159 (26.4) | 243 (40.3) | 603 |
| Mid-pandemic | 174 (44.7) | 73 (18.8) | 142 (36.5) | 389 |
| Peer support – Initiatives based on collegial support, peer consultation, mentorship, etc. | ||||
| Early pandemic | 247 (41.8) | 147 (24.9) | 197 (33.3) | 591 |
| Mid-pandemic | 202 (52.3) | 75 (19.4) | 109 (28.3) | 386 |
| Individual support – One on one conversations lead by a psychologist, an HR specialist, a manager, or other specialist | ||||
| Early pandemic | 268 (45.0) | 243 (40.8) | 85 (14.3) | 596 |
| Mid-pandemic | 198 (51.4) | 130 (33.8) | 57 (14.8) | 385 |
Predictors
The extent to which participants worked as frontline staff was measured using a single item: “How often did you work with COVID-19 patients during the last week?” Items were rated on a 4-point response scale3 ranging from never (1), at some point (2), on several occasions (3), to daily (4). Participants who indicated option 1 or 2 were coded as non-frontline workers (0), and participants indicating 3 or 4 were coded as frontline workers (1.62% early pandemic and 37% mid-pandemic) at each time point. Change in work tasks was measured with a single item: “During the pandemic, have you worked with other job tasks than you normally do?” rated with no (0) or yes (1.53% early pandemic and 26% mid-pandemic).
Outcomes
Both outcomes, burnout and sleep disturbance, were measured at four different time points: Time point 1 (T1, data collected from May to June 2020 corresponding to the early pandemic), Time point 2 (T2, data collected from September to November 2021), Time point 3 (T3, data collected from February to March 2021 corresponding to the mid-pandemic), and Time point 4 (T4, data collected from June to September 2021).
Burnout was measured using a 7-item version4 of the Oldenburg Burnout Inventory scale adapted to the Swedish healthcare context (Gustavsson et al., 2010; Halbesleben & Demerouti, 2005). Each item (e.g., “There are days when I feel tired before I arrive at work”) was rated on a 4-point scale ranging from does not apply at all (1), applies to some extent (2), applies to a large extent (3), to applies completely (4). The mean burnout index was 2.37 (SD = 0.76, α = 0.897, ω = 0.898) in T1, 2.21 (SD = 0.76, α = 0.901, ω = 0.902) in T2, 2.40 (SD = 0.80, α = 0.90, ω = 0.90) in T3, and 2.42 (SD = 0.80, α = 0.919, ω = 0.920) in T4.
Sleep disturbance was measured using a single item: “How have you slept during the past week.” Answers were rated on a 7-point scale ranging from very good (1), good (2), fairly good (3), neither good, nor bad (4), fairly bad (5), bad (6), to very bad (7). The mean sleep disturbance was 3.75 (SD = 1.64) in T1, 3.38 (SD = 1.57) in T2, 3.44 (SD = 1.44) in T3, and 3.51 (SD = 1.61) in T4.
Statistical analyses
In our analytical approach, we followed the guidelines proposed by Morin et al. (2020). Each model estimated in the analysis is described in detail below. Code is available in the supplementary materials.
Identifying cross-sectional latent classes of help-seeking behavior
To answer our first research question, a cross-sectional latent class analysis (LCA) was performed for each time point separately, using the seven psychological support items as indicators to distinguish how many meaningful latent classes of help-seeking behavior could be found at each time point. Models with two to four classes were tested. The final solution was chosen based on model fit indicators (AIC, BIC, and SABIC) and our theoretical expectations to find qualitatively different classes in relation to which types of support were used (Nylund-Gibson & Choi, 2018). The statistical model was estimated with 7,000 sets of start values.
Longitudinal class similarity
The stability of help-seeking classes across early and mid-pandemic was tested with a set of longitudinal models where class similarity (i.e., testing whether the structure of the classes was the same across time points) was tested using configural, structural, and distributional tests of similarity (Morin et al., 2020). The procedure is similar to the analysis of measurement invariance. A restricted model can be assumed if at least two of the fit indices decrease (Morin et al., 2020; Nylund-Gibson & Choi, 2018). The configural similarity model assumes the same number of classes over time, the structural similarity model tests whether the structure of classes is similar across time points, and the distributional similarity model tests whether the size of the classes stays the same across time (Morin et al., 2020). In this study, categorical indicators and thresholds were used instead of means and standard deviations in the models; therefore, we did not test for dispersion similarity.
Changes in help-seeking over time were further analyzed in a latent transition model (LTA) based on the structural similarity model. More specifically, we investigated transitions between classes, predictors of class membership, and relationships of class membership with the mental health covariates (Morin et al., 2018, 2020).
Predictive and explanatory models
To address the second and third research questions, predictors and mental health covariates were added to the model. The analysis was conducted using the two-step approach (Bakk & Kuha, 2018). To prevent shifts in measurement parameters, the latent classes were related to predictors and covariates using deactivation of random starts and fixed starting values in a structural model (Bakk & Kuha, 2018; Morin et al., 2020).
To analyze how gender, age, occupational role, and frontline work characteristics were related to class membership, predictive similarity was tested with four models (predictive free, predictive time varying, predictive similarity, and predictive null model). In an LTA, the predictive similarity model tests whether associations between predictors and class membership are the same across time (Morin et al., 2020).
To analyze how class membership was associated with mental health covariates, explanatory similarity was tested with two models (the explanatory free model and the explanatory similarity model). In an LTA, explanatory similarity tests whether associations between class membership and covariates are the same across time. The mental health covariates were therefore allowed to vary over time in the explanatory free model, while the covariate means were fixed across time in the explanatory similarity model (Morin et al., 2020). To test for lagged effects in mental health outcomes, early pandemic class membership was tested with both T1 and T2 covariates, and mid-pandemic class membership was tested with both T3 and T4 covariates.
Analyses were performed using the 8.4 version of Mplus (Muthén & Muthén, 2017). Missing data were handled by FMIL (Lee & Shi, 2021).
Results
Classes of help-seeking behavior
With regards to our first research question, a three-class solution was chosen for both the early and mid-pandemic phases. When testing models with different numbers of classes, the BIC value started to increase when more than three classes were estimated. The AIC and SABIC indicators continued to decrease, but at a smaller rate. When plotting the fit indices, the elbow-plots showed a clear levelling off with more than three classes; see Figures S1 and S2 in supplementary materials. The literature also suggests that when the entropy is equal to or greater than .8, the BIC value should be emphasized over the AIC and SABIC values (Morin et al., 2020). The average posterior probabilities indicated well-separated classes for the three-class solution (Nylund-Gibson & Choi, 2018); see Table S3 in supplementary materials. All fit statistics, including entropy, are presented in Table 2.
Table 2
Model comparison of the cross-sectional analysis for both time points.
| k | LL | SCF | #fp | AIC | BIC | SABIC | ENTROPY | VLMR | LMR |
|---|---|---|---|---|---|---|---|---|---|
| T1 | |||||||||
| 2 | –4021.317 | 1.0319 | 29 | 8100.634 | 8228.577 | 8136.508 | .882 | <.0001 | <.0001 |
| 3 | –3812.544 | 1.0443 | 44 | 7713.088 | 7907.208 | 7767.518 | .891 | .2541 | .2567 |
| 4 | –3773.988 | 1.1925 | 59 | 7665.976 | 7926.273 | 7738.961 | .837 | .8811 | .8826 |
| T2 | |||||||||
| 2 | –2561.818 | 1.0968 | 29 | 5181.635 | 5297.096 | 5205.079 | .790 | <.0001 | <.0001 |
| 3 | –2460.109 | 1.1174 | 44 | 5008.218 | 5183.401 | 5043.788 | .802 | <.0001 | <.0001 |
| 4 | –2430.404 | 1.0988 | 59 | 4978.809 | 5213.712 | 5026.504 | .821 | .0426 | .0442 |
[i] Note. k = number of latent classes in the model; LL = model log likelihood; SCF = scaling correction factor of the robust maximum likelihood estimator (MLR); #fp = number of free parameters; AIC = Akaike information criterion; BIC = Bayesian information criterion; SABIC = sample-adjusted BIC; VLMR = p-value of the Vuong-Lo-Mendell-Rubin likelihood ratio test; LMR = p-value of the adjusted Lo–Mendell–Rubin likelihood ratio test.
When testing for class similarity across time points, the AIC, BIC, and SABIC fit indices decreased in the structural similarity model compared to the configural model. However, when comparing the structural similarity model to the distributional similarity model, the fit indices increased. The model was therefore confirmed to be structurally similar, meaning that the classes were similarly structured in both the early and mid-pandemic periods (Morin et al., 2018, 2020).
The three classes of help-seeking behavior were labeled not offered, not participated, and group support participants. Class membership based on probability to endorse each indicator, both early and mid-pandemic, is shown in Figure 2. Members of the not offered class reported that they had not been offered support in general, apart from information on stress management and mental health, which they were offered but did not use. The not participated group was mostly offered but chose not to participate in support formats. However, the pattern was less clear on two indicators: room for rest and recovery, and education on traumatic events. Finally, the group support participants were more likely to use support. The pattern was stronger for the group-based support indicators (i.e., scheduled forms of supervised or unsupervised group support; see Table 1 for more detailed definitions of indicators).
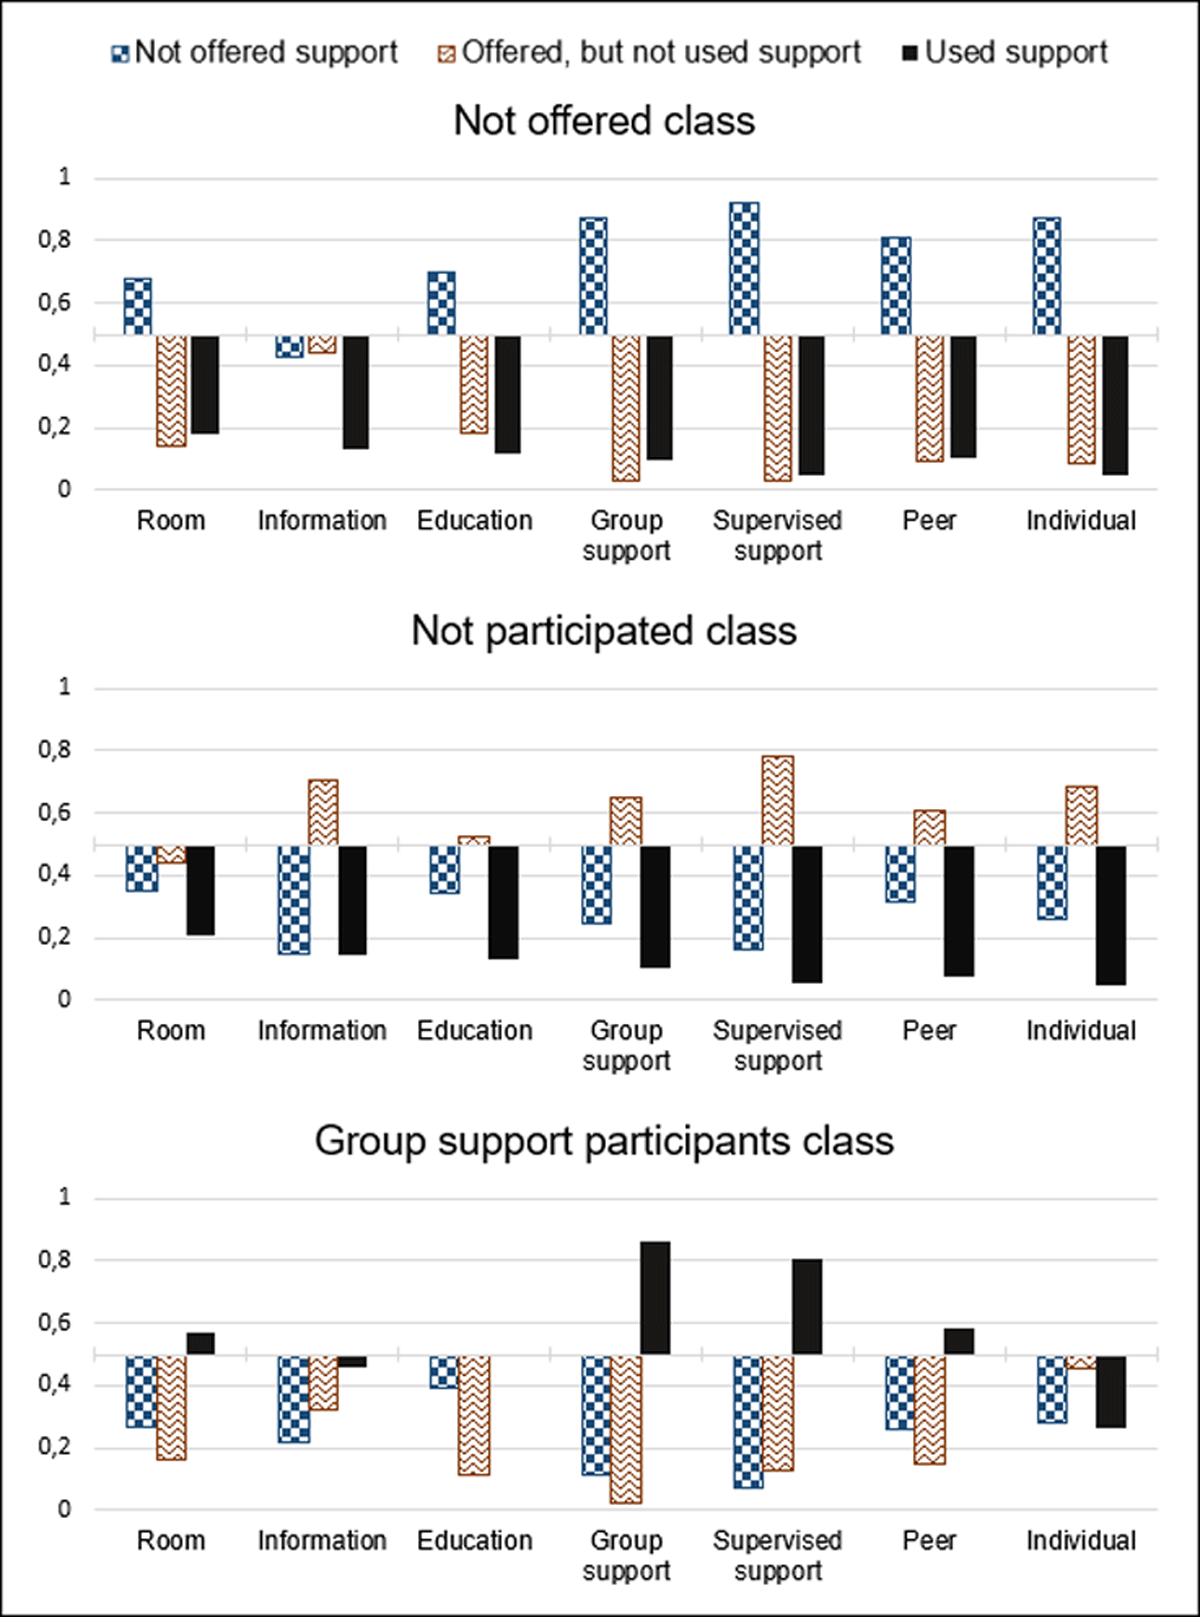
Figure 2
Final three-class solution for both early and mid-pandemic with probability of class membership based on fit-indicators.
Note. The Y-axis shows estimates of item response probability from the LTA structural model. Bars are centered around .5.
Help-seeking behavior over time
Longitudinal data allowed us to explore the first research question further by describing how prevalent the classes were, both early and mid-pandemic, and how participants transitioned between them over time.
At both time points, the most prevalent class was the group support participants class, which included almost half of the sample (46.7% in the early pandemic; see Table 3 upper panel). Mid-pandemic, the not participated class decreased, and the not offered support class increased. Transitions between classes are presented in the lower panel of Table 3 and are interpreted as the percentage of participants who changed class membership between early and mid-pandemic. About 76% of health care staff belonging to the group support participants class early in the pandemic were categorized in the same class mid-pandemic. In the not offered class, almost 90% had the same class categorization at both time points. The not participated class was the least stable over time, with only about 49% of participants belonging to the class both early and mid-pandemic. From this class, most healthcare staff, about 35%, transitioned to the not offered class mid-pandemic.
Table 3
Prevalence of classes and transitions across time points.
| NOT OFFERED (1) | NOT PARTICIPATED (2) | GROUP SUPPORT PARTICIPANTS (3) | |
|---|---|---|---|
| Class membership based on the most likely latent class pattern (%) | |||
| Early pandemic | 29.0 | 24.1 | 46.8 |
| Mid-pandemic | 39.5 | 16.8 | 43.7 |
| Transition probabilities from early pandemic classes (row) to mid-pandemic classes (columns, %) | |||
| Not offered (1) | 90.2 | 3.8 | 6.0 |
| Not participated (2) | 34.5 | 49.2 | 16.3 |
| Group support participants (3) | 18.6 | 5.6 | 75.8 |
[i] Note. Class membership based on most likely latent class pattern, and transition probabilities based on estimated model from the structural latent transition model.
Help-seeking behavior and role characteristics
To explore our second research question, how work-related characteristics were associated with class membership over time, role-related characteristics and demographic variables were added as predictors to the model. When testing for predictive similarity, the predictive similarity model showed the best model fit based on all fit indices (see Table 4). This means that the associations between the predictors and class membership were similar at both time points.
Table 4
Tests of class similarity.
| MODEL | LL | SCF | #fp | AIC | BIC | SABIC | CAIC | ENTROPY |
|---|---|---|---|---|---|---|---|---|
| Configural | –6272.653 | 1.0808 | 88 | 12721.307 | 13112.530 | 12833.140 | 13200.53 | .692 |
| Structural | –6338.240 | 1.1603 | 46 | 12768.480 | 12972.983 | 12826.939 | 13018.983 | .679 |
| Distributional | –6347.269 | 1.1785 | 44 | 12782.538 | 12978.150 | 12838.455 | 13022.15 | .672 |
| LTA | –6256.423 | 1.0000 | 8 | 12528.846 | 12564.412 | 12539.013 | 12572.412 | .759 |
| Predictive free | –3908.527 | 0.7613 | 74 | 7965.053 | 8245.284 | 8010.560 | 8319.284 | .879 |
| Predictive time varying | –3976.787 | 1.0300 | 32 | 8017.575 | 8138.756 | 8037.254 | 8170.756 | .835 |
| Predictive similarity | –3985.659 | 1.2616 | 18 | 8007.317 | 8075.482 | 8018.387 | 8093.482 | .832 |
| Predictive null model | –4033.934 | 1.0000 | 4 | 8075.868 | 8091.016 | 8078.328 | 8095.016 | .819 |
| Explanatory free | –11377.963 | 0.9480 | 56 | 22867.925 | 23118.116 | 22940.319 | 23174.116 | .746 |
| Explanatory similarity | –11413.552 | 0.9349 | 44 | 22915.105 | 23111.683 | 22971.986 | 23155.683 | .748 |
Table 5 presents the results from the predictive similarity model with the group support participants as the comparison group. The results showed that frontline workers (OR = 0.341; 95% CI: 0.192–0.604) and nurses (OR = 0.417; 95% CI: 0.193–0.899) were significantly less likely to belong to the not participated class. Frontline workers were also less likely to belong to the not offered class (OR = 0.23; 95% CI: 0.144–0.393), compared to the group support participants class. Neither of the remaining role characteristics (i.e., being a physician, assistant nurse, or having changed work tasks) nor demographic variables (i.e., gender and age) had a significant association with classes of help-seeking behavior.
Table 5
Class membership and work-related characteristics.
| CHARACTERISTIC | NOT OFFERED (1) | NOT PARTICIPATED (2) | ||
|---|---|---|---|---|
| LOGIT | OR [95% CI] | LOGIT | OR [95% CI] | |
| Gender | –0.060 | 0.942 [0.456, 1.946] | –0.353 | 0.702 [0.293, 1.682] |
| Age | 0.004 | 1.004 [0.980, 1.029] | –0.013 | 0.987 [0.959, 1.017] |
| Assistant Nurse | 1.154** | 3.170 [1.385, 7.254] | –0.574 | 0.563 [0.226, 1.408] |
| Nurse | 0.524 | 1.688 [0.785, 3.630] | –0.876* | 0.417*** [0.193, 0.899] |
| Physician | 1.549** | 4.706 [1.711, 12.941] | 0.943 | 2.569 [0.991, 6.659] |
| Frontline | –1.436*** | 0.238*** [0.144, 0.393] | –1.076*** | 0.341*** [0.192, 0.604] |
| Changed tasks | –0.251 | 0.778 [0.478, 1.268] | 0.259 | 1.296 [0.777, 2.161] |
[i] Note. The group support participants class (3) was selected as reference. * = p < .05, ** = p < .01, *** = p < .001.
Mental health covariates
Finally, burnout and sleep disturbance were added to the model to explore our third research question: whether the groups experienced work-related stress symptoms differently. When comparing the explanatory similarity model to the explanatory free model, the BIC value decreased while both the AIC and SABIC fit indices increased (see Table 4). Therefore, the explanatory free model was chosen, meaning that class membership was allowed to be associated differently with the mental health covariates across time. The explanatory free model results are reported in Table 6 and described for each covariate separately below.
Table 6
Profile membership and mental health.
| NOT OFFERED (1) | NOT PARTICIPATED (2) | GROUP SUPPORT PARTICIPANTS (3) | ||||
|---|---|---|---|---|---|---|
| M | SD | M | SD | M | SD | |
| Early pandemic | ||||||
| Burnout T1 | 2.27a | 0.69 | 2.32b | 0.80 | 2.68ab | 0.73 |
| Burnout T2 | 2.21c | 0.76 | 2.08d | 0.71 | 2.29cd | 0.77 |
| Sleep disturbance T1 | 3.69 | 1.54 | 3.68 | 1.62 | 3.83 | 1.73 |
| Sleep disturbance T2 | 3.57 | 1.73 | 3.24 | 1.54 | 3.35 | 1.49 |
| Mid-pandemic | ||||||
| Burnout T3 | 2.45e | 0.86 | 1.85ef | 0.55 | 2.50f | 0.72 |
| Burnout T4 | 2.59i | 0.79 | 1.72ij | 0.51 | 2.50j | 0.75 |
| Sleep disturbance T3 | 3.69g | 1.57 | 2.62gh | 1.19 | 3.46h | 1.54 |
| Sleep disturbance T4 | 4.00k | 1.50 | 2.48kl | 1.19 | 3.42l | 1.67 |
[i] Note. Values marked with the same letter within a row differ significantly from each other, all other values are similar within each row (a, b, c, d, e, f, i, j and k: p < .001; g and l: p = .002; h: p = .016).
Differences in burnout
Members of the group support participants class in the early pandemic reported significantly higher burnout symptoms compared to both the not participated (ΔM T1 = 0.36, p < .001; ΔM T2 = 0.21, p < .001) and the not offered class (ΔM T1 = 0.41, p < .001; ΔM T2 = 0.08, p < .001) in both T1 and T2.
Mid-pandemic members of the group support participants class also reported more burnout symptoms than the not participated class in both T3 (ΔM = 0.65, p < .001) and T4 (ΔM = 0.78, p < .001). Members of the Nnot offered class mid-pandemic reported more burnout symptoms than the not participated class, both at T3 (ΔM = 0.6, p < .001) and T4 (ΔM = 0.87, p < .001).
Differences in sleep disturbance
In the early pandemic, there were no significant differences in sleep disturbance between the classes at both time points; see Table 6. However, members of the group support participants class in the mid-pandemic reported significantly higher levels of sleep disturbance than members of the not participated class in both T3 (ΔM = 0.84, p = .016) and T4 (ΔM = 0.94, p = .002). Also, the mid-pandemic not offered class reported higher levels of sleep disturbance compared to the not participated class in both T3 (ΔM = 1.07, p = .002) and T4 (ΔM = 1.52, p < .001).
Discussion
In this longitudinal observational study, we followed healthcare workers from the onset of an international crisis—the COVID-19 pandemic—to investigate whether and when they have participated in psychological support initiatives offered to them. We found that healthcare workers could be divided into three groups based on their general pattern of help-seeking behavior. Almost half of the sample participated in support when offered in the form of group-based initiatives. From early to mid-pandemic, the availability of support declined. Nurses and frontline workers participated more often in the support initiatives. We also found that participation in support was associated with higher levels of work-related stress symptoms.
Classes of help-seeking behavior
We found three latent classes of help-seeking behavior that were stable over time: the not offered, not participated, and group support participants classes. We did not find additional groups characterized by more complex combinations of help-seeking behavior, e.g., having been offered or using specific support forms but not others. In other words, we did not find different help-seeking behaviors matching the variety of offered support forms in the multifaceted psychological support programs (Crittenden et al., 2021). Instead, the overall tendency to seek support or not was similar across all support forms within each class. However, there were some interesting differences between groups.
First, participating in grouped-based initiatives that focused on social support (Füllemann et al., 2015; Taylor, 2011) best distinguished between group support participants and the not participated groups. Hence, social support appears to be the most attractive support format related to help-seeking behavior during a crisis (Labrague, 2021). It is important to note that 80% of the study participants also felt supported by their colleagues in the early pandemic (Appelbom et al., 2023). It is therefore likely that experiencing already high levels of social support before the crisis lowers the threshold to also seek out more organized forms of the same support type (Belfroid et al., 2018; Keyworth et al., 2022).
Second, healthcare workers belonging to the group that was not offered to participate in support initiatives were still likely to be aware of existing information on stress management and mental health. This may indicate that offering information on stress management more broadly was prioritized within healthcare organizations, which is possibly related to the fact that fewer organizational resources are needed to spread information templates compared to organizing group sessions (Nielsen et al., 2017).
Psychological support over time
The transitions from both the group support participants-and not participated classes to the not offered group indicate that the availability of psychological support declined over the course of the pandemic. The issue of keeping implemented support programs sustainable over time has been raised in several studies evaluating the implementation of various kinds of resources during the pandemic (Holmes & Västfjäll, 2021; Turner et al., 2021). When a crisis continues for months and months, the demands on support providers are high (Heath et al., 2020). It is therefore likely that the support systems got worn out over time and were less able to provide adequate resources (Drury et al., 2021).
Help-seeking and role characteristics
We found that frontline staff and nurses were more likely to belong to the user class. It is likely that frontline staff and nurses were specifically targeted with the more extensive support interventions when healthcare organizations prioritized more exposed units (Cai et al., 2020). Working at the frontline and being a nurse are well-documented risk factors for increased psychological stress during a crisis involving healthcare (Brooks et al., 2018). Frontline nurses experienced dramatic changes in their work environment during the outbreak of the pandemic, including increased workload, moral stress, and fear of safety (De Brier et al., 2020; Huang et al., 2020; Liu et al., 2020). Healthcare workers belonging to this category had therefore likely an increased need to also seek help.
Still, the crisis certainly also affected the work environment and well-being among physicians (Ju et al., 2022; Salari et al., 2020). The fact that physicians were less responsive to the support may therefore be explained partly by other factors than stress levels, such as increased barriers towards seeking external help for mental health concerns within this professional group (Adams et al., 2010) or psychological support providers being less mindful of their need for support (Shanafelt & Noseworthy, 2017; Spiers et al., 2021).
Differences in burnout symptoms
We found that group support participants in both the early and mid-pandemic experienced higher burnout symptoms in comparison to those who did not participate. However, the differences were small and corresponded to less than one point on the scale. Nevertheless, the association remained significant when testing for time-lagged effects. It is possible that these differences reflect that participants from the units with higher work demands were in general more likely to receive and seek support (Guastello et al., 2022; Nishimura et al., 2021). Interestingly, the mid-pandemic not offered group had similar burnout and sleep disturbance levels as the group support participants, and both groups had higher levels compared to members of the not offered class. This may indicate that those who were not offered support likely needed it as much as those who were offered and used support. Therefore, during a crisis, it may be more beneficial if support is offered broadly within the organization so that the healthcare workers are able to decide if they need it or not.
Both early and mid-pandemic, burnout was higher than what was observed before the COVID-19 pandemic among nurses in a previous longitudinal Swedish study (Bujacz et al., 2021). This indicates that burnout levels were elevated both at the beginning and later in the pandemic. Hence, available psychological support resources are likely needed not only at the onset but also during the later stages of a long-term crisis.
Limitations
To measure participation in psychological support, we used a study-specific instrument based on what support types were implemented at the study sites. This limits the extent to which the results can be compared to other studies on support use and help-seeking. However, the use of a study-specific instrument has likely increased the ecological validity and relevance of our results.
We used self-reported data on all measurements. The ratings on, e.g., to what extent support was offered or used may therefore be biased due to social desirability. However, one strength of the instrument is that we measured actual help-seeking behaviors and not just attitudes towards help-seeking. This way, we were able to capture the behavioral component of help-seeking that is often missing when help-seeking is studied (Rickwood & Thomas, 2012).
Some members of the not offered group were likely just unaware of existing support initiatives. This is a qualitative difference that may be affecting the interpretation of our results. However, at both time points, participants indicated to what extent support had been offered to them since the start of the pandemic. Hence, the large increase in prevalence of the not offered group mid-pandemic indicates that over time, a considerable part of the sample became less aware of the support. Other studies have reported similar tendencies of healthcare workers not being aware of existing resources during the pandemic (e.g., Chen et al., 2020) or forgetting about the support if they are not reminded by colleagues or the organization (Keyworth et al., 2022).
Practical implications
Rather than using organizational resources on extensive support programs, the findings of the current study highlight the importance of prioritizing fewer types of support that healthcare workers are more likely to engage with. Regarding the content of the support, different forms of social support, such as group support or mentorship programs, should be prioritized.
Importantly, organizations should focus on facilitating the sustainability of the support initiatives over time to secure the availability of psychological support for those who need it during a prolonged crisis. This means that the planned allocation of existing resources within the organizations must be prepared to limit dependency on voluntary-based actions that are difficult to maintain long-term (von Thiele Schwarz et al., 2021).
When planning support efforts for future crises, healthcare organizations must also ensure that support is available for all affected occupational groups. This includes organizing resources so the support is accessible, for example, during shifts (Blake et al., 2021), and being mindful of whether stigmas against mental health support exist within the organization (Keyworth et al., 2022).
Conclusions
To increase the effectiveness of psychological support programs in future crises, healthcare organizations should prepare policies on how to implement the type of psychological support that healthcare workers tend to use the most during crises, namely social support. Also, to avoid voluntary-based support programs that are difficult to maintain long-term, policies must involve planned actions on how to expend existing resources within the organizations. Alongside planned actions on how to implement the support during a crisis, healthcare organizations will benefit from fostering informal forms of social support in their day-to-day practice. This will likely reduce the threshold for seeking psychological support when healthcare workers are faced with future crises.
Additional File
The additional file for this article can be found as follows:
Supplementary File 1: Supplementary Materials
Drop-out analysis, Elbow plots and Classification probabilities for cross sectional LCA, and Mplus syntax. DOI: https://doi.org/10.16993/sjwop.224.s1
Notes
[5] In one department (n = 219), the survey did not differentiate between supervised and non-supervised group support in the early pandemic. At the time, only supervised group support was provided at the department, and it was not meaningful to differentiate between the support formats. We therefore imputed answers from the group support to the supervised group support indicator to avoid missing data for the entire department.
[6] In one survey version early in the pandemic and in all versions mid-pandemic, the scale had an additional option: 4 = “Yes, I have used or participated in them several times.” This fourth option was recoded into 3 = “Yes, I have used or participated in them.”
[7] In one survey version early in the pandemic and in all versions mid-pandemic, an additional answering option stating “Not relevant” was available and recoded into the non-frontline category.
[8] At time 1, participants in a sub-cohort (n = 219, 32%) did not receive one burnout item: “over time, one loses a deeper interest in one’s profession.” To correct for this loss, we allowed for the burnout index to be calculated based on six items when needed. This was allowed for all participants at both time points.
Funding Information
This research was funded by a grant from AFA insurance (AFA Försäkring) Dnr 200136.
Competing Interests
The authors have no competing interests to declare.
Author Contributions
S.A has contributed to Conceptualization, Data curation, Formal analysis, Investigation, Methodology, Project administration, Visualization, Writing – original draft, and Writing – review & editing. A.F has contributed to Conceptualization, Investigation, Supervision, and Writing – review & editing. R.K.W has contributed to Conceptualization, Supervision, and Writing – review & editing. A.B has contributed to Conceptualization, Formal analysis, Funding acquisition, Investigation, Methodology, Supervision, and Writing – review & editing.