
Table 1
NIRS calibration statistics of the determined parameters IOM (g/kg DM), MECM (MJ/kg DM), TT-OMD (%), and METT (MJ/kg DM) of the legume samples (n = 431)
Tabelle 1. NIRS Kalibrationsstatistik für folgende Parameter: IOM (g/kg TM), MECM (MJ/kg TM), TT-DOM (%) und METT (MJ/kg TM)
Table 2
Differences between the in vitro analyzed OMD (CM-OMD: pepsin-cellulase method; TT-OMD: Tilley and Terry method) of four standard samples and their in vivo digestibility; TT-OMD data prior to routine correction with in vivo OMD
Tabelle 2. Differenzen der in vitro untersuchten OMD (CM-OMD: Pepsin-Cellulase-Methode; TT-OMD: Tilley und Terry-Methode) für vier Standardproben zu in vivo Verdaulichkeit; TT-OMD Daten vor der Routinekorrektur durch die in vivo OMD
| Standard samples | in vivo OMD±SD | CM-OMD (%) | TT-OMD (%) | ||||||||||
|---|---|---|---|---|---|---|---|---|---|---|---|---|---|
| Range (2) | Range (2) | ||||||||||||
| No. | Cuts/year | Cut | (%) | n(1) | Mean (3) | SD (4) | n(1) | Mean (3) | SD (4) | ||||
| Min | Max | Min | Max | ||||||||||
| 198 | 1 | 1 | 41.9±3.92 | 5 | 0.72 | 3.30 | 2.06 | 1.13 | 24 | −15.44 | 1.89 | −2.44 | 3.99 |
| 232 | 3 | 1 | 68.4±2.13 | 5 | −3.91 | −2.88 | −3.63 | 0.43 | 24 | −10.82 | 1.09 | −3.45 | 3.16 |
| 246 | 4 | 2 | 75.2±2.26 | 4 | 2.92 | 4.34 | 3.78 | 0.63 | 24 | −7.74 | 0.93 | −3.50 | 3.07 |
| 298 | 1 | 1 | 46.7±4.15 | 5 | 2.65 | 3.65 | 2.98 | 0.40 | 23 | −15.56 | 1.22 | −3.20 | 4.68 |
Table 3
ME contents of several forage legumes from the 3-cut system at three cutting dates over study sites and years, based on two different in vitro methods (n = 286), expressed as MJ ME/kg DM
Tabelle 3. ME Gehalt verschiedener Futterleguminosen (3-Schnittsystem) als Mittelwert über Standorte und Jahre, mittels zwei in vitro Methoden (n = 286), als MJ ME/kg TS
| Pepsin-cellulase method (MECM) | Tilley and Terry method (METT) | Means over methods | |||||||||
|---|---|---|---|---|---|---|---|---|---|---|---|
| Cut 1 | Cut 2 | Cut 3 | Mean | Cut 1 | Cut 2 | Cut 3 | Mean | Cut 1 | Cut 2 | Cut 3 | |
| White clover | 11.0 | 10.1 | 10.6 | 10.6 v,V | 10.1 | 8.8 | 9.4 | 9.4 w,V | 10.5 a,A | 9.4 a,C | 10.0 a,B |
| Red clover | 10.3 | 9.7 | 10.0 | 10.0 v,W | 9.2 | 8.2 | 8.8 | 8.7 w,W | 9.8 b,A | 8.9 b,C | 9.4 b,B |
| Lucerne | 9.9 | 9.5 | 9.5 | 9.6 v,X | 8.3 | 7.6 | 7.8 | 7.9 w,X | 9.1 c,A | 8.5 c,B | 8.6 c,B |
| Birdsfoot trefoil | 9.9 | 9.3 | 9.4 | 9.5 v,X | 8.5 | 7.6 | 7.5 | 7.9 w,X | 9.2 c,A | 8.5 c,B | 8.4 d,B |
| Mean | 10.3 g,G | 9.6 g,I | 9.9 g,H | 9.9 | 9.0 h,G | 8.1 h,I | 8.4 h,H | 8.5 | |||
a,b,c,d LSMeans differ between species within cutting date at P < 0.05; SE = 0.07
A,B,C LSMeans differ between cutting dates within species at P < 0.05; SE = 0.07
g,h LSMeans differ between methods within cutting date at P < 0.05; SE = 0.05
G,H,I LSMeans differ between cutting date within method at P < 0.05; SE = 0.05
v,w LSMeans differ between methods within species at P < 0.05; SE = 0.05
V,W,X,Y LSMeans differ between species within method at P < 0.05; SE = 0.05
Table 4
ME contents of forage legumes from different defoliation systems (3-cut system, 3C; 5-cut system, 5C; rotational grazing, RG) from the site in Germany over years, estimated by NIRS based on two different in vitro methods, expressed as MJ ME/kg DM
Tabelle 4. ME Gehalte von Futterleguminosen verschiedener Nutzungssystems (3-Schnitt-, 3C; 5-Schnittsystem, 5C; Umtriebsweide, RG) aus dem Standort Deutschland als mittel über Jahre, geschätzt mittels NIRS aus zwei unterschiedlichen in vitro Methoden, als MJ ME/kg TS
| Pepsin-cellulase method (MECM) | Tilley and Terry method (METT) | Means over methods | |||||||||||||||
|---|---|---|---|---|---|---|---|---|---|---|---|---|---|---|---|---|---|
| Cut 1 | Cut 2 | Cut 3 | Cut 4 | Cut 5 | Mean | Cut 1 | Cut 2 | Cut 3 | Cut 4 | Cut 5 | Mean | Cut 1 | Cut 2 | Cut 3 | Cut 4 | Cut 5 | |
| 3-cut system (n = 176) | |||||||||||||||||
| WC | 11.0 | 10.0 | 10.2 | 10.4 v,V | 10.6 | 8.8 | 9.3 | 9.6 w,V | 10.8 a,A | 9.4 a,C | 9.8 a,B | ||||||
| RC | 10.4 | 9.7 | 9.4 | 9.8 v,W | 9.6 | 8.3 | 8.6 | 8.8 w,X | 10.0 c,A | 9.0 b,B | 9.0 b,B | ||||||
| KC | 10.8 | 10.3 | 10.3 | 10.5 v,V | 9.9 | 9.0 | 8.9 | 9.2 w,W | 10.3 b,A | 9.6 a,B | 9.6 a,B | ||||||
| LC | 9.8 | 9.5 | 9.0 | 9.4 v,X | 8.4 | 7.7 | 7.4 | 7.8 w,Y | 9.1 e,A | 8.6 c,B | 8.2 c,C | ||||||
| BT | 10.0 | 9.7 | 8.9 | 9.6 v,X | 9.1 | 7.9 | 7.0 | 8.0 w,Y | 9.6 d,A | 8.8 bc,B | 8.0 c,C | ||||||
| Mean | 10.4 g,G | 9.8 g,H | 9.6 g,I | 9.9 | 9.5 h,G | 8.3 h,H | 8.2 h,H | 8.7 | |||||||||
| 5-cut system (n = 276) | |||||||||||||||||
| WC | 11.8 | 11.1 | 9.8 | 11.1 | 11.2 | 11.0 v,V | 10.1 | 9.9 | 8.6 | 9.7 | 9.5 | 9.5 w,V | 10.9 a,A | 10.5 a,B | 9.2 b,C | 10.4 a,B | 10.4 a,B |
| RC | 11.2 | 10.8 | 9.9 | 10.4 | 10.7 | 10.6 v,X | 9.6 | 9.5 | 8.4 | 8.8 | 8.6 | 9.0 w,X | 10.4 b,A | 10.1 b,B | 9.1 b,D | 9.6 c,C | 9.6 c,C |
| KC | 11.4 | 10.9 | 10.5 | 10.9 | 10.8 | 10.9 v,W | 9.6 | 9.5 | 9.0 | 9.4 | 9.2 | 9.3 w,W | 10.5 b,A | 10.2 b,B | 9.7 a,C | 10.1 b,B | 10.0 b,B |
| LC | 10.8 | 10.4 | 10.0 | 10.1 | 10.4 | 10.4 v,Y | 8.8 | 8.6 | 8.0 | 8.2 | 8.2 | 8.4 w,Y | 9.8 c,A | 9.5 c,B | 9.0 b,D | 9.2 d,CD | 9.3 d,BC |
| BT | 10.9 | 9.9 | 9.8 | 10.1 | 10.4 | 10.2 v,Z | 8.5 | 7.9 | 7.6 | 7.9 | 8.0 | 8.0 w,Z | 9.7 c,A | 8.9 d,C | 8.7 c,D | 9.0 e,C | 9.2 d,B |
| Mean | 11.2 g,G | 10.6 g,HI | 10.0 g,J | 10.5 g,I | 10.7 g,H | 10.6 | 9.3 h,G | 9.1 h,H | 8.3 h,J | 8.8 h,I | 8.7 h,I | 8.8 | |||||
| RG (n = 238) | |||||||||||||||||
| WC | 11.5 | 10.9 | 10.6 | 11.2 | 11.5 | 11.1 v,V | 10.5 | 9.7 | 9.5 | 9.7 | 9.4 | 9.8 w,V | 11.0 a,A | 10.3 a,B | 10.0 a,C | 10.5 a,B | 10.4 a,B |
| RC | 11.1 | 11.1 | 10.1 | 10.5 | 10.6 | 10.7 v,W | 9.6 | 9.6 | 8.8 | 8.7 | 8.7 | 9.1 w,W | 10.4 b,A | 10.4 a,A | 9.5 b,B | 9.6 b,B | 9.6 b,B |
| LC | 10.6 | 10.5 | 10.4 | 10.2 | 10.4 | 10.4 v,X | 8.7 | 8.8 | 8.7 | 8.2 | 8.1 | 8.5 w,X | 9.6 c,A | 9.7 b,A | 9.6 b,A | 9.2 c,B | 9.2 c,B |
| BT | 9.9 | 10.2 | 9.7 | 10.1 | 10.4 | 10.1 v,Y | 8.2 | 8.3 | 7.8 | 7.7 | 8.1 | 8.0 w,Y | 9.1 d,AB | 9.3 c,A | 8.7 c,C | 8.9 d,BC | 9.3 c,A |
a,b,c,d,e LSMeans differ between species within cutting date at P < 0.05; SE3C = 0.12; SE5C = 0.08; SERG = 0.08
A,B,C,D LSMeans differ between cutting dates within species at P < 0.05; SE3C = 0.12; SE5C = 0.08; SERG = 0.08
g,h LSMeans differ between methods within cutting date at P < 0.05; SE3C = 0.07; SE5C = 0.04; SERG = 0.05
G,H,I,J LSMeans differ between cutting date within method at P < 0.05; SE3C = 0.07; SE5C = 0.04; SERG = 0.05
v,w LSMeans differ between methods within species at P < 0.05; SE3C = 0.09; SE5C = 0.04; SERG = 0.04
V,W,X,Y,Z LSMeans differ between species within method at P < 0.05; SE3C = 0.09; SE5C = 0.04; SERG = 0.04
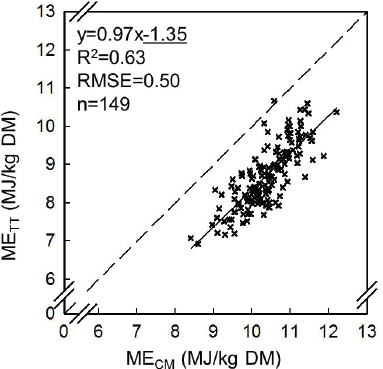
Relationship between ME of several forage legumes estimated by NIRS based on pepsin-cellulase method (MECM) and Tilley and Terry method (METT), respectively. Figures include all data of both study sites and years (if available) as means over field replicates. Bisector shown as dashed line. Underlined regression parameters differ from unity (slope) respective zero (intercept).
Abbildung 1. Zusammenhang zwischen mit NIRS geschätzte ME-Gehalt verschiedener Futterleguminosen, auf Basis von der Pepsin-cellulase-Methode (MECM) bzw. Tilley und Terry-Methode (METT). Die Abbildung zeigt die Daten aus beiden Standorte und Jahre (soweit verfügbar) als Mittelwerte über Feldwiederholungen. Die Winkelhalbierende wird als gestrichelte Linie dargestellt. Unterstrichene Regressionsparameter unterscheiden von Eins (Steigung) bzw. von Null (Achsenabschnitt).
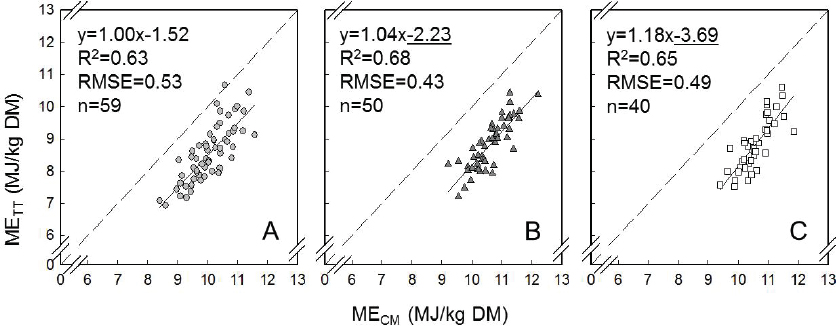
Relationship between ME of several forage legumes estimated by NIRS based on pepsin-cellulase method (MECM) and Tilley and Terry method (METT). Figures include data from both study sites and years as means over field replicates, grouped by defoliation systems: A, 3-cut system; B, 5-cut system; C, rotational grazing. Bisector shown as dashed line. Underlined regression parameters differ from unity (slope) respective zero (intercept).
Abbildung 2. Zusammenhang zwischen mit NIRS geschätzte ME-Gehalt verschiedener Futterleguminosen, auf Basis von der Pepsin-Cellulase-Methode (MECM) bzw. Tilley und Terry-Methode (METT). Die Abbildung zeigt die Daten beider Standorte und Jahre als Mittelwerte über Feldwiederholungen, sortiert nach den Nutzungssysteme: A, 3-Schnittsystem; B, 5-Schnittsysem; C, Umtriebsweide. Die Winkelhalbierende wird als gestrichelte Linie dargestellt. Unterstrichene Regressionsparameter unterscheiden von Eins (Steigung) bzw. von Null (Achsenabschnitt).