

1. Introduction
The petroleum transition as the primary energy source for the transportation sector has been a crucial issue. It is conducted as a response to escalating concerns regarding climate change [1]. Decarbonizing by adopting electric vehicles (EVs) is an environmentally sustainable and practical solution [2]. It is becoming increasingly popular worldwide, heralding a new era of automotive sustainability. Concurrently, initiatives in renewable energy systems are being implemented globally [3]. Hence, the development of EV technology has been massively conducted to result in superior performance.
As a part of EV development, electric two-wheelers (E2Ws), including electric bicycles/electric motorcycles [4], emerge as the preferable alternative for countries such as Indonesia due to the socio-economic conditions and the existing transportation infrastructure. More than 2000 EVs passed the feasibility test in 2020 by the Directorate General of Land Transportation Indonesia, and the E2Ws are the highest unit among others [5]. In addition, the sales of E2Ws are higher than those of other EV types.
The application of E2Ws is intrinsically linked to using batteries as an energy storage medium. Batteries are designed to be rechargeable, necessitating appropriate charging devices [6]. EV charging duration is influenced by battery capacity, charger power, and battery technology, where larger batteries take longer, high-power chargers speed up charging, and charging efficiency depends on the power converter [7]. Choosing a converter topology and a suitable charging method are critical considerations in obtaining an appropriate charging device. The technology selection refers to the power converter topology, which has the capability of converting and conducting power optimally. Various control techniques have been developed to enhance the efficiency and stability of E2Ws DC-DC converters, such as Voltage Mode Control (VMC), Current Mode Control (CMC), PID, Sliding Mode Control (SMC), and Fuzzy Logic Control (FLC)[8].
Converter efficiency is a primary parameter in power conversion systems that measures the ratio between the obtained output power and the input power used. According to [9], high-efficiency converters can reduce power losses and improve the overall performance of the power system. In [10] it was added that converter efficiency is inversely proportional to the total power loss in the converter, making it a key factor in designing optimal electrical power systems. Furthermore, [11] explained that increasing converter efficiency can be achieved by optimizing circuit topology and reducing parasitic resistance in power components. Meanwhile, the most prevalent strategy for recharging batteries has been adopted, which is constant current-constant voltage (CC-CV).
Power converters play a critical role in modifying, controlling, and conditioning electrical power within power systems by adjusting voltage levels. This adjustment can take the form of increasing (boost) or decreasing (buck) voltage or a combination of both (buck-boost) [12]. Recent research, highlighted in [13], introduces a current-fed non-isolated DC-DC converter design that employs fewer switching components and utilizes Zero Voltage Switching (ZVS) and Zero Current Switching (ZCS) techniques to mitigate power losses. This methodology incorporates a Coati-optimized Fractional Order Proportional-Integral-Derivative (FOPID) controller. However, it still encounters challenges, including switch voltage stress and limited adaptability to various battery types, indicating a need for further optimization.
Additionally, [14] presents a bidirectional DC-DC converter utilizing Fractional Order Resonant (FOPR) control in conjunction with ZVS-ZCS techniques. This combination yields high efficiency, reduces power loss, and enhances stability. However, it faces ongoing challenges related to practical implementation and experimental validation. Addressing those shortcomings, previous studies have focused on developing fastcharging strategies, such as [15] proposed design of an electric bike charger based on a CUK converter operating in discontinuous conduction mode (DCM) CC–CV charging solution capable of charging 0-100% SoC of a 48 V, 20 Ah battery 2 hours. However, only batteries with certain specifications can accept DCM conditions. In [16], the design and implementation of a battery charger utilize SoC estimation and FLC charging. However, this method also requires around 1.5 hours to recharge 0-100% of the SoC battery to get the appropriate power for battery charging topology. [17] presents an ANFIS-based charging algorithm to increase charging speed. The complexity of ANFISbased chargers is unreliable to conventional users because they potentially increase the charging price.
Furthermore, available conventional E2W chargers take approximately 2-9 hours to recharge 0-100% of their capacity. It is necessary that the charging time be faster to fulfil the user’s high mobility and be safe and reliable by considering the battery’s charging current capacity. Previous studies, such as in [16–18] have presented a suitable method for fast charging but still need to consider the specifications and capacity of the batteries on the market.
This study introduces a novel intelligent fast charger for E2Ws, utilizing a three-phase interleaved synchronous buck converter (3Phase IBC) for efficient power conversion and rapid, safe charging. The system is controlled by a proportional integral-fuzzy logic control (PI-FLC) algorithm.
2. E2W Charging Architecture
Figure 1 illustrates the selected charger topology suitable for various E2W devices. The selected universal off-board charging topology, as shown in Fig. 2, comprises a linear transformer, AC–DC converter, and DC–DC converter. The three-phase interleaved DC-DC converter is designed in a continuous current mode (CCM) where each switching device phase is shifted to 120° in accordance with the duty cycle dt(s) generated using the fuzzy logic algorithm. For configurations involving a greater number of phases, the phase shift can be accordingly adjusted to 360°/p, where (p) represents the total number of interleaved buck converter phases [18].
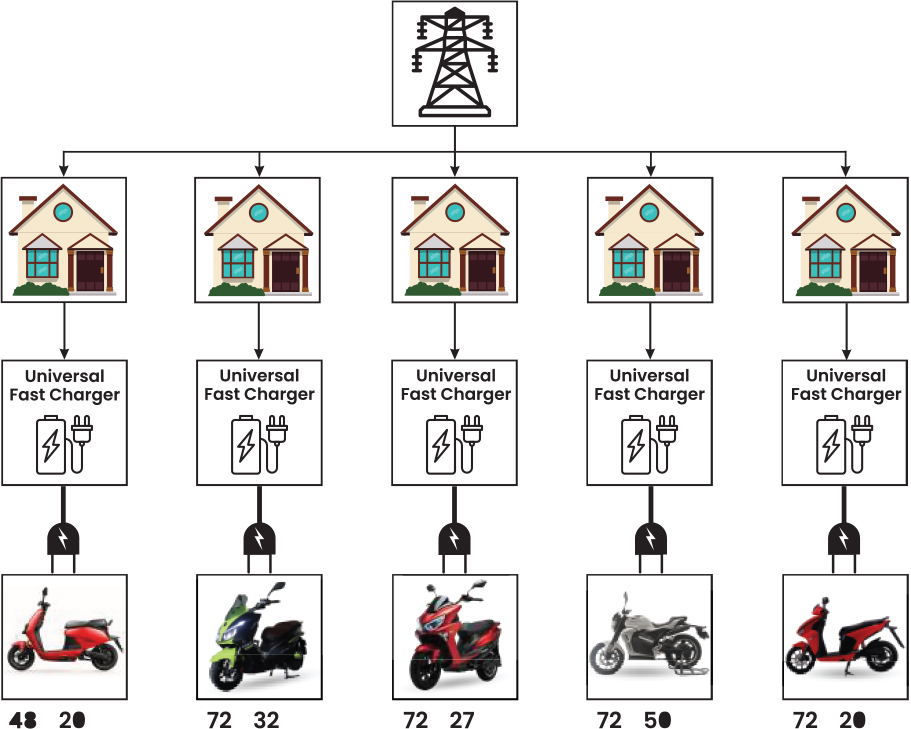
Figure 1.
Charger application
Circuit averaging is performed to replace the switches with their average model. However, in practical conditions, each phase contains two switching devices containing on-state resistance and an inductor with an inductor series with resistance. The equivalent of the series resistance (ESR) in each phase is in Eq. (1) [19,20].
where Rsp is total converter resistance characteristic in each converter phase that consists of switching device resistance Rswp and inductor internal resistance RLp.Eq (1) is assumed as the parasitic capacitor Co resistance is minimal and shared with each phase, which could be neglected. A continuous DC input voltage source supplies IBC to simplify the analysis process. The L1, L2, and L3 values are equal and will be denoted as Ls. Utilizing KCL and looking at Figure 2, the charging current io is described as the total amount of inductor current iL(t) in each phase determined as Eq. (3) for calculating the total amount of current during a period or Eq. 4 to calculate the charging current at a specific time [18,19,21].
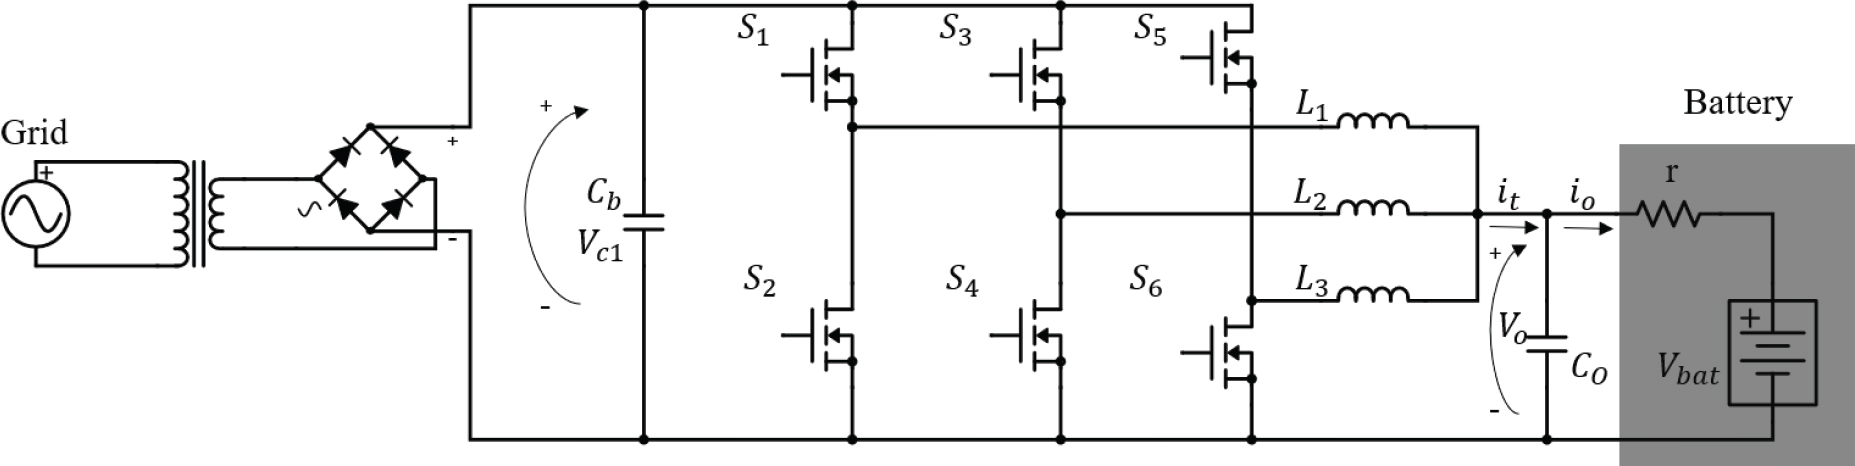
Figure 2.
Proposed charger architecture
Eq. (2) can be derived to prescribe the charging voltage vo as Eq. (4).
where r is the battery’s internal resistance, and Co is the DC–DC output capacitor.Each IBC phase constantly shifted at 120° among itself. The peak output current ripple in a complete span duty cycle for each phase d1(t), d2(t), d3(t)∈[0,1] written as Eq. (5) [22].
Eq (5) is used for the following conditions: , where k = 1, …, p, fsw is frequency switching, VCo is the voltage at the capacitor output filter, and dp (t) represents the duty cycle in one of the converter phases at a given time.
The IBC topology significantly mitigates inductor current ripple through its inherent ripple cancellation feature [23]. Increasing the number of phases within the IBC can effectively decrease the peak value of the current ripple output. Phase segmentation reduces the inductor value within the converter, thereby preventing degradation in the response stability of the converter, which can occur due to the energy charging and discharging cycles in a large inductor [24]. Furthermore, as illustrated in Eq. (6), the theoretical framework indicates that the output current ripple of the IBC can approach zero by augmenting the number of phases. This characteristic is particularly beneficial in designing and implementing high-performance fast charger topologies intended for supplying large currents to batteries. The correlation between the maximum output current ratio and the maximum inductor current ripple within the IBC is quantitatively described in Eq. (6).
where ΔiLdp (t) is the inductor current written as Eq. (7)The proposed IBC topology also incurs power losses in practical conditions, as mentioned in [23].
The power losses in the IBC are derived from the resistance equation in the converter in Eq. (1), represented as Eq. (8).
Where Pc is conduction losses Pc = Irms x RON with IRMS as charging current root mean square (RMS) flowing through the switching device and RON is the switch’s on-state resistance. Psw stands for switching losses Psw = 0.5×VD×io (tdon + tr + tdoff + tf) × fsw with VD as drain voltage, tr as the switching device rise time tdon and tdoff is the time delay during the on and off periods, respectively.
3. Battery Parametric Model
The battery-selected model was initially developed in [25]. A detailed explanation and definition of the battery mathematical modelling can be found in the MATLAB documentation using Eq. (9); the battery open circuit voltage can be measured from the battery equivalent circuit in Figure 2.
Where E0 is the nonlinear voltage input, E0 is the constant voltage input, K is the polarization constant in (V/Ah), Q is the maximum battery capacity (Ah), A is the exponential voltage input, B is the exponential capacity (Ah−1), i* is the low-frequency current dynamic (A), is the battery current A), exp(s) is exponential zone dynamics (V). The SoC, or battery nominal present capacity, is the charge amount. It is 0% when the battery is fully discharged and 100% when fully charged. The Battery SoC in the time (t) is calculated using Eq. (10).
4. The Proposed Intelligent Control
The battery was in charging mode when the battery current exceeded zero (i* < 0), and the battery open circuit voltage, as shown in Eq. (10). To fulfil the proposed fast charging scenario for E2W batteries, the PI-FLC algorithm ensures thatthe system meets different charging standards for each E2W battery.
In contrast with the conventional CC–CV method, which prioritizes rapid charging solely during the 0–80% SoC range. As depicted in Figure 3, this work implements adaptive current profiling charging to mitigate exorbitant charging currents in low SoC (0–20%) and overvoltage risks in high SoC (80–100%). The three-stage charging protocol operates as follows: (a) normal-rate charging (0-0.8 C) at 0–20% SoC to prevent exorbitant charging current from damaging the battery; (b) accelerated charging (0.8-1 C) at 20–80% SoC to minimize the duration; and (c) tapered charging (0-0.5 C) at 80–100% SoC to avoid battery damage due to extensive charging current.
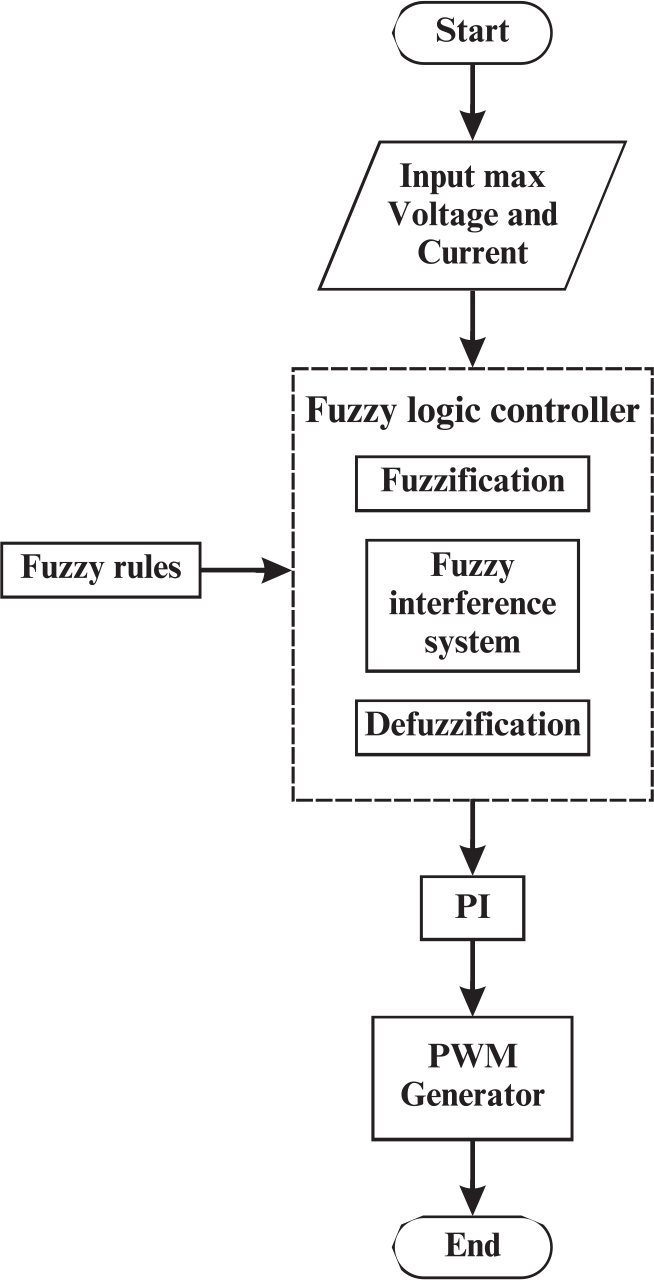
Figure 3.
Charging Algorithm
Figure 4 illustrates the output of FLC, which is a reference C-rate. This C-rate is then multiplied by the battery capacity Iivr to establish the reference charging current value. This reference current is successfully compared with the measured current to generate a current error, which will be the PI control input. The PI control calculates the appropriate duty cycle to achieve the desired reference current and voltage. Furthermore, the PI-FLC hybrid controller dynamically resolves nonlinear battery dynamics by combining Pl-based voltage regulation with FLC-driven multiconstraint optimization.
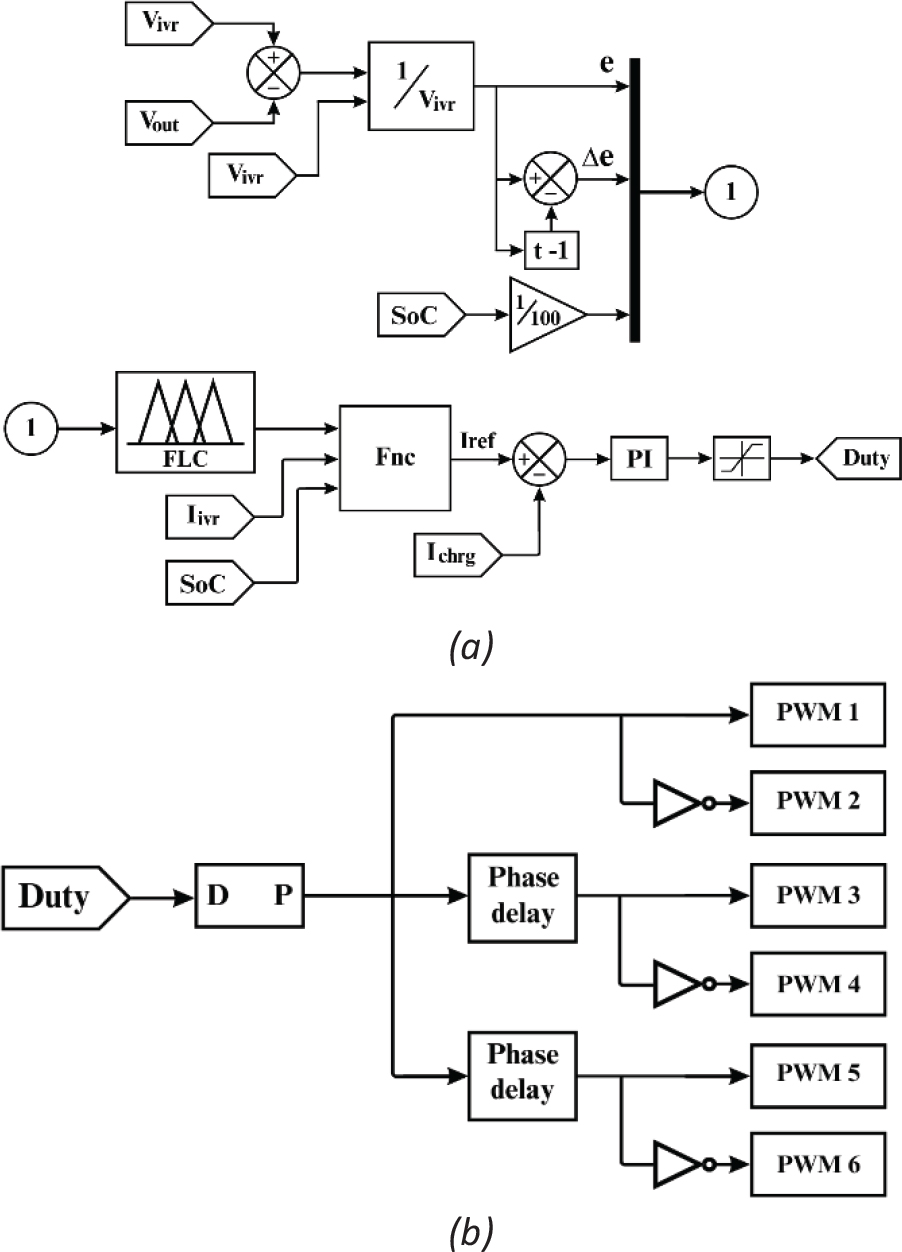
Figure 4.
(a) Charging control block, (b) PWM generator
Charging parameters are fuzzified into membership functions, enabling the FLC to autonomously select charging modes through 75 rule-based decisions. This dual-loop architecture compensates for PI controllers’ inherent limitations in adaptive charging parameters under battery nonlinear characteristics.
The PI controller used in the proposed method is conventional PI, where PI = KP + KI1/s which is designed to obtain a monotonic response. In particular, the values of Kp = 0.75 and KI = 50, respectively, and the PI output is limited with the saturation value of 0-0,97. As depicted in Figure 5, the FLC algorithm had three membership inputs membership function: error voltage described as μe = (Vivr – Vo)/Vivr ∈ [– 1 1] where Vivr is the battery voltage set point at charging mode, delta error is differential between measured μe and μe att-1 described as μΔe = μe – μe(t – 1)∈ [–1 1], and battery SoC is described as μsoc = SoC(t)/100) ∈ [0 1] fuzzy membership output is the reference C-rate μiivr ∈ [0 1].
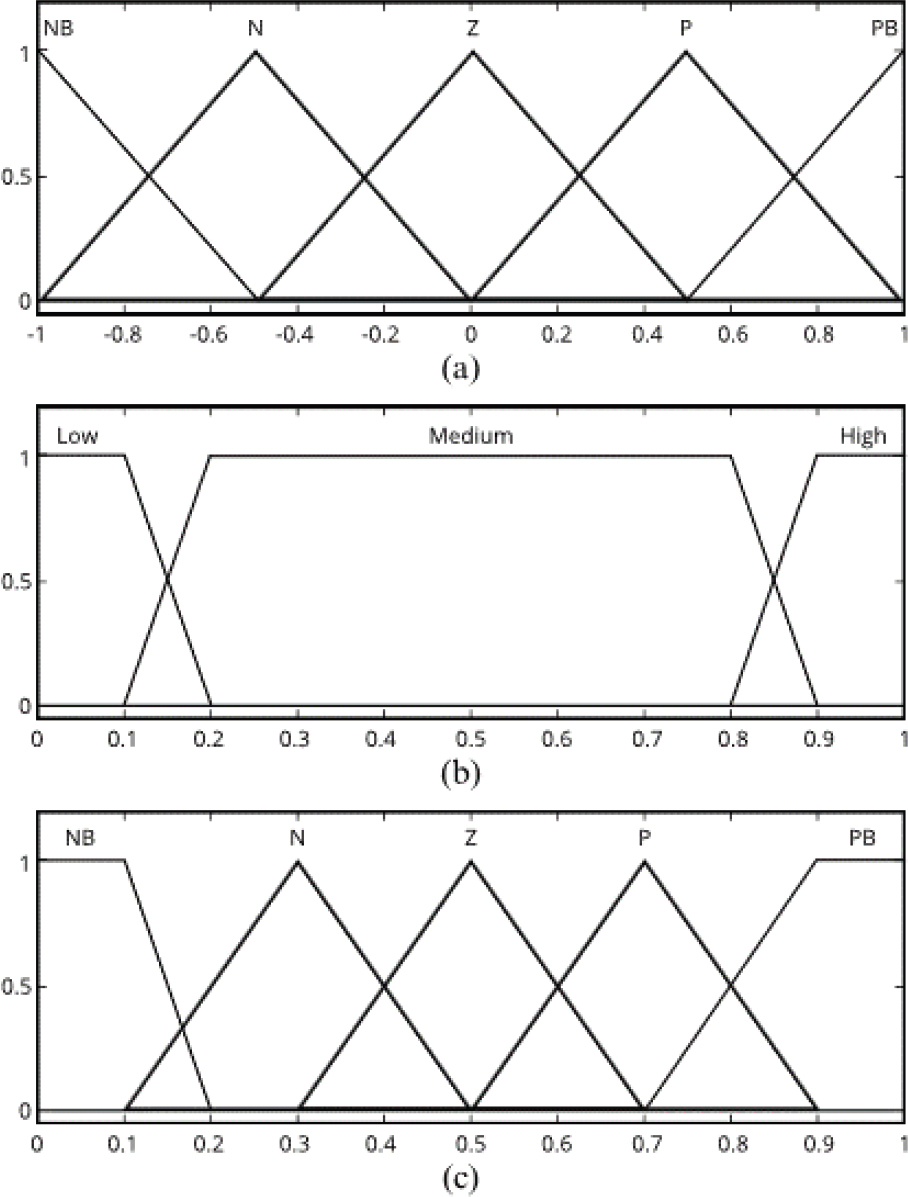
Figure 5.
Fuzzy membership function (a) input error and Δerror, (b) input SoC, (c) Output
Table 1 illustrates the normal rate charging conditions in which the current and voltage rise exponentially toward the battery charging voltage and maximum charging capacity. Table 2 illustrates the accelerated charging condition securing the maximum charging current and voltage. Table 3 illustrates the tapered charging condition where the current drops slowly from the maximum charging current to zero when the battery SoC reaches 100% and maintains the set point charging voltage.
Table 1.
The fuzzy rule for low SoC level
| SoC: Low | error | |||||
|---|---|---|---|---|---|---|
| NB | N | Z | P | PB | ||
| Δ error | NB | Z | Z | Z | Z | Z |
| N | Z | N | N | Z | P | |
| Z | Z | Z | Z | P | PB | |
| P | Z | Z | P | PB | PB | |
| PB | Z | P | PB | PB | PB | |
5. Results and Discussion
The proposed system was validated using MAT-LAB/Simulink and simulated based on the charger parameters outlined in Table 4. Furthermore, thr proposed charging topology has also been validated by hardware implementation.
Table 4.
The charger simulation parameters
| Parameter | Value |
|---|---|
| RMS Input Voltage | 220-230V 50Hz (AC) |
| AC Transformator | 1:2 |
| Rectifier | 2 kW |
| Switching device | MOSFET N-type Rd = 0.01 Ω Rs = 1e5 Ω |
| Inductor Ls | 1e-3H |
| Capacitor output CO | 200e-6F |
| Voltage output Vo | 48-84V |
| Output current io | 0-20A |
5.1. Simulation Implementa tion Result
The proposed system was developed using MATLAB/Simulink, incorporating charger parameters delineated in Table 4. A nickel-manganese-cobalt (NMC) battery [25], configured in a 20s8p topology (nominal voltage of 72 V and a capacity of 20.4 Ah), was utilized for testing purposes. Comparative analyses were conducted against the PID CC-CV and PI CC algorithms. These assessments evaluated charging current and voltage dynamics, transient response, and total charging duration to ensure a rigorous and unbiased performance validation.
Figure 6 demonstrates the transient voltage response to an 84 V setpoint. The proposed method effectively achieves voltage stabilization within 1.25 ms, exhibiting a response time twice as rapid as the PID CC-CV algorithm, which stabilizes at 2.5 ms. In contrast, the PI-CV method fails to reach convergence, displaying a steady-state error of 2.3%. These results underscore the superior transient response of the proposed method.
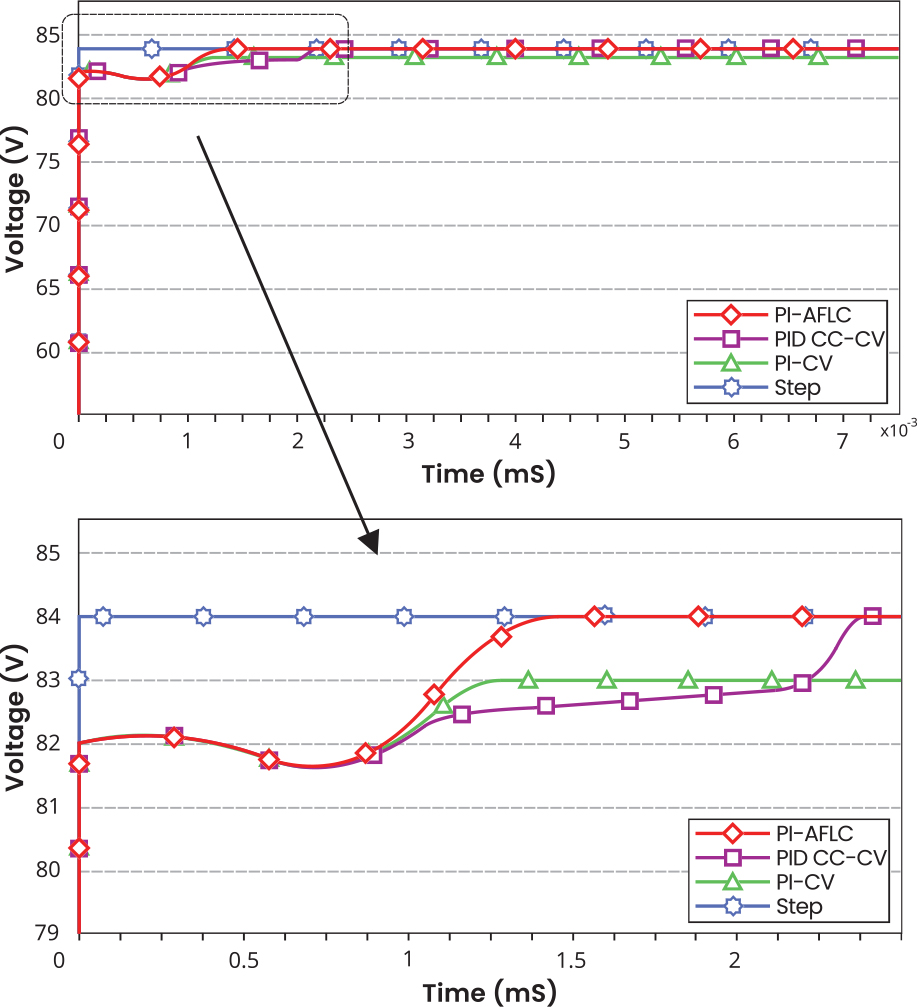
Figure 6.
The comparison of charging voltage characteristics
Table 5 illustrates that the current regulation performance across the entire SoC range is quantitatively assessed. The proposed system maintains a current deviation of ±4 A at 20% SoC while operating at a 1 Crate (20.4 A) during the accelerated charging phase. Furthermore, the current throttling rate is 0-0.8 C-rate and 0-0.5 C-rate at 0% and 80% SoC, respectively. As depicted in Figure 7, the proposed method effectively mitigates risks associated with battery thermal run and cell damage. The system achieves current tapering to 0 A at 100% SoC.
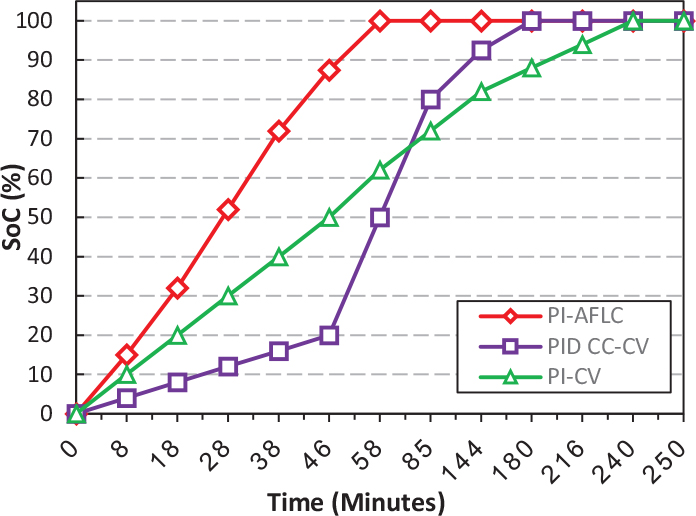
Figure 7.
Charging time performance
Table 5.
The charging current characteristics of the proposed algorithm
| SoC (%) | Peak Current (A) | Average Charging Current (A) | C-Rate | Charging Voltage (V) |
|---|---|---|---|---|
| 0 | 13 | 10 | 0.5 | 84 |
| 20 | 24 | 20 | 1 | 84 |
| 40 | 23 | 20 | 1 | 84 |
| 60 | 22 | 20 | 1 | 84 |
| 80 | 15 | 10 | 0.5 | 84 |
| 100 | 0 | 0 | 0 | 84 |
Charging time comparisons presented in Figure 7 reveal that the PI-FLC algorithm accomplishes a 0 to 100% SoC charging duration of 57.75 minutes. This achievement represents a significant reduction of 67.9% and 75.9% compared to the PID CC-CV (180 min) and PI-CV (240 min) methods, respectively. The performance of the proposed system exceeds that of traditional PID CC-CV chargers currently implemented in commercial E2W systems [26], thus demonstrating its viability for industrial applications.
5.2. Hardware Implementation Result
The proposed hardware implementation of the 3Phase IBC-based charger was developed to validate theoretical performance metrics and demonstrate practical applicability for E2W systems. The experimental setup encompasses modular architecture featuring an AC-DC rectification stage, a 3Phase IBC, precision sensing modules for real-time voltage and current monitoring, and a microcontroller unit (MCU) executing a hybrid PI-FLC algorithm. Operating from a standard 220-230 V AC (50 Hz) input, the system rectifies to a 30 V DC bus and delivers a regulated 21 V DC output to charge a 5-series, 1-parallel (5S1P) lithium-ion battery array.
The experimental setup is illustrated in Figure 8. The hardware parameters outlined in Table 6 demonstrate an input power of 12 W (30 V, 0.4 A), yielding an output of 11.85 W (21 V, 0.564 A) and achieving an exceptional efficiency of 98.8%. This performance is attributed to the low on-resistance of the MOSFETs, high-frequency operation at 30 kHz, minimizing core losses in the 60 μH inductor, and reduced ripple current enabled by the 100 μF output capacitor.
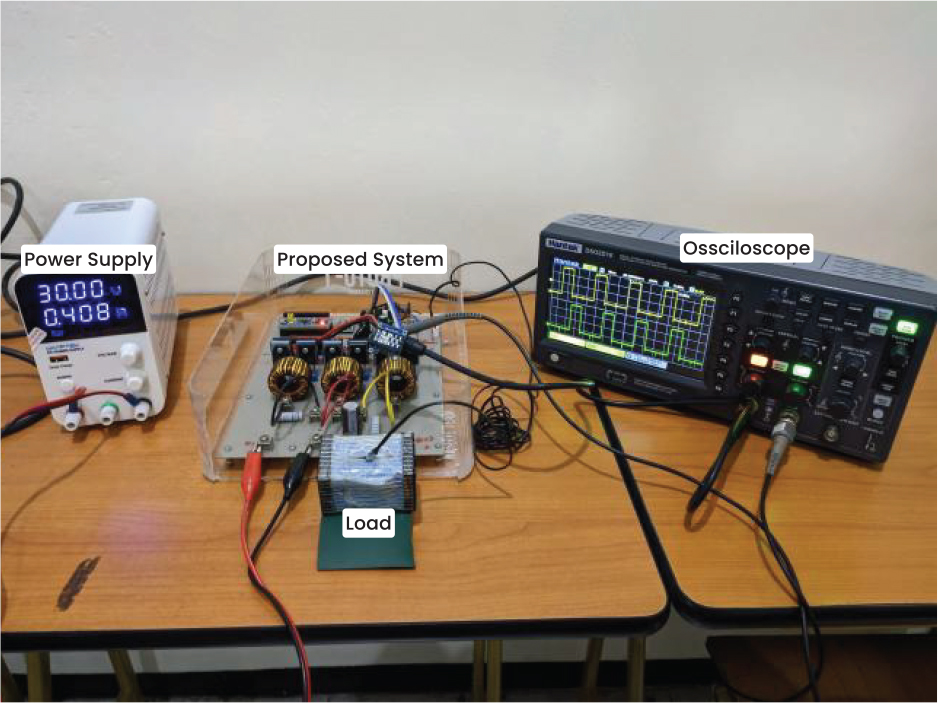
Figure 8.
Hardware experimental setup
Table 6.
The charger hardware implementation parameters
| Parameter | Value |
|---|---|
| RMS Input Voltage | 220-230V 50Hz (AC) |
| Voltage Input | 30 V |
| Current Input | 0.4 A |
| Power Input | 12 W |
| Voltage Output | 21 V |
| Current Output | 0.564 A |
| Output Capacitor | 100 uF |
| Inductor | 60 uH |
| Switching Device | MOSFET |
| Switching Frequency | 30 kHz |
| Battery Array | 5 series 1 parallel |
| Power Output | 11.85 W |
| Charger Efficiency | 98.8 % |
Figure 9 provides a granular view of hardware realization, highlighting the three-phase interleaved PWM signals generated by the MCU. The interleaved operation at 30 kHz ensures continuous input current, minimizes input/output voltage ripple, and distributes thermal stress evenly across the three phases. This configuration enhances power density and mitigates electromagnetic interference (EMI). The stable PWM waveform alignment with the control algorithm’s dynamic adjustments confirms the robustness of the PI-FLC in adapting to real-time battery SoC and voltage fluctuations.
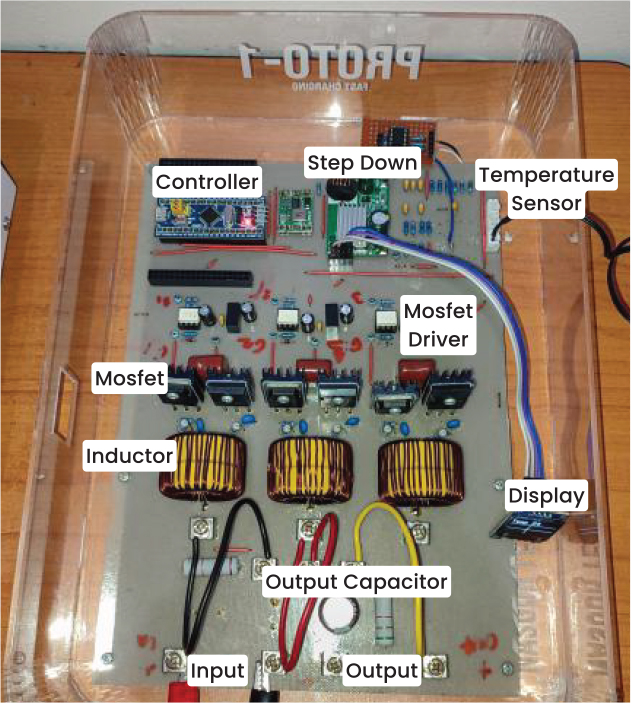
Figure 9.
Hardware implementation of the proposed charging topology
Figure 10 depicts the steady-state input voltage waveform, which remains consistently regulated at 30 V DC despite variations in load conditions. This stability is critical for maintaining the integrity of the AC-DC rectification stage and ensuring reliable power delivery to the IBC. Meanwhile, Figure 11 illustrates the output voltage waveform, showcasing the charger’s ability to maintain a precise 21 V DC under dynamic loading. Notably, the absence of significant overshoot or oscillations during transient responses validates the hybrid PI-FLC algorithm’s effectiveness in enforcing tight voltage and current thresholds, even during rapid SoC changes. The interleaved architecture and optimized LC filter achieve minimal voltage ripple at the output.
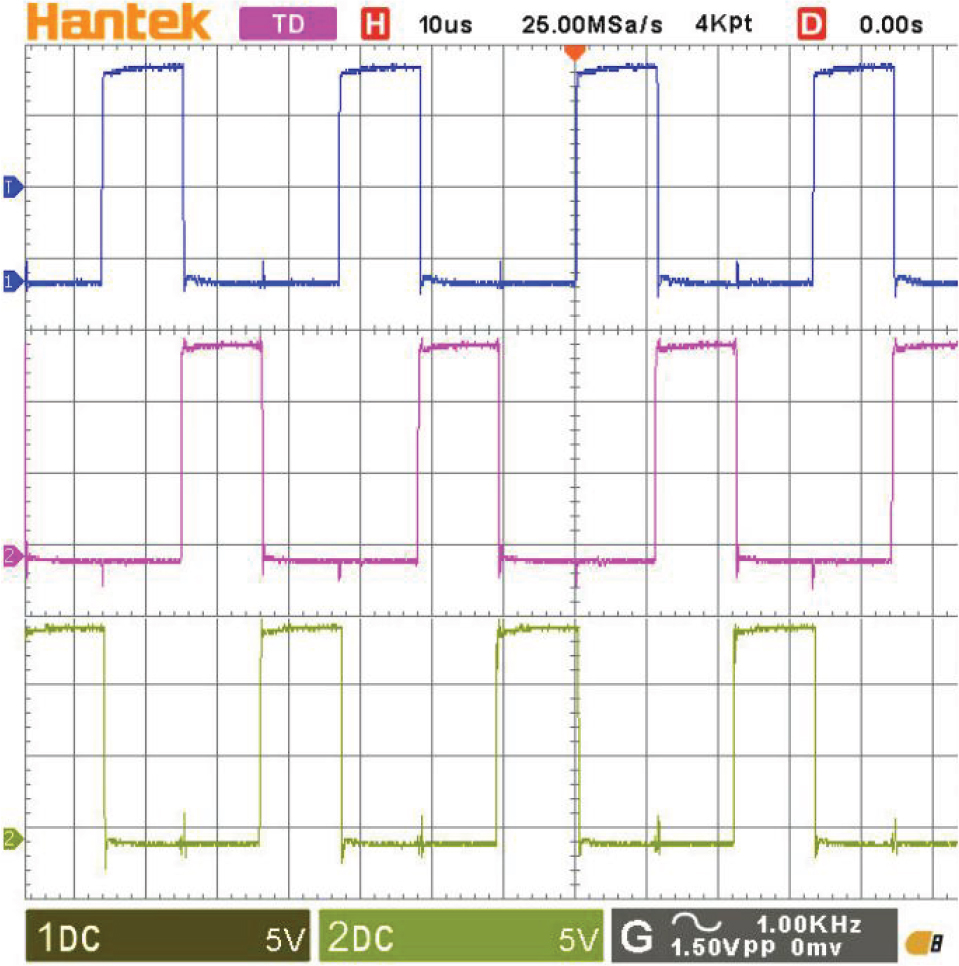
Figure 10.
Three phases interleaved PWM signal result 3OKhz
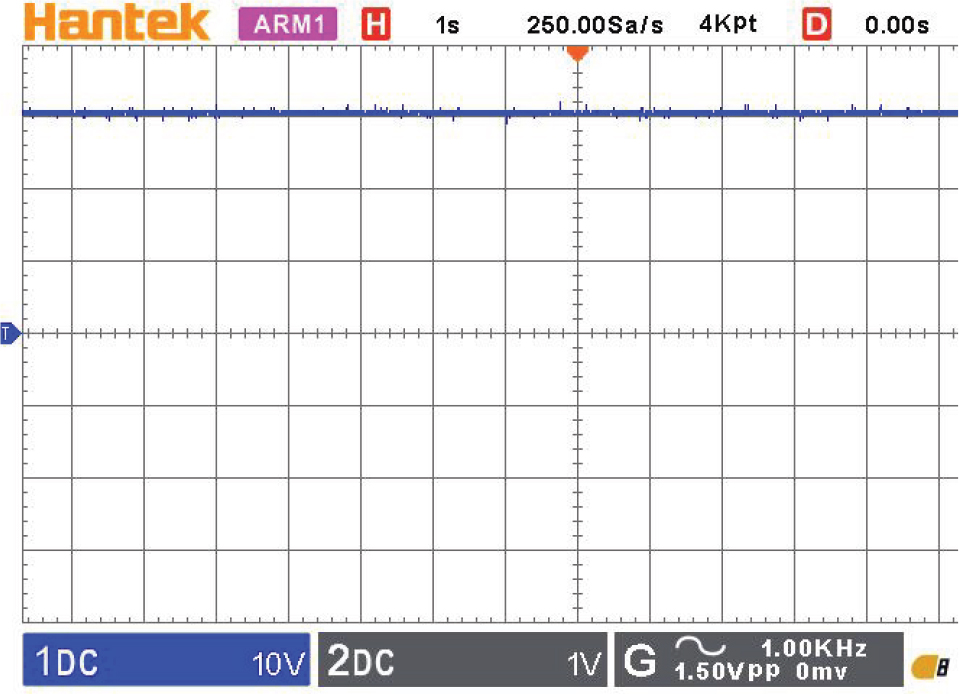
Figure 11.
Charger input voltage
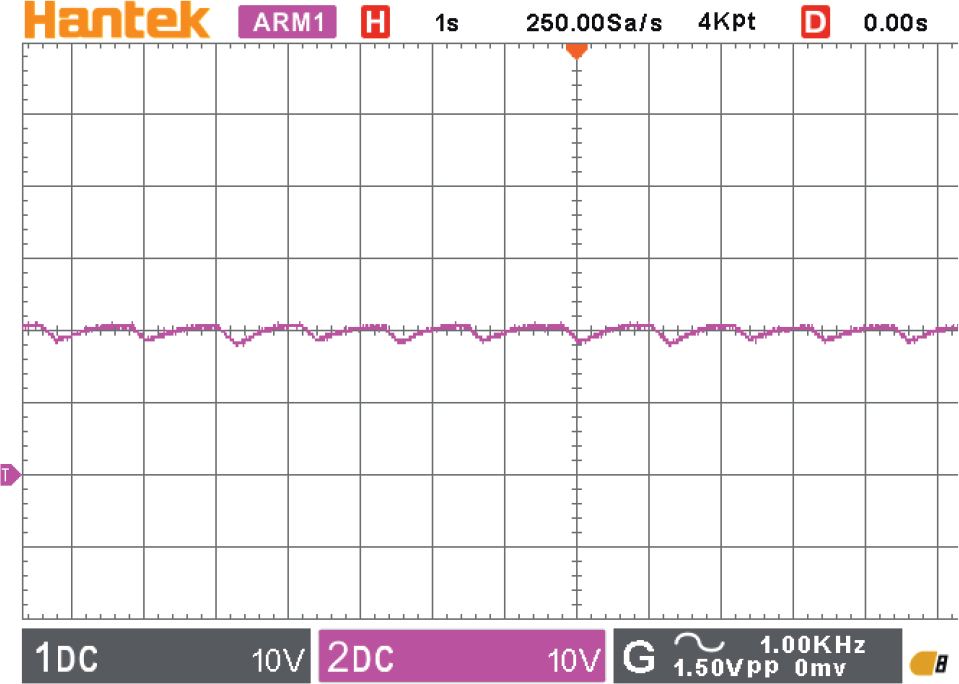
Figure 12.
Charger output voltage
Charging efficiency (η) and charging time (t) are critical metrics in EV charging systems. Efficiency quantifies power conversion effectiveness while charging time reflects the system’s ability to deliver energy rapidly. This study compares recent converter topologies and control algorithms, proposing a novel 3-phase IBC with PI-FLC for enhanced performance. The charging efficiency is described in (11)
Where PChrg is the charging power and Pin is the charger input power. Charging time from 0% to 100% SoC depends on battery energy capacity (Ebat) and effective charging power (Pchrg × η) mathematically modelled as (12).
Eq. (11) and (12) are then used to calculate the efficiency and charging speed of the charger in various previous methods which are then included in Table 7. This table presents a comparison between the previous charging methods and the proposed method, proving the efficacy of the proposed method.
Table 7.
Comparison between the proposed method and previous methods
| Ref. | Year | Converter Type | Algorithm | Efficiency (%) | Charging Time 0-100% SoC (min) |
|---|---|---|---|---|---|
| [27] | 2012 | Boost | Neural Network | 97.8 | 85 |
| [28] | 2018 | Flyback | PSO | 94.2 | 100 |
| [29] | 2019 | Quasi-Resonant | Hysteresis Control | 97.5 | 70 |
| [15] | 2020 | Cuk | DCM | - | 120 |
| [30] | 2020 | Buck-Boost | FLC | 95.5 | 90 |
| [31] | 2021 | SEPIC | PID | 92.3 | 110 |
| [32] | 2022 | Interleaved Boost | FLC | 98.5 | 65 |
| [17] | 2023 | Buck | ANFIS | - | 175 |
| [33] | 2023 | Zeta | Sliding Mode Control | 98.1 | 80 |
| [34] | 2024 | LLC | GA | 96.7 | 95 |
| [35] | 2024 | Dual Active Bridge | MPC | 97.9 | 75 |
| Proposed | 2025 | 3-Phase IBC | PI-FLC | 98.8 | 57.75 |
Table 7 compares various power converters and control algorithms in EV charging systems from 2020 to 2025. Various converters from previous studies were compared to evaluate their performance in charging batteries. The use of diverse algorithms resulted in variations in charging efficiency. The battery specifications are sometimes different, by calculating the charging time using Eq. (12), although each algorithm is tested using different battery specifications, Eq. 12 will provide the same charging time value according to the performance and capacity of the charger. Efficiency ranges from 92.3% to 98.8%, with charging times between 65 and 175 minutes. The leading model for 2025, the 3-Phase Interleaved Boost Converter (IBC) with PI-FLC, achieves 98.8% efficiency and the fastest charging time of 57.75 minutes, demonstrating the advantages of the interleaved topology with PI-FLC.
6. Conclusion
The proposed high-performance fast charger for E2W, utilizing a 3 Phase IBC controlled with PI-FLC algorithm, significantly enhances charging efficiency and speed. The PI-FLC optimizes charging current and voltage dynamically by integrating real-time battery current, voltage, and SoC data. Achieving fast charging of 57.75 minutes for a 72 V 20 Ah NMC battery, this system demonstrates a 67.9% and 75.9% reduction in charging time compared to PID CC-CV (180 min) and PI-CV (240 min), respectively Moreover, the proposed method outperforms several cutting-edge charging methods, such as a Zeta converter with SMC with 98.1% efficiency and 80 min charging time, QuasiResonant converters with hysteresis control with 97.5% efficiency and 70 min charging time, Interleaved Boost with FLC 98.5% efficiency and 65 min charging time, and Dual Active Bridge with MPC 97.9% efficiency and 75 min charging time. The hardware implementation demonstrated 98.8% efficiency during testing at a 0.22 C rate. The 3-phase IBC topology minimizes output current ripple and EMI, while the adaptable PI-FLC algorithm prevents overcharging by precisely regulating voltage and current. By addressing the balance between rapid charging requirements and battery longevity, this innovation presents a scalable, effective, and safe solution for the evolving demands of the E2W ecosystem, ultimately contributing to the sustainability of electric mobility.