

Figure 1.
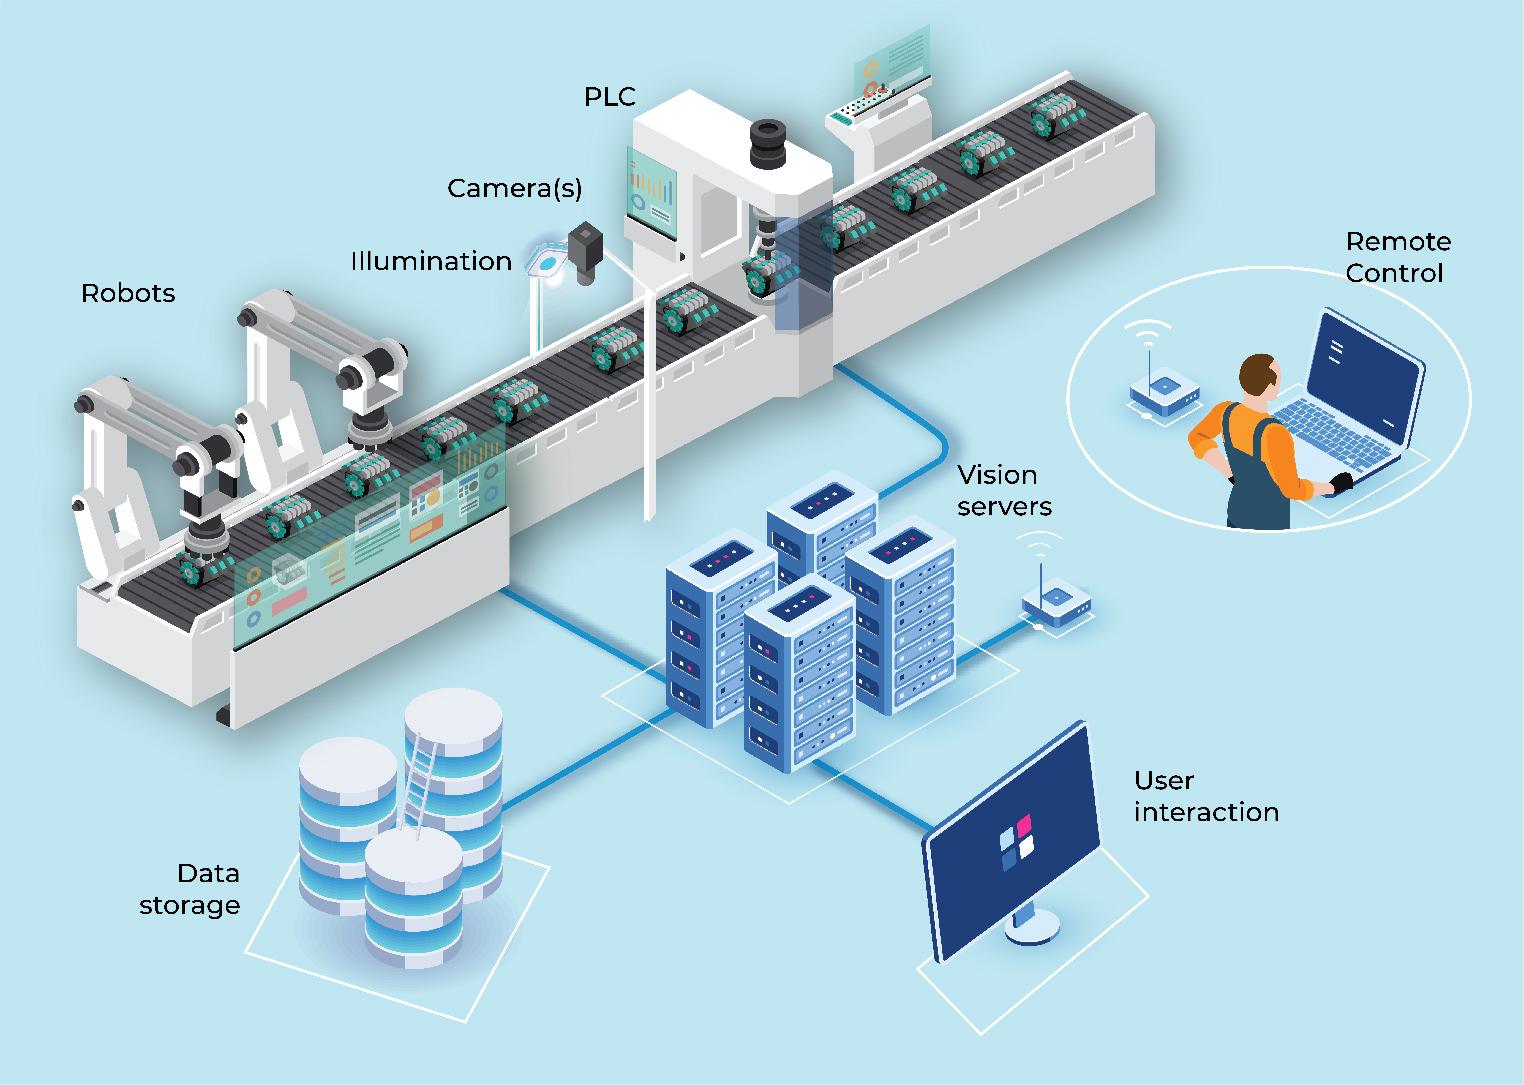
Figure 2.
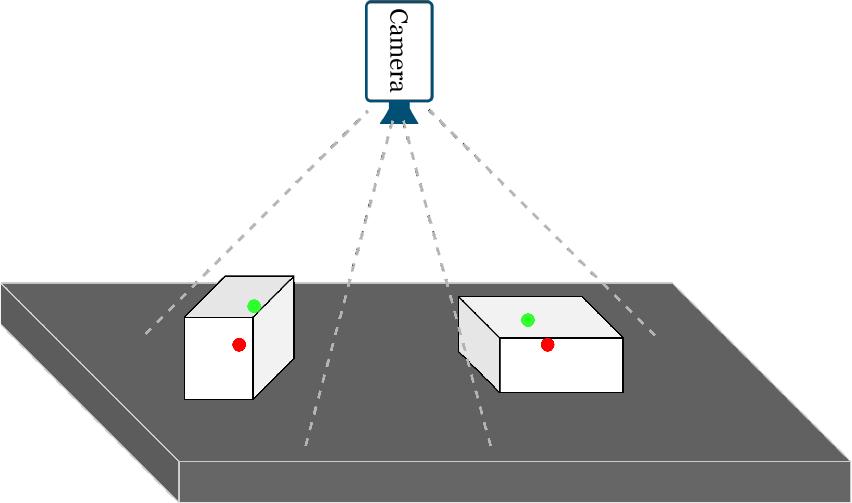
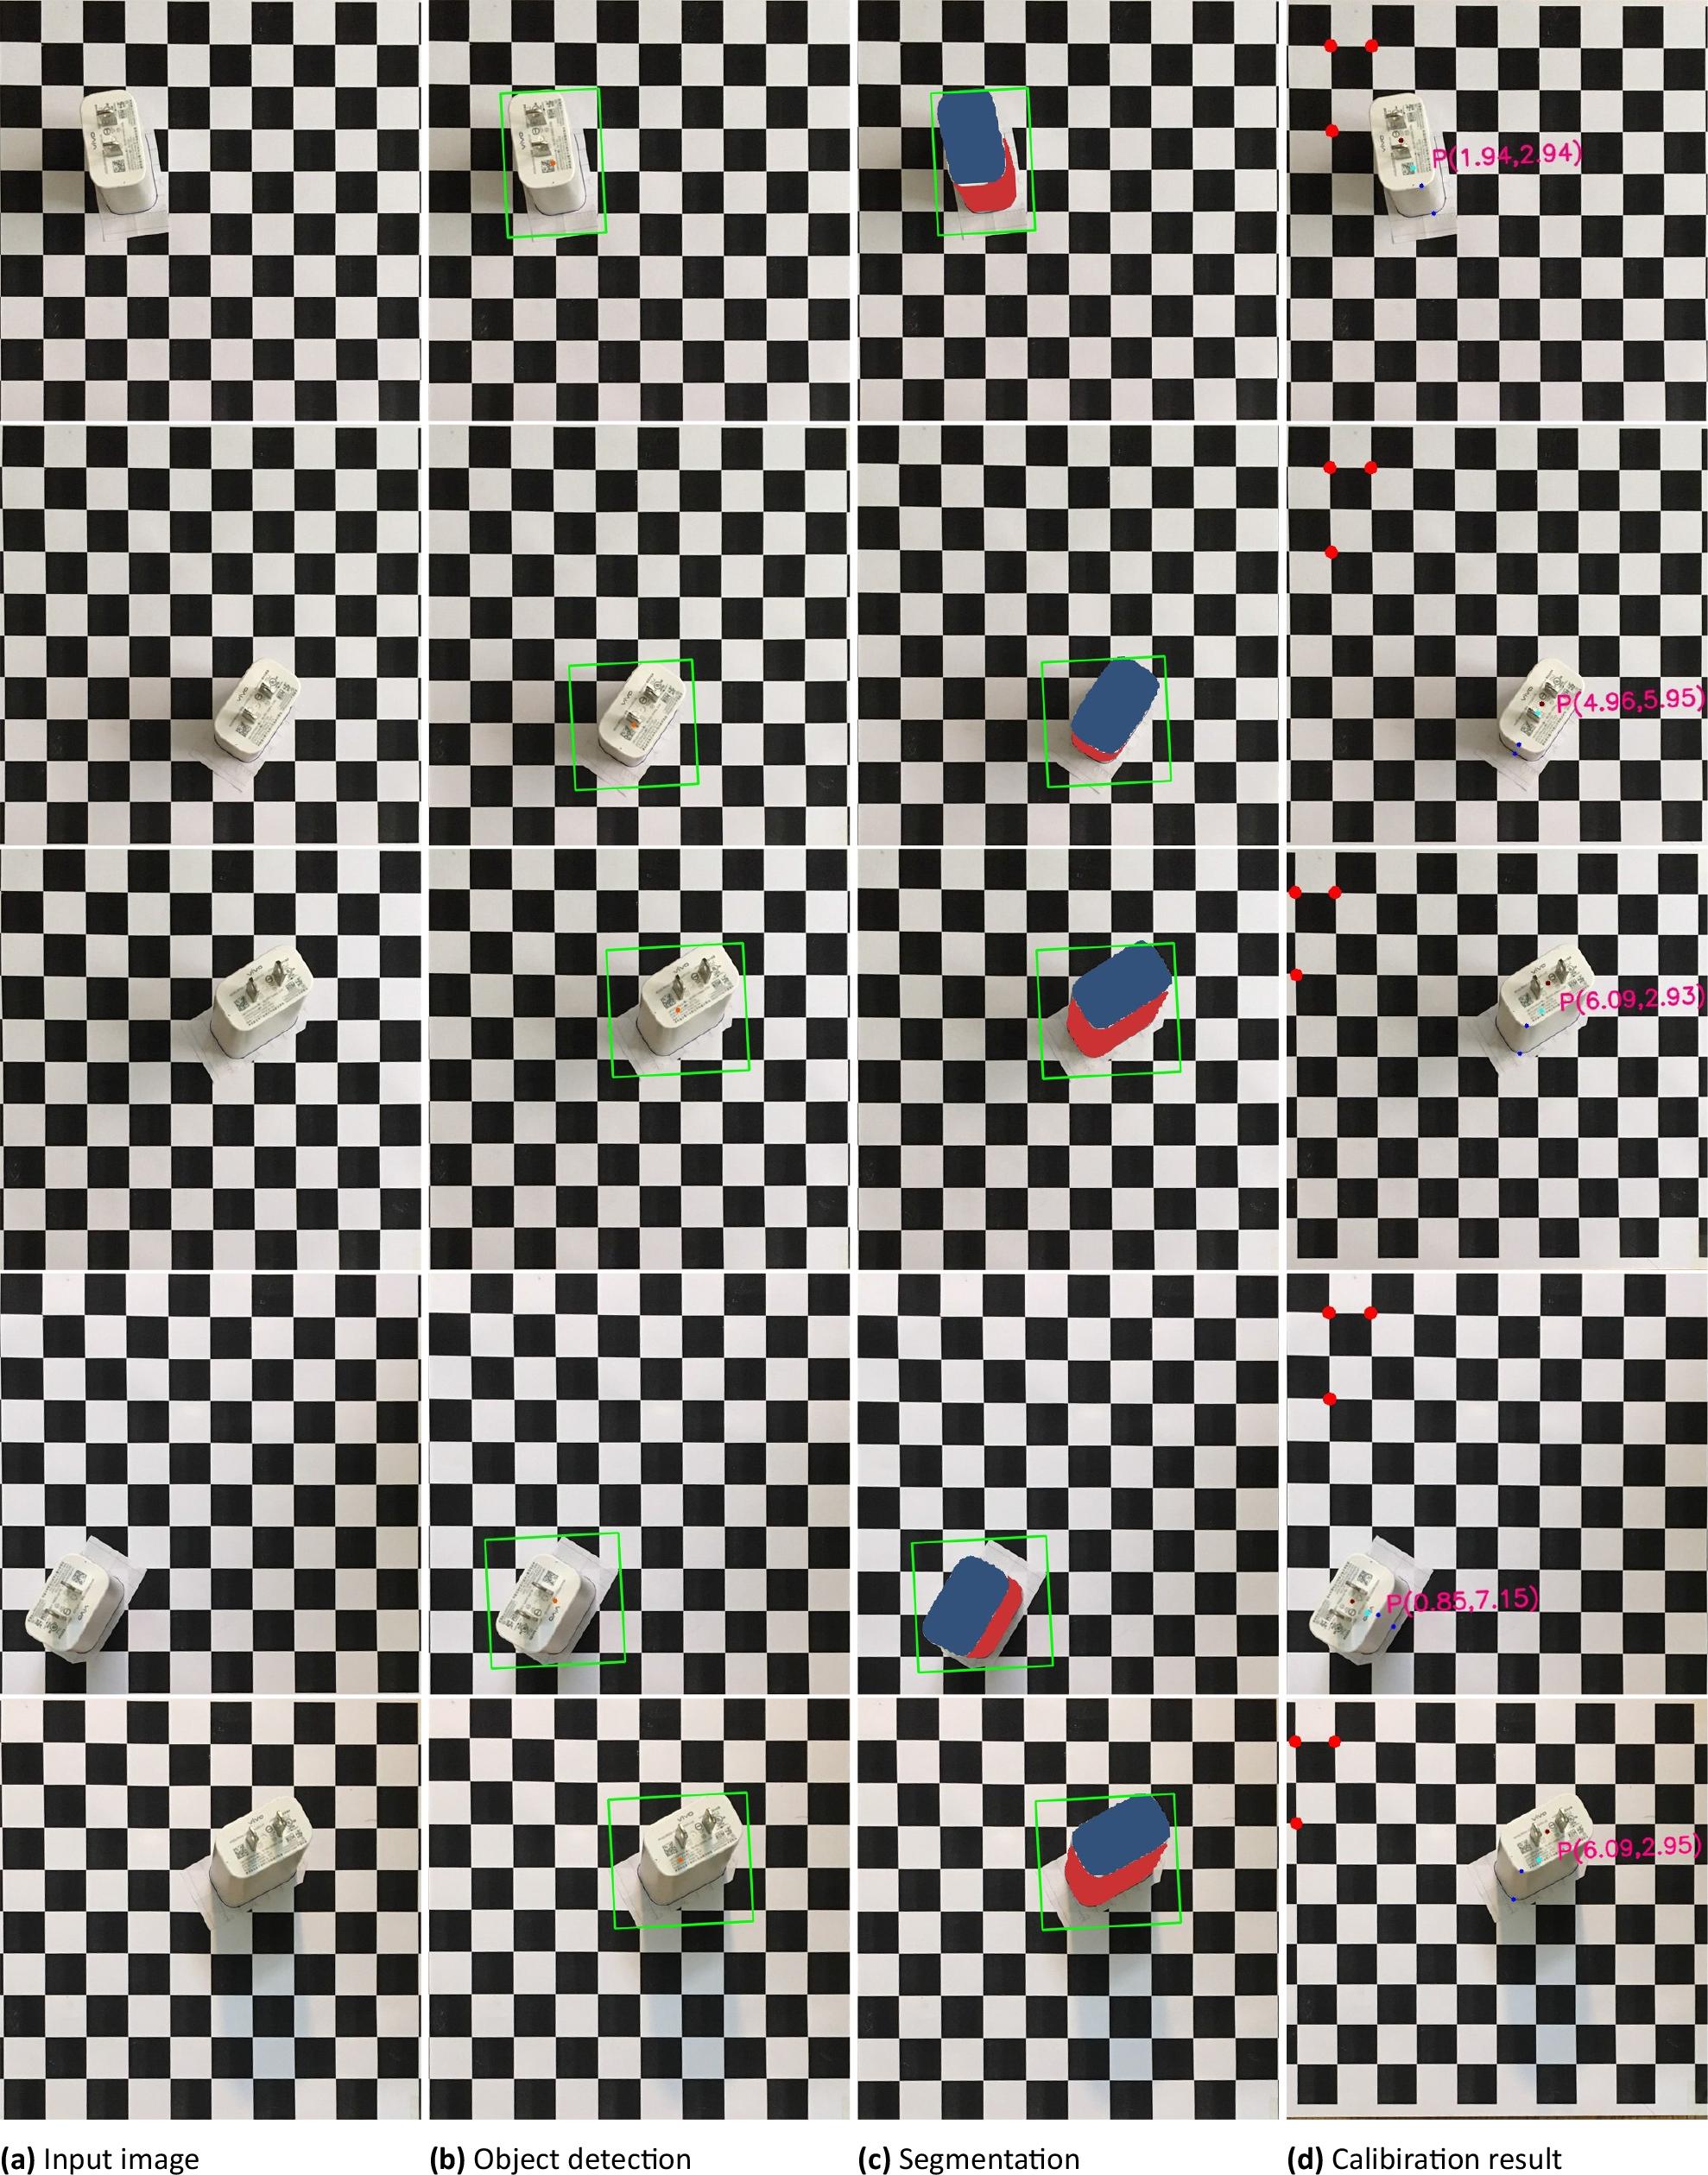
Figure 3.
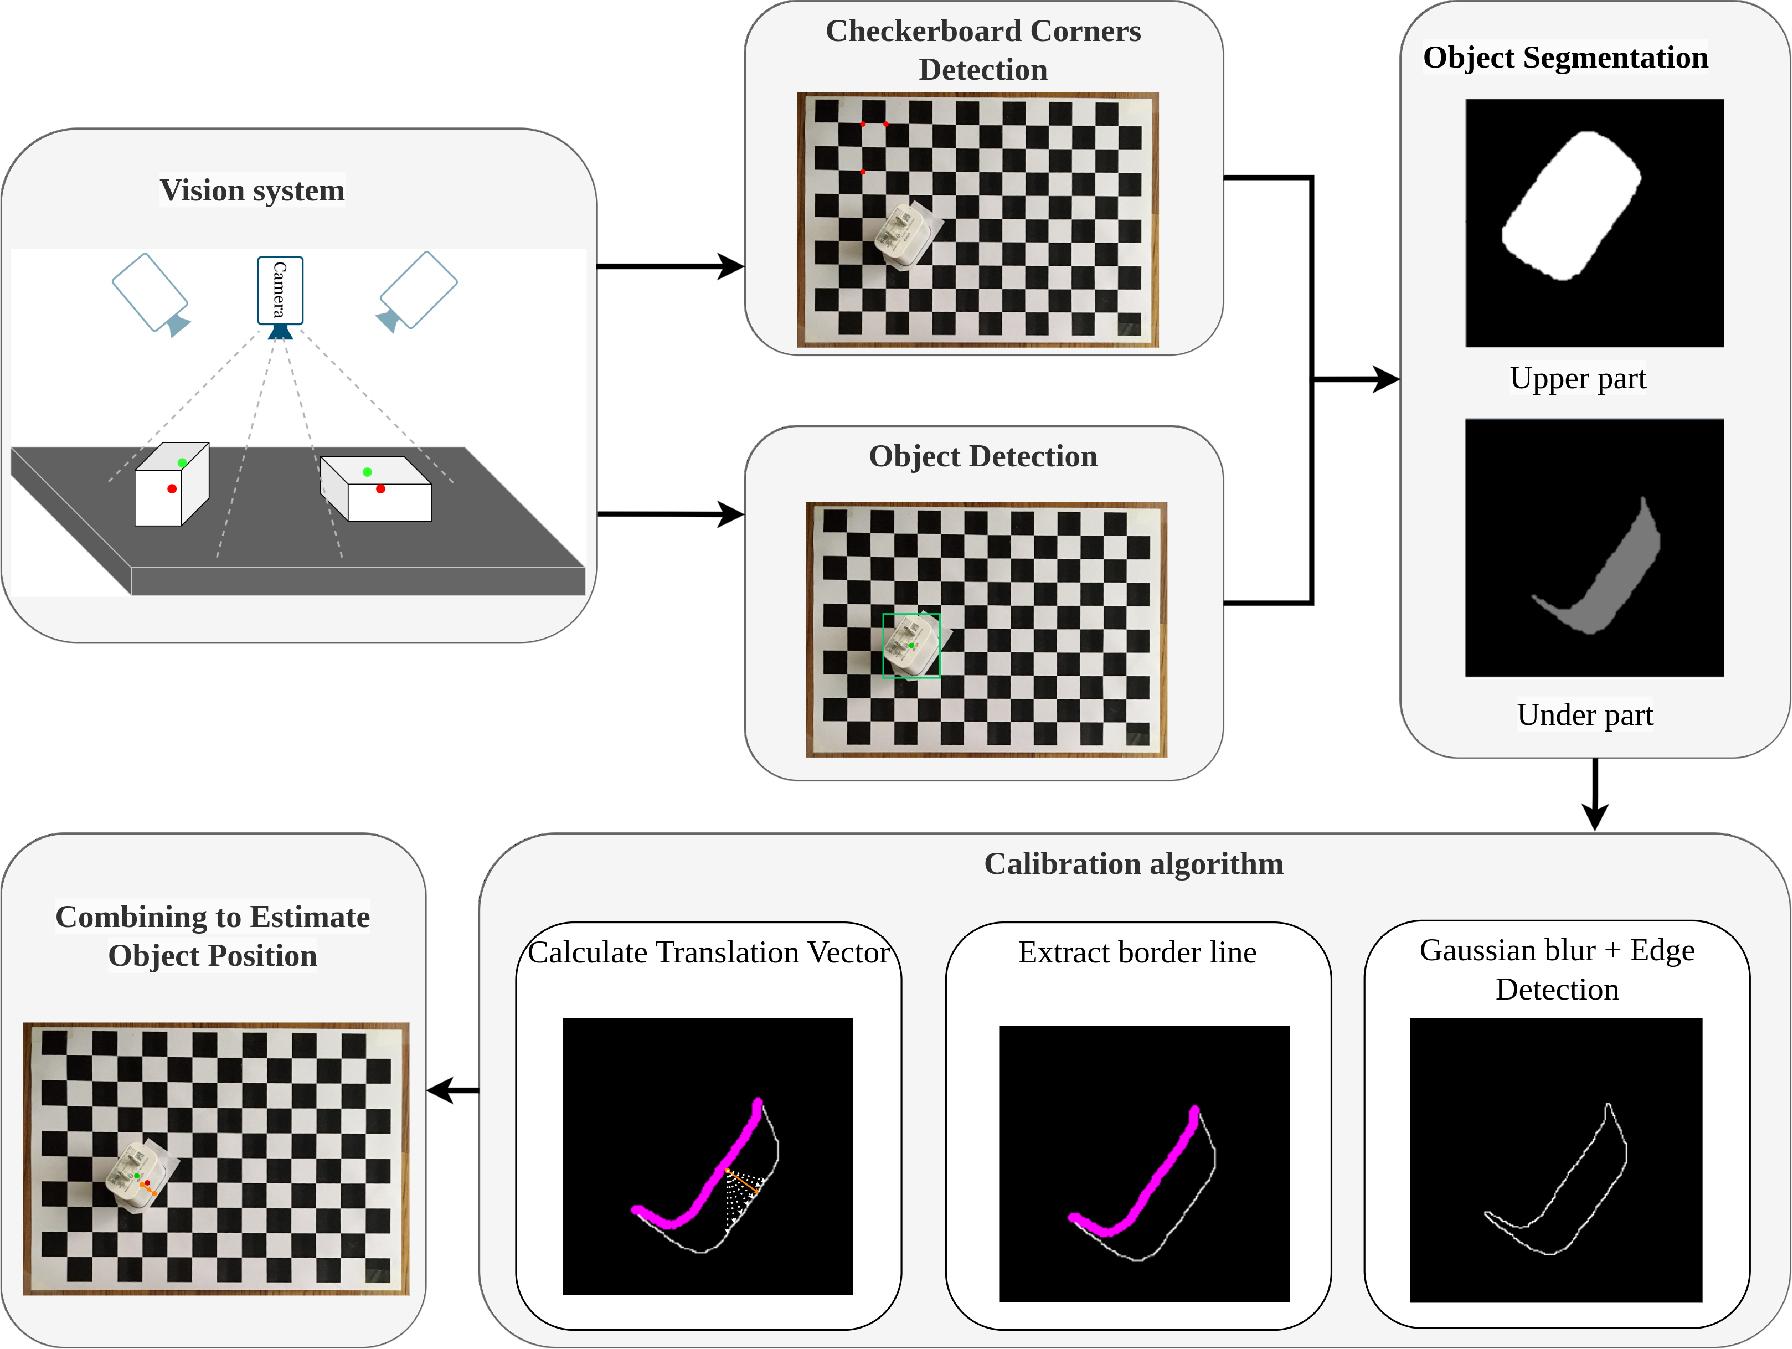
Figure 4.
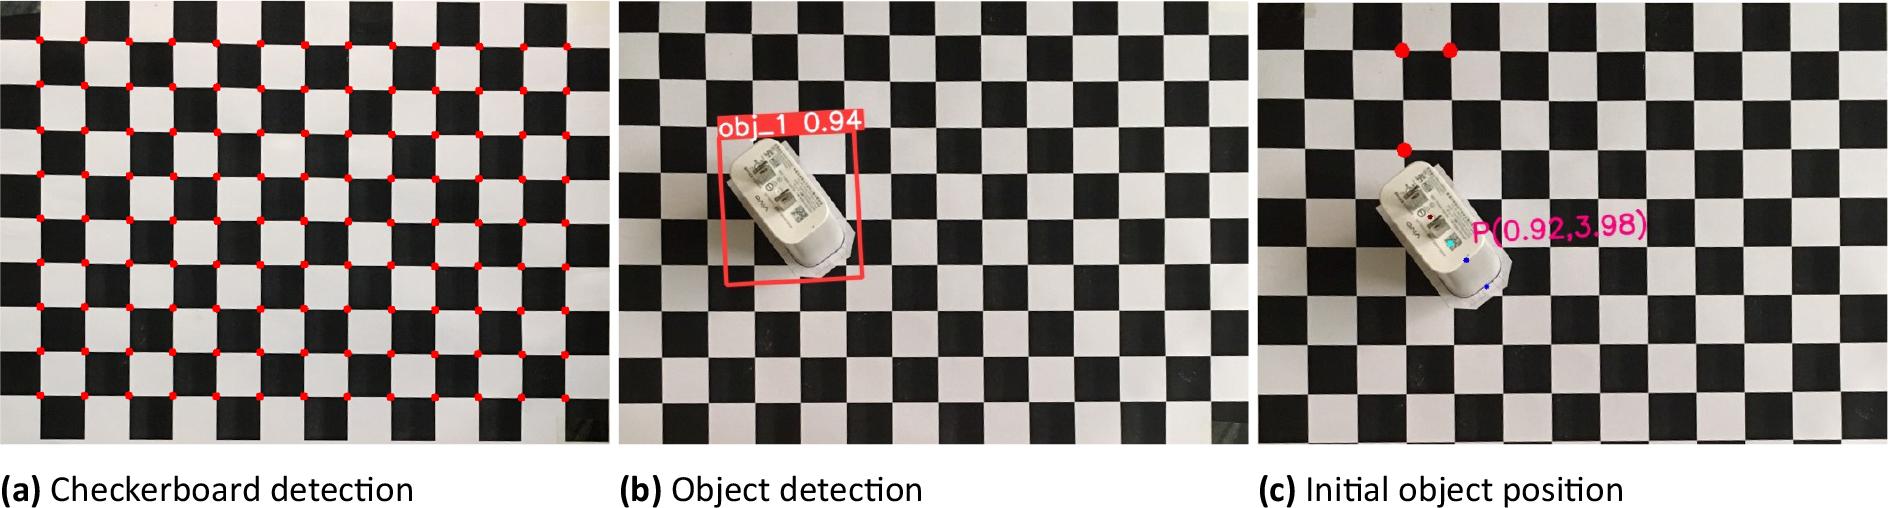
Figure 5.
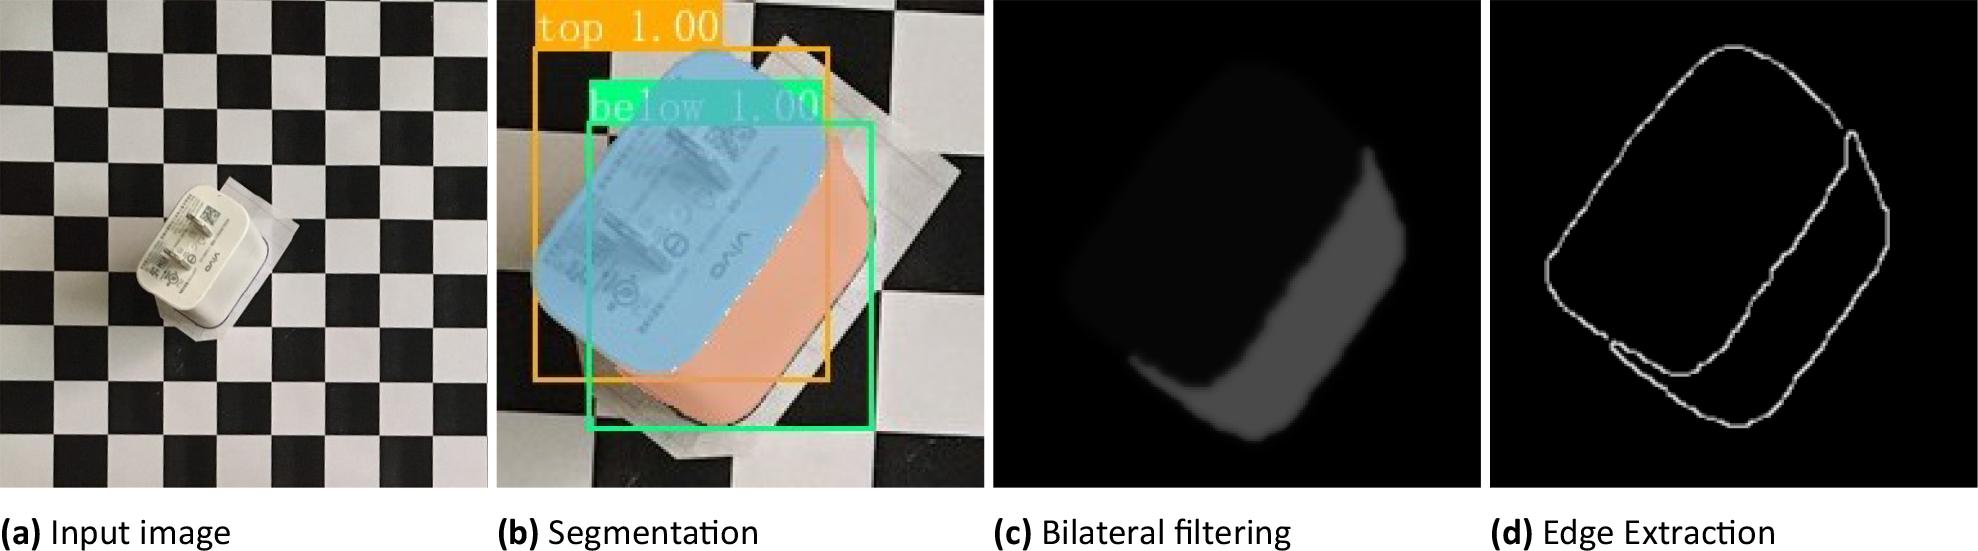
Figure 6.
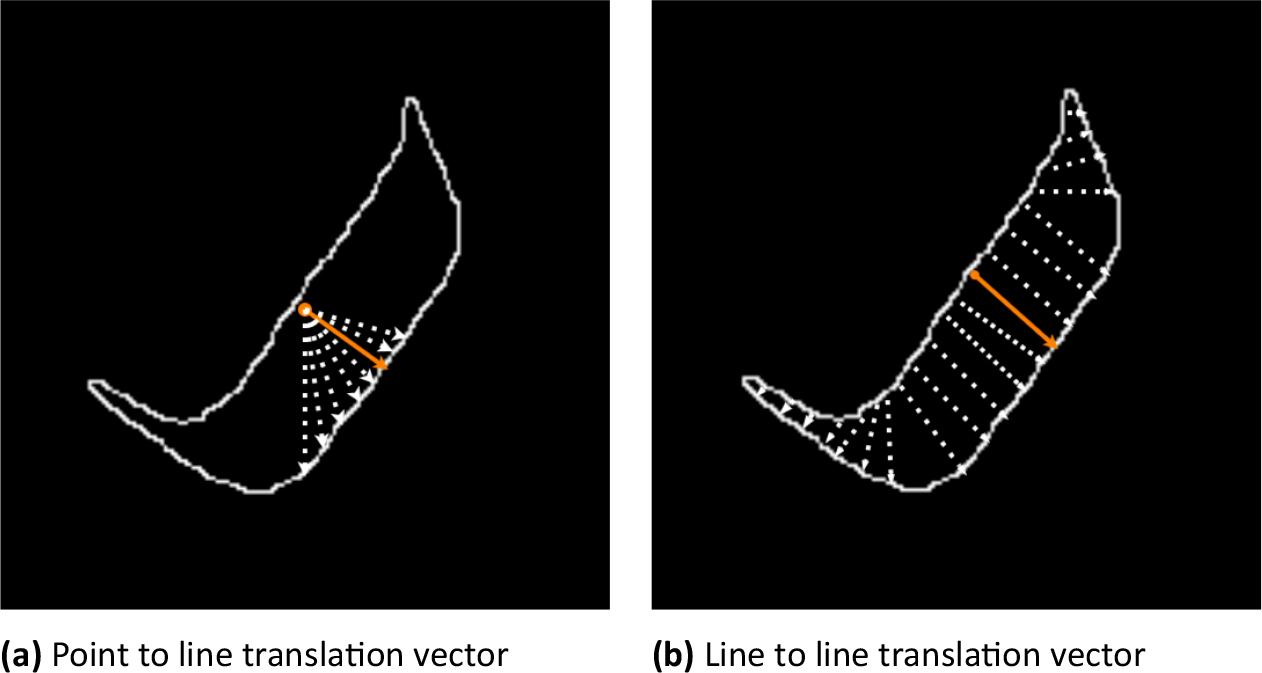
Figure 7.
Experimental results evaluate the position error of our algorithm (mm)
| Fold | Sample | Traditional Method | Regression Method [30] | Proposed Method | |||||||||
|---|---|---|---|---|---|---|---|---|---|---|---|---|---|
| Δx | Δy | Err | Δx | Δy | Err | Δx | Δy | Err | Δx | Δy | Err | ||
| 1 | 1 | 9.69 | 5.51 | 11.15 | 1.34 | 1.32 | 1.88 | 0.38 | 1.14 | 1.20 | 0.95 | 0.76 | 1.22 |
| 2 | 8.36 | 8.74 | 12.09 | 1.92 | 2.50 | 3.15 | 3.04 | 1.33 | 3.32 | 1.71 | 1.33 | 2.17 | |
| 3 | 5.13 | 8.93 | 10.30 | 1.23 | 1.52 | 1.96 | 1.14 | 0.95 | 1.48 | 1.14 | 0.95 | 1.48 | |
| 4 | 10.07 | 8.36 | 13.09 | 1.79 | 1.97 | 2.66 | 1.14 | 1.33 | 1.75 | 1.52 | 1.33 | 2.02 | |
| 5 | 8.55 | 10.26 | 13.36 | 0.75 | 1.12 | 1.35 | 0.76 | 0.19 | 0.78 | 0.38 | 0.57 | 0.69 | |
| 6 | 9.31 | 9.31 | 13.17 | 0.96 | 1.41 | 1.71 | 0.19 | 1.52 | 1.53 | 0.57 | 0.76 | 0.95 | |
| 2 | 1 | 4.18 | 5.89 | 7.22 | 1.45 | 3.07 | 3.40 | 1.33 | 2.09 | 2.48 | 0.95 | 1.14 | 1.48 |
| 2 | 10.07 | 13.11 | 16.53 | 3.12 | 3.41 | 4.62 | 2.47 | 1.71 | 3.00 | 2.47 | 1.33 | 2.81 | |
| 3 | 3.42 | 7.03 | 7.82 | 1.21 | 2.78 | 3.03 | 1.52 | 1.90 | 2.43 | 0.76 | 0.57 | 0.95 | |
| 4 | 10.07 | 8.74 | 13.33 | 2.13 | 1.51 | 2.61 | 0.95 | 0.19 | 0.97 | 1.90 | 0.95 | 2.12 | |
| 5 | 11.02 | 12.16 | 16.41 | 2.94 | 2.67 | 3.97 | 2.28 | 1.71 | 2.85 | 2.47 | 0.57 | 2.53 | |
| 6 | 8.93 | 11.02 | 14.18 | 0.43 | 1.34 | 1.41 | 1.33 | 0.38 | 1.38 | 0.19 | 0.19 | 0.27 | |
| 3 | 1 | 9.12 | 7.60 | 11.87 | 1.39 | 1.42 | 1.99 | 0.95 | 0.19 | 0.97 | 1.14 | 0.38 | 1.20 |
| 2 | 4.18 | 13.87 | 14.49 | 2.54 | 3.36 | 4.21 | 3.23 | 0.19 | 3.24 | 2.28 | 0.57 | 2.35 | |
| 3 | 9.88 | 4.18 | 10.73 | 0.76 | 1.12 | 1.35 | 0.57 | 0.76 | 0.95 | 0.57 | 0.76 | 0.95 | |
| 4 | 7.60 | 8.93 | 11.73 | 1.89 | 2.17 | 2.88 | 1.71 | 0.95 | 1.96 | 1.71 | 0.95 | 1.96 | |
| 5 | 10.45 | 4.94 | 11.56 | 0.88 | 2.34 | 2.50 | 1.71 | 1.52 | 2.29 | 0.57 | 0.76 | 0.95 | |
| 6 | 6.08 | 7.60 | 9.73 | 0.36 | 0.57 | 0.67 | 0.19 | 0.57 | 0.60 | 0.19 | 0.57 | 0.60 | |
| 4 | 1 | 13.87 | 10.26 | 17.25 | 1.37 | 2.84 | 3.15 | 0.76 | 2.47 | 2.58 | 0.95 | 2.09 | 2.30 |
| 2 | 11.97 | 7.98 | 14.39 | 2.84 | 1.45 | 3.19 | 2.28 | 1.33 | 2.64 | 2.28 | 1.33 | 2.64 | |
| 3 | 5.32 | 4.56 | 7.01 | 0.35 | 0.81 | 0.88 | 0.19 | 0.38 | 0.42 | 0.19 | 0.57 | 0.60 | |
| 4 | 5.51 | 16.34 | 17.24 | 0.32 | 1.32 | 1.36 | 0.76 | 1.14 | 1.37 | 0.19 | 1.71 | 1.72 | |
| 5 | 10.26 | 8.36 | 13.23 | 0.92 | 0.92 | 1.30 | 2.28 | 0.76 | 2.40 | 0.57 | 1.14 | 1.27 | |
| 6 | 6.27 | 11.40 | 13.01 | 1.47 | 1.63 | 2.19 | 1.90 | 2.85 | 3.43 | 1.33 | 1.33 | 1.88 | |
| Average | 8.30 | 8.96 | 12.54 | 1.43 | 1.86 | 2.34 | 1.38 | 1.15 | 1.92 | 1.12 | 0.94 | 1.55 | |
Performance comparison of various object segmentation models
| Algorithm | mAP | Pr | Rc | MS (MB) |
|---|---|---|---|---|
| Yolov5 [40] | 98.7% | 97.1% | 96.2% | 7.4 |
| RCNN [41] | 97.8% | 98.1% | 96.4% | 16.8 |
| Yolov7 [38] | 99.0% | 99.0% | 97.8% | 37.9 |
| Yolov8 [39] | 99.2% | 98.7% | 97.4% | 11.8 |
| Our | 99.8% | 99.1% | 97.9% | 28.9 |
Experiment setup details
| Parameter Spec | Spec |
|---|---|
| Process | Intel Xeon Processor with two cores @ 2.3 GHz |
| GPU | NVIDIA Tesla T4 |
| RAM | 13 GB |
| OS | Ubuntu 20.04 LTS |
Performance comparison of various object detection models
| Algorithm | mAP | Pr | Rc | MS |
|---|---|---|---|---|
| RTMDet [37] | 96.9% | 94.5% | 93.1% | 52.3 |
| MobileNet [35] | 94.8% | 93.8% | 93.4% | 4.6 |
| Fast R-CNN [34] | 97.0% | 93.4% | 94.1% | 12.9 |
| Yolov3 [33] | 96.3% | 95.8% | 95.7% | 8.7 |
| Yolov4 [36] | 96.8% | 96.6% | 95.4% | 60.0 |
| Yolov7 [38] | 97.1% | 95.7% | 93.1% | 37.2 |
| Yolov8 [39] | 97.8% | 95.5% | 94.4% | 11.1 |
| Our | 98.7% | 98.6% | 97.0% | 7.0 |
Processing time of our proposed method (milliseconds)
| Phase | Processing Time |
|---|---|
| Object Detection | 15 ± 2 |
| Object Segmentation | 40 ± 5 |
| Object Calibration | 300 ± 10 |