
Table 1
Quantitative survey participants’ characteristics (N = 970).
| CHARACTERISTIC | n | % | CHARACTERISTIC | n | % |
|---|---|---|---|---|---|
| Age | Primarily caring for | ||||
| 18–24 | 63 | 8% | Child(ren) | 415 | 52.5% |
| 25–34 | 145 | 18.4% | Parent(s) | 175 | 22.2% |
| 35–44 | 296 | 37.5% | Spouse/partner | 110 | 13.9% |
| 45–54 | 180 | 22.8% | Other(s) | 90 | 11.4% |
| 55–64 | 82 | 10.4% | Condition of person caring for | ||
| 65 or above | 24 | 3% | A learning difficulty or disability | 365 | 46.2% |
| Gender | A physical disability | 309 | 39.1% | ||
| Male | 151 | 78.4% | A mental health condition | 259 | 32.8% |
| Female | 619 | 19.1% | Long-standing illness | 212 | 26.8% |
| Other (non-binary or prefer not to say) | 20 | 2.5% | Problems connected to ageing | 121 | 15.3% |
| Ethnicity | Other1 | 256 | 32.4% | ||
| White | 692 | 87.6% | Time spent caring | ||
| Black (African, Caribbean, British) | 20 | 2.5% | Less than 1 year | 26 | 3.3% |
| Asian | 28 | 3.5% | 1–2 years | 61 | 7.7% |
| Mixed | 31 | 3.9% | 2–3 years | 72 | 9.1% |
| Other or prefer not to say | 19 | 2.5% | 3–4 years | 62 | 7.8% |
| Employment status | 4–5 years | 57 | 7.2% | ||
| Not in paid work | 268 | 33.9% | More than 5 years | 512 | 64.8% |
| Employed full-time | 169 | 21.4% | Hours spent caring per week | ||
| Employed part-time | 160 | 20.3% | 0–9 hours | 30 | 3.8% |
| Self-employed | 66 | 8.3% | 10–19 hours | 71 | 9% |
| Doing voluntary work | 46 | 5.8% | 20–34 hours | 98 | 12.4% |
| Retired | 33 | 4.2% | 35–49 hours | 159 | 20.1% |
| Other | 48 | 6.1% | 50–74 hours | 72 | 9.1% |
| 75–99 hours | 55 | 7% | |||
| 100 or more hours | 198 | 25.1% | |||
| Varies – under 20 hours | 18 | 2.3% | |||
| Varies – 20 hours or more | 76 | 9.6% | |||
| Other | 13 | 1.6% |
[i] 1. Includes sight or hearing loss, dementia, alcohol or drug dependency, or not sure. The total tallies up to more 100% as the respondents could select multiple options.
Table 2
Caregiving impact on assignment submission.
| IMPACT ON ASSIGNMENT SUBMISSION | n | % |
|---|---|---|
| No impact – I can complete and submit assignments on time and to the best of my ability | 90 | 11.4% |
| Minimal impact – I can complete and submit assignments, but caregiving sometimes affects the quality of my work. | 273 | 34.6% |
| Moderate impact – I struggle to either complete assignments on time OR the quality of my work is affected. | 256 | 32.4% |
| Significant impact – I struggle to both complete assignments on time AND the quality of my work is affected. | 118 | 14.9% |
| Severe impact – I frequently cannot complete assignments and/or must submit work that does not reflect my true ability. | 53 | 6.7% |
Table 3
Caregiving responsibilities impact on health and wellbeing.
| OUR SURVEY OF OU STUDENT CARERS | SACE 2023–24 | |||
|---|---|---|---|---|
| n | % | n | % | |
| I feel I am neglecting myself | 260 | 32.9% | 8,286 | 20.2% |
| Sometimes I can’t look after myself well enough | 363 | 45.9% | 13,578 | 33.1% |
| I look after myself | 167 | 21.1% | 19,156 | 46.7% |
Table 4
Caregiving responsibilities impact on specific health issues.
| MENTIONED2 | TOP 3 | |
|---|---|---|
| Feeling tired | 85% | 61% |
| General feeling of stress | 77% | 50% |
| Disturbed sleep | 71% | 43% |
| Feeling depressed | 52% | 28% |
| Short tempered/irritable | 49% | 17% |
| Physical strain (e.g. back) | 32% | 8% |
| Made an existing condition worse | 25% | 11% |
| Had to see my own GP | 24% | 2% |
| Loss of appetite | 18% | 3% |
| Developed my own health condition | 14% | 5% |
| None of these | 4% | N/A |
| Other | 3% | 2% |
[i] 2. ‘Mentioned’ means respondent experienced the issue (multiple selection allowed). If they had selected more than three options, a follow-up question was asked to select up to three issues with the most significant impact.
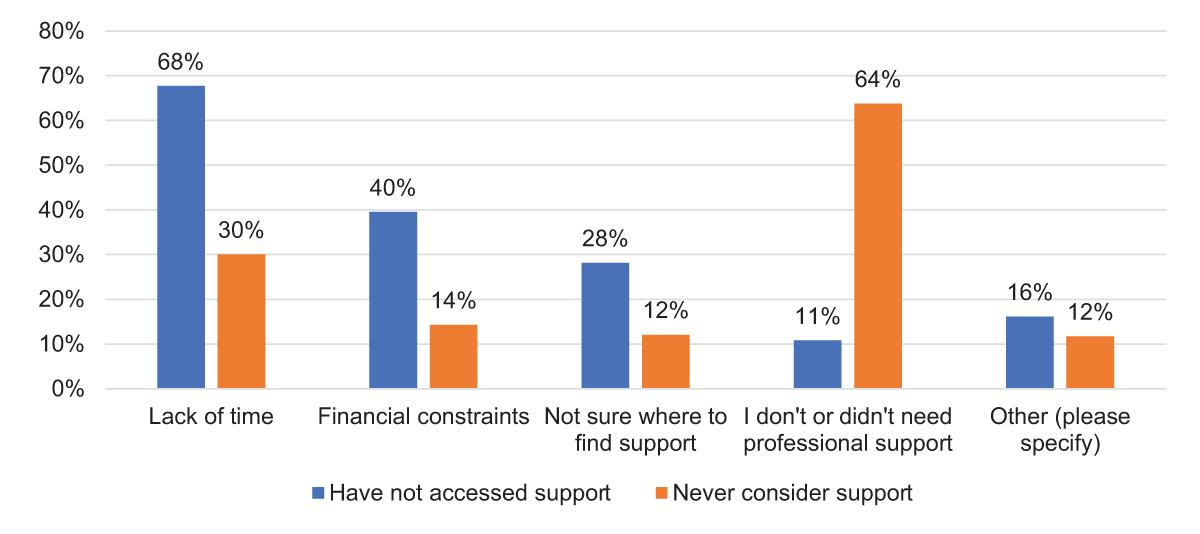
Figure 1
Student carers’ primary reasons for not accessing support.
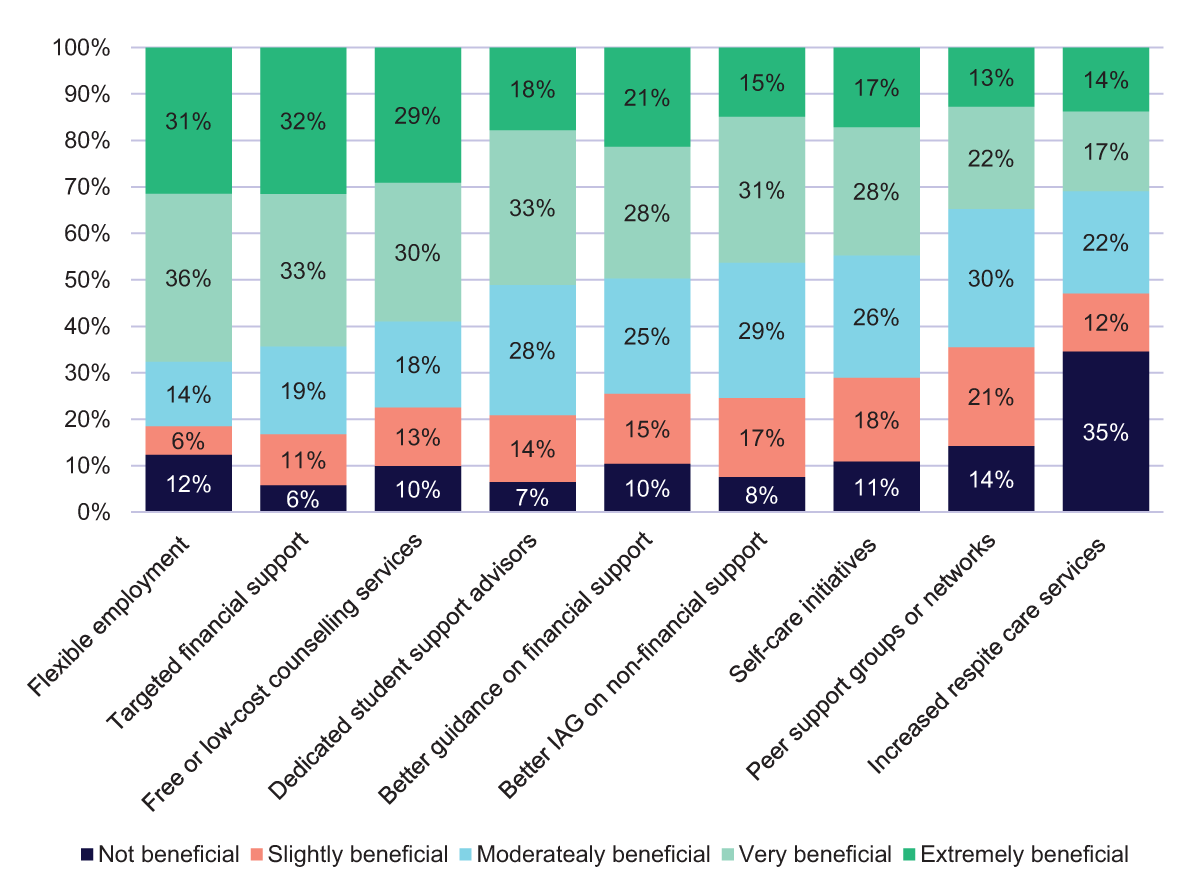
Figure 2
Support student carers most valued.