
Introduction
The swift progression of digital technologies has changed the opportunities for teaching and learning in science education. The degree to which these tools are effectively incorporated into classroom practice varies significantly among teachers, often influenced by their teaching philosophies, subject-specific circumstances, and institutional settings. Comprehending not only whether but also how teachers utilize technology is crucial for discovering pathways to more inventive and effective teaching methods. To address this, numerous conceptual frameworks have been developed to categorize and evaluate the educational function of digital tools. Among them, the Replacement-Amplification-Transformation (RAT) model offers a particularly accessible yet analytically robust framework for examining the functional role of technology in education.
The theoretical framework for this study is the Replacement-Amplification-Transformation (RAT) model developed by Hughes, Thomas, and Sharber (2006). At the replacement level, digital tools are used merely to substitute traditional teaching methods without changing instructional practices. At the amplification level, the model allows for exploring whether digital tools are used to enhance efficiency or improve instructional delivery without fundamentally changing pedagogy (for example, using PhET (Physics Education Technology) simulations to demonstrate mechanical waves instead of drawing them on the board or using static textbook images. At the transformation level teachers employ technology in ways that enable entirely new learning experiences that would not be possible otherwise.
In this way, the RAT model provides a systematic structure for evaluating the impact of technological innovations in teaching and facilitates the identification of their pedagogical benefits. In this study, the RAT model framework is used to collect feedback from 31 science teachers about how and to what extent they understand and apply digital technologies in science education. By framing interviews, lesson observations, and feedback questions about these lessons and around these categories, insights can be gained about teachers’ levels of technology integration; their understanding of the pedagogical potential of digital tools; and the barriers or enablers that facilitate the transition to transformative use of technology.
The following research questions were addressed:
RQ1: How do science teachers’ beliefs about technology integration, as categorised by the RAT model, align with their planning and classroom practices?
RQ2: To what extent do subject area, school size, settlement type, and teaching experience influence the distribution of RAT model categories among science teachers?
Literature
Various conceptual frameworks can be used to plan, describe, and analyze the impact and effectiveness of digital technologies in the teaching and learning process. These frameworks vary in their emphasis, covering functional and characteristic aspects, along with pedagogical and transformative levels of application.
One of the first frameworks, the Levels of Teaching Innovation (LoTi) developed by Moersch (1995), offered a seven-point scale ranging from “non-use” to “expansion and refinement,” highlighting that deeper levels of technology integration require authentic, student-centered, and internationally connected environments. Ten years later, Mishra and Koehler (2006) introduced the Technological Pedagogical Content Knowledge (TPACK) framework, redefining teacher proficiency as the convergence of technological, pedagogical, and content knowledge, emphasizing the need to match technology application with subject-specific requirements, such as employing simulations in science teaching. In the same year, Hughes, Thomas, and Scharber (2006) presented the RAT model, which defined the function of technology as substitution, enhancement, or alteration of current practices. Later advancements enhanced these concepts: the Technology Integration Matrix (TIM) (Harmes et al., 2016) merged five progressive levels of integration with five aspects of meaningful learning, thus connecting the complexity of technology use to the quality of student learning experiences. Puentedura’s SAMR (Substitution, Augmentation, Modification, and Redefinition) model (2013) outlined four phases of integration, highlighting the transformative capacity of technology when it facilitates entirely new practices. In addition to these structural models, scholars also focused on cognitive involvement. Chi and Wylie (2014) enhanced the ICAP (Interactive, Constructive, Active, Passive) framework, categorizing engagement into passive, active, constructive, or interactive, and showing that the most significant learning advantages arise when technology promotes interactive and constructive tasks. In the same year, Bachy (2014) extended TPACK into the TPDK model by incorporating disciplinary knowledge, thereby acknowledging that subject-specific contexts, such as the quantitative demands of physics, require distinct forms of technological integration. Building on this recognition of teachers’ professional capacities, the DigCompEdu framework, developed by the European Commission’s Joint Research Centre (Redecker, 2017), identified six domains of digital competence ranging from professional engagement to empowering learners, situating technology use on a continuum from augmentation to transformation. Most recently, Kimmons et al. (2020) introduced the PICRAT model, which integrates two dimensions – student engagement (passive, interactive, or creative) and the role of technology (replacement, amplification, or transformation), thus providing educators with a flexible tool to evaluate both learner activity and the transformative impact of technology.
While several frameworks exist to examine technology integration in education, such as SAMR, PICRAT, and TIM, the RAT model was chosen for this study due to its clarity, simplicity, and practical applicability. Unlike SAMR, which emphasizes a four-stage technology integration, RAT focuses specifically on the functional role of technology – replacement, amplification, or transformation – making it easier to categorize teachers’ practices. Similarly, while PICRAT provides a detailed matrix combining student engagement and technology role, its multidimensional structure can be complex for participants to self-assess. TIM offers a comprehensive view of integration across pedagogy and cognition but requires extensive classroom observation and training to apply reliably. In contrast, RAT provides a direct, accessible framework that aligns with the study’s goal of collecting teacher feedback on their understanding and use of digital tools in science classrooms, making it particularly suitable for analyzing practical classroom practices and pedagogical outcomes.
The model serves as an assessment framework for understanding the role of technology in teaching, learning, and curricular practices, with the underlying view that technology is used as a means to achieve certain pedagogical and instructional goals (Luckay & Marthinisen, 2023). The RAT model was developed to inform “critical decision-making concerning integration of technology into the K-12 classroom” and focuses specifically on identifying the role played by technologies used in the classroom (Redmond & Lock, 2019; Luckay & Marthinisen, 2023). The framework is designed to be broadly applicable to any artifact used in a classroom context, whether digital or analog, making it a versatile tool for educators seeking to understand their technology integration practices (Luckay & Marthinisen, 2023).
The RAT framework was initially developed as a self-assessment tool for pre-service and in-service teachers to improve their ability to make key technology integration decisions (Panakaje et al., 2024). It operates through three progressive levels that characterize different depths of technology integration in the educational environment. At the Replacement level, technology serves as a direct tool substitute with no functional change, acting as a digital means to replicate earlier, non-technology instructional practices (Crompton & Sykora, 2021; Lindenbauer et al., 2023). Examples include using digital flashcards instead of paper flashcards, electronic slides in place of overhead projectors, or interactive whiteboards replacing traditional chalkboards. Essentially, these are activities that transfer existing earlier teaching practices to contemporary media without improving functionality (Kormos, 2022). The Amplification level occurs when technology increases efficiency, effectiveness, and productivity of non-technological instructional practices (Crompton & Sykora, 2021). At this stage, digital technology serves to enhance productivity and efficiency while the fundamental task remains unchanged (Kormos, 2022). For instance, students might use Google Docs to provide real-time written feedback to peers through comments instead of handwritten feedback on paper margins, where the capabilities provide greater benefit for teaching and learning than if technology was omitted (Kormos, 2022). This amplification focuses on improving teachers’ effectiveness rather than fundamentally changing pedagogical approaches (Panakaje et al., 2024; Pea, 1985). At the Transformation level, technology enables significant task redesign and invents new instruction, learning, and curriculum approaches (Crompton & Sykora, 2021; Lindenbauer et al., 2023). This level employs technology to empower rather than simply strengthen pedagogical methods, resulting in new types of learning not previously possible. Technology integration at this level has the potential to change students’ activities by supporting a reorientation in their thinking that would be difficult or impossible to achieve without technology, often focusing student thinking on recognizing patterns and making and testing conjectures (Lindenbauer et al., 2023). A significant finding emerged from further research by Hughes and colleagues (2006), who discovered that educators found the transition from amplification to transformation too great a leap, necessitating modifications to the original framework (Crompton & Sykora, 2021). The RAT model has found practical application in educational research and teacher development contexts, serving as both an analytical framework and a self-assessment tool. In K-12 education, the framework has been used to examine technology integration practices across different subject areas, with researchers applying it to understand how teachers and learners experience technology in their educational contexts (Luckay & Marthinisen, 2023). The model’s broad applicability makes it suitable for analyzing any artifact used in classroom settings, whether digital or analog, making it particularly valuable for high school teachers seeking to determine their position within the RAT framework when integrating information and communication technology (Luckay & Marthinisen, 2023). Research applications have demonstrated the model’s utility in subject-specific contexts, such as Technology education, where it helps understand the role of information and communication technology in teaching practices at case study schools (Luckay & Marthinisen, 2023). The framework has also been employed to analyze how teachers design lessons and activities that incorporate technology through instructional design, examining the resulting changes in student achievement and engagement (Panakaje et al., 2024). Implementation studies have focused on understanding the practical aspects of each RAT level in real classroom settings. At the replacement level, researchers have examined how technology performs without changing instructional practices through tools like interactive whiteboards, tablets, and learning management systems (Panakaje et al., 2024). Amplification research has concentrated on teachers’ effectiveness improvements, including perceived usefulness, changes in skills and attitudes about technology, and modifications in teacher evaluations or observations (Panakaje et al., 2024; Pea, 1985). The transformation level has been studied in contexts where new cognitive forms emerge, new people become involved in the learning process, or previously inaccessible content becomes available (Luckay & Marthinisen, 2023).
Despite its early introduction and potential utility, the RAT framework has not achieved widespread adoption, with only a few publications referencing the framework. This limited uptake may be attributed to the development of multiple competing models during the same period, such as the SAMR Model, which gained more popularity among researchers and practitioners (Bicalho et al., 2023; Hamilton et al., 2016; Kormos, 2022; Zamri & Mohamad, 2024). Notably, the SAMR model is thought to build on the RAT model, providing a related approach to technology integration through substitution, augmentation, modification, and redefinition (Redmond & Lock, 2019).
Although the RAT framework has retained its foundational three-level structure since Hughes first introduced it in 2005, certain researchers have suggested additions to overcome perceived shortcomings in the model. The primary difference is the iRAT model, which goes beyond the standard RAT framework by adding a fourth category: Impairment (Mucho et al., 2024). This addition acknowledges that technology integration can occasionally hinder rather than improve educational outcomes, offering a broader perspective on technology’s possible impacts in classroom environments. The main alteration efforts have centered on tackling the real challenges teachers encounter when applying the framework. Hughes and his team discovered that educators perceived the shift from amplification to transformation as too significant, requiring alterations to the initial framework (Crompton & Sykora, 2021; Kormos, 2022). Nevertheless, the precise characteristics of these alterations have not been thoroughly recorded in the literature. This gives us reason to believe that the model has not lost its relevance, despite the aforementioned limitations, and can be chosen as the theoretical framework of the present study because of its simplicity, clarity, and better understanding by teachers.
Methods
This study used three methods of data collection: semi-structured interviews, lesson planning questionnaires, and classroom observations, administered sequentially between November 2024 and March 2025 among 31 science teachers.
All interviews were conducted online and included a total of 25 pre-formulated questions to explore five principal domains: (1) the integration of technology within the respondent’s school (5 questions); (2) the respondent’s experience with digital technologies (7 questions); (3) the role of technology in the teaching and learning process (4 questions); (4) the integration of technology in classroom practice (7 questions); and (5) perspectives on future developments (2 questions). The interviewer was given the right to ask additional questions for clarification. One of the interview questions was specifically related to the role of digital technologies: “What role do you think digital technologies should play in the teaching of your subject(s)?”
In the period of about one month after the interview and before the classroom observation, the teachers were asked to complete a lesson plan questionnaire addressing the following:
What are your instructional objectives for this lesson? Do you have any specific goals concerning the development of students’ general digital competencies?
What learning tasks and activities (individual or collaborative) are assigned to students in preparation for the lesson? Do these tasks involve the use of digital technologies or electronic resources? If so, which ones?
What digital technologies do you plan to use, and what technologies do you expect the students to use during the lesson?
Briefly describe the assessment strategies you intend to employ throughout the lesson (before, during, and after). Please specify the type of assessment (ongoing/formative/summative) and the lesson stages during which each will be applied.
What teaching methods do you plan to use in this lesson, and in which of them will you incorporate technology? How would you define the role of technology in relation to these activities: substitutive, augmentative, or transformative in terms of the teacher’s activity – see the explanation at the end of the instrument.
Please share links to electronic educational resources or other materials used in the preparation and delivery of the lesson (if available).
To guide teachers in responding to question 5, a written description of the three types of roles that the technology can perform: Replacement, Amplification, and Transformation, was also provided. Finally, science lessons were conducted, for which a written protocol was prepared detailing what took place in the classroom.
In the final stage of the empirical study, a lesson observation protocol was used to systematically record classroom practices involving digital technologies. The protocol captured contextual information about the lesson, teacher and student activities, the use and role of technologies, forms of assessment, and indicators of student engagement. Each teacher gave consent for the observation of exactly one lesson, with the class and day chosen by the teacher. In most cases, the interview and the observation were conducted by the same researcher.
The data were grouped by participants, e.g., a case for each teacher was created (number of data groups N = 31). The QDA Miner 2025.0.4 software was applied to extract qualitative information from the three sources (interview transcripts, questionnaires, and classroom observation notes) for 31 science teachers with the RAT model as our analytical framework (see Section Instruments and analytical approach).
Sample
The sample of 31 science teachers included in this study represents a sub-sample drawn from a broader cohort of 220 teachers interviewed across 30 schools. These 30 schools form a purposefully constructed sample embedded in a nationally representative frame of 359 Bulgarian secondary schools, initially selected through a two-stage stratified cluster sampling procedure (probability proportional to size). The detailed sample design and rationale for the construction of this sample are described in Peytcheva-Forsyth and Mizova (2025).
The sample of 30 schools was assembled based on stratification criteria aimed at maximum variation in institutional and contextual characteristics rather than statistical representativeness. The stratification aimed to ensure diversity in:
– School size: 10 small (up to 100 students), 10 medium (101–300 students), 10 large (over 300 students).
– Geographic distribution: Balanced coverage of settlement types (provincial cities, towns, villages) and administrative regions (NUTS 2).
– School type: Inclusion of primary, lower secondary, upper secondary, and specialized schools.
Within these schools, teachers were invited for qualitative interviews following a quota-based purposive sampling strategy designed to ensure disciplinary breadth and analytical depth. Quota criteria included:
– Subject area quotas: Minimum representation for each subject group, including a natural sciences quota (minimum n = 30 across the 30 schools).
– School-level quotas: Proportional allocation of interviewees based on school size (typically 5–15 teachers per school).
– Educational stage representation: Inclusion of both lower and upper secondary teachers.
The subsample of 31 science teachers was drawn from the natural sciences quota within the broader qualitative sample (N = 220, realization rate = 98,2%). Their selection followed purposive sampling principles:
– Composition by subject: Biology (n = 16; 51,5%), Physics (n = 7; 22,5%), Chemistry (n = 8; 26%), mirroring common staffing patterns in Bulgarian secondary schools.
– Nomination process: Teachers were nominated by school leadership (principals, deputy principals, ICT coordinators) based on subject taught, educational stage, and experience with digital technology integration.
– Verification: The research team reviewed the nominations to maintain balance across subject areas and levels of experience, requesting additional nominations if needed.
The demographic characteristics of the respondents for this study are given in Table 1.
Table 1
Demographic Characteristics of Respondents (N = 31).
| DATA | CATEGORIES | FACULTY, % |
|---|---|---|
| Gender | Male | 6 |
| Female | 94 | |
| Subject Taught | Biology | 51,5 |
| Physics | 22,5 | |
| Chemistry | 26 | |
| Educational Stage | Lower Secondary (grades 5–7) | 55 |
| Upper Secondary (grades 8–12) | 32 | |
| Lower and Upper Secondary | 13 | |
| School Size | Small | 13 |
| Medium | 22,5 | |
| Large | 64,5 | |
| Settlement Type | Provincial City | 65 |
| Town | 16 | |
| Village | 19 | |
| Less than 5 years | 19,4 | |
| Between 6 and 10 years | 16,1 | |
| Years of service | Between 11 and 20 years | 9,7 |
| Between 21 and 30 years | 29 | |
| More than 30 years | 19,4 | |
| Not specified | 6,4 |
Ethical approval was obtained from the Ethics Committee of the research institution prior to the survey. Participation was voluntary, and all collected data were processed in anonymised form, with no possibility of identifying individual participants. The participants are numbered from 1 to 31 in the text to keep their identity private, and will be referred to as Case 1, Case 2, and so on. The biology teachers are labeled as Case 1 to Case 16, the physics teachers are Case 17 to Case 23, and the chemistry teachers are Case 24 to Case 31.
Data Processing
The systematic, theoretically driven process of qualitative analysis in this study involves a hierarchical code book in QDA Miner 2025.0.4, aligned with the RAT framework (Figure 1). Manual coding was performed to match individual parts of each document to the appropriate RAT level and source type. This made it possible to track each teacher’s views about digital tools (from interviews), what he or she planned to do in a specific lesson (from questionnaires), and what he or she actually did (from observations).
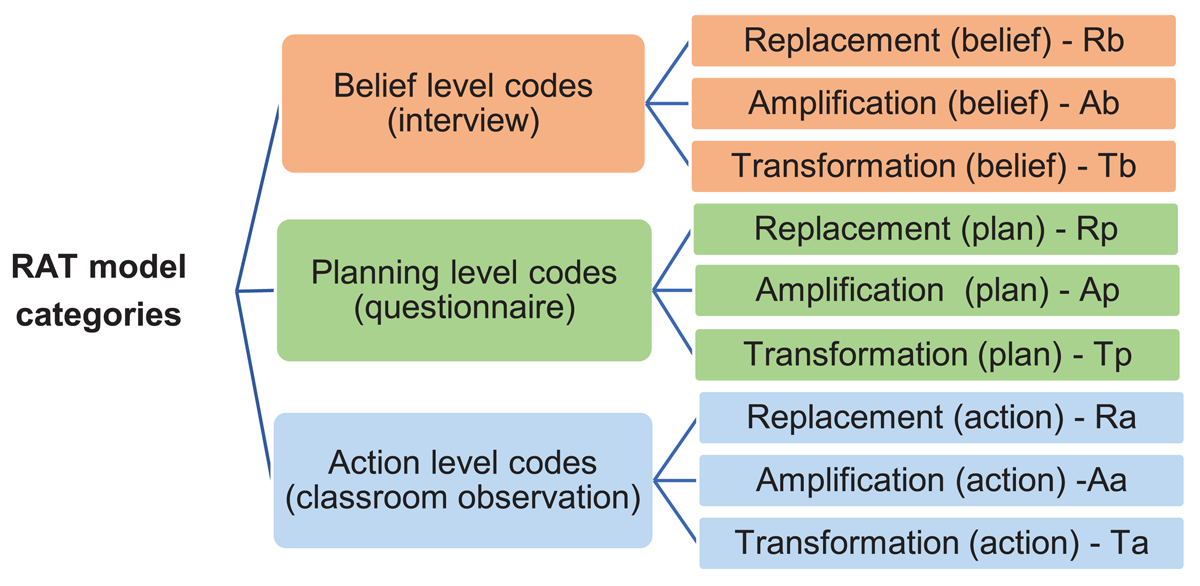
Figure 1
RAT Model Category and Coding.
The qualitative coding was undertaken by a single researcher. To strengthen the reliability of the analysis a second team member reviewed the codebook and a sample of coded segments. Any divergent interpretations or ambiguous cases were resolved through discussion contributing to consistency and clarity in code application.
Further, in the text, tables, and figures, abbreviations for these codes were used, e.g., Rb is the designation for Replacement (belief); Ab for Amplification (belief) and so on.
Subcodes related to school-level factors, digital technology experience, and attitude/opinion were also added (Figure 2). Crosscutting themes like school-level factors (technological infrastructure and institutional support) and digital technology experience (university training, Continuing Professional Development (CPD) courses, self-education and peer exchange) may provide insights about the barriers and lack of motivation to integrate digital technology. Meanwhile, the attitude/opinion refers to these statements in the interviews that cannot be clearly coded as Rb, Ab, Tb, etc., but express strong personal views about digital technology, such as the following:
“The percentage of attention is clearly higher with digital resources – no doubt about it.”, or:
“I don’t think we are sufficiently accustomed to, trained in, or methodologically prepared to use digital tools purposefully, without getting distracted by unrelated topics.”
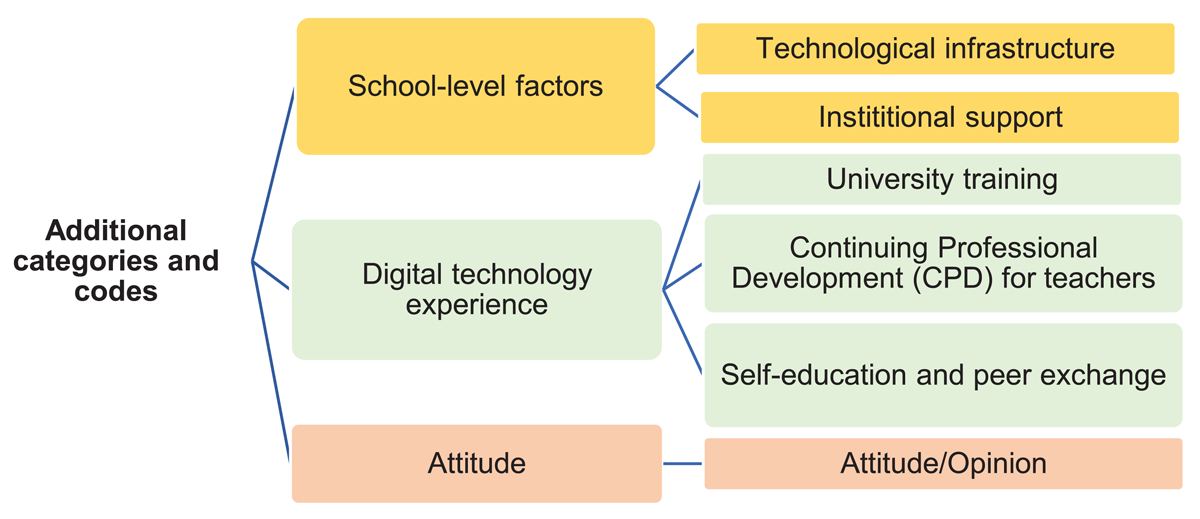
Figure 2
Additional Categories and Coding.
The additional coding was applied only to the interview data.
The next step was to analyze consistency and gaps. QDA Miner tools were: Coding Retrieval by Case (to view the full profile of RAT codes per case), Code Frequency Table (to quantify how many cases fall into each RAT level at each stage – belief/plan/action), Co-occurrence Matrix (to explore overlaps, e.g., do teachers who plan transformation also exhibit it?), and Cluster Analysis (Case Similarity and Code Similarity) to identify similarities. Cross-tab analyses of RAT model and other codes against school size, settlement type, and years of teacher experience reveal how contextual and experiential factors shape not only the extent but also the form of technology integration.
Findings and Discussion
We summarized quantitatively the results for the RAT model categories following qualitative coding. Results are presented using two complementary units of analysis: teachers (cases) and coded segments. Table 2 reports code frequencies across all data sources (interviews, questionnaires, and observations), while Figure 3 visualizes the distribution of RAT-related codes across individual teachers.
Table 2
Coding Frequency in RAT Model Categories Within All Types of Documents (Interviews, Questionnaires, and Observations).
| CATEGORY | CODE | COUNT | CODES, % |
|---|---|---|---|
| Belief level codes (interview) | Replacement (belief), Rb | 23 | 2,7 |
| Belief level codes (interview) | Amplification (belief), Ab | 150 | 17,5 |
| Belief level codes (interview) | Transformation (belief), Tb | 56 | 6,5 |
| Planning level codes (questionnaire) | Replacement (planned), Rp | 15 | 1,8 |
| Planning level codes (questionnaire) | Amplification (planned), Ap | 19 | 2,2 |
| Planning level codes (questionnaire) | Transformation (planned), Tp | 8 | 0,9 |
| Action level codes (classroom observation) | Replacement (action), Ra | 33 | 3,9 |
| Action level codes (classroom observation) | Amplification (action), Aa | 49 | 5,7 |
| Action level codes (classroom observation) | Transformation (action), Ta | 21 | 2,5 |
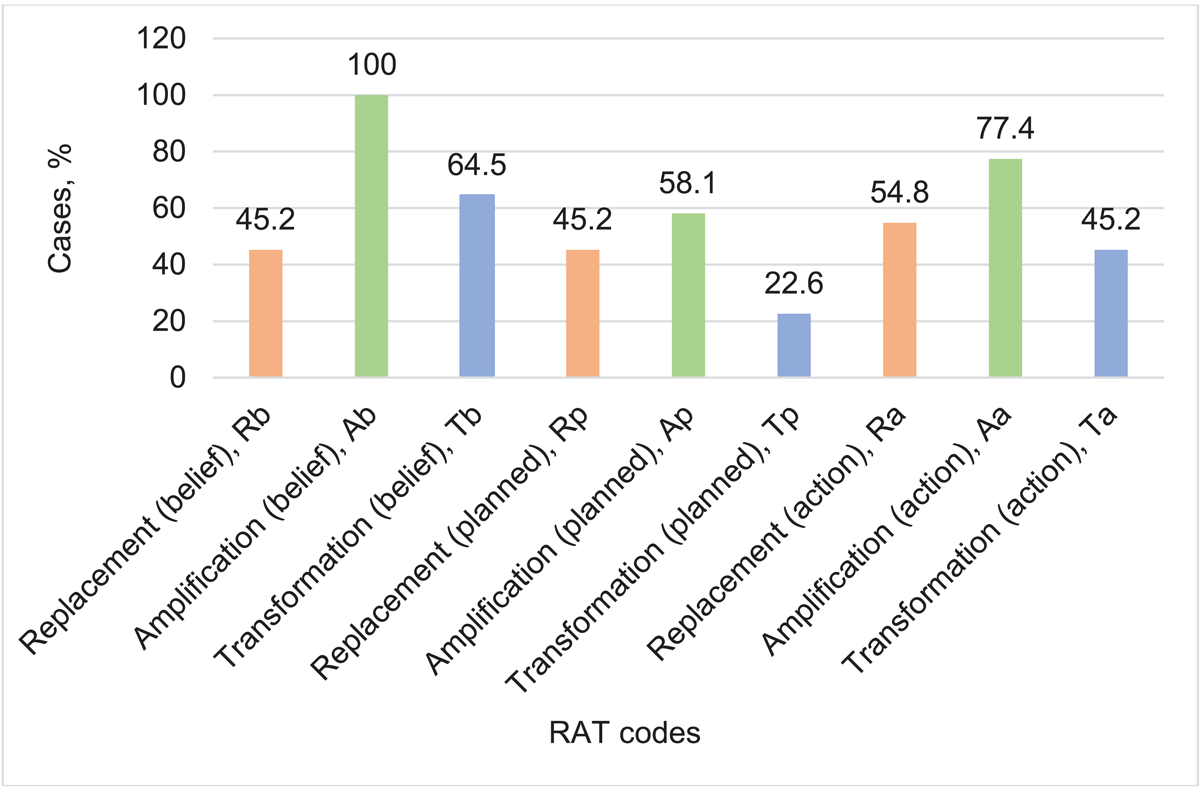
Figure 3
Distribution of RAT Model Codes Across All Document Types Reported in Cases.
Distribution of Rat Categories Across Beliefs, Planning, and Action
At the belief level, Amplification (Ab) was present in the discourse of all teachers (100%), indicating a shared perception of digital technology as a means to enhance existing instructional practices. Transformational beliefs (Tb) were expressed by more than half of the teachers, suggesting that a substantial proportion recognized the potential of technology to enable learning experiences not otherwise possible.
At the planning level, references to transformational integration (Tp) were comparatively rare, appearing in approximately one quarter of teachers’ lesson plans. In contrast, planning for amplification (Ap) was more common, indicating greater readiness to integrate technology in ways that improve efficiency or instructional delivery without fundamentally altering pedagogy. Notably, nearly half of the teachers planned only replacement-level activities (Rp), reflecting continued reliance on technology as a direct substitute for traditional tools.
At the action level, transformational technology use (Ta) was observed in approximately half of the classrooms, exceeding the proportion evident in planning but remaining below the prevalence of transformational beliefs. Amplification in action (Aa) was widespread, indicating that most teachers moved beyond simple substitution during classroom enactment. Replacement-level use (Ra) remained present in roughly half of the cases, suggesting that substitution continues to serve functional instructional purposes in many contexts.
To illustrate the findings, several vignettes from the observations are provided below The following specific cases represent acts of Replacement:
Case 14 (a Biology teacher): During the discussion and summary, the teacher uses various images from the presentation to illustrate the lesson content. Students engage with the images to answer the teacher’s questions (≈15 minutes).
Case 18 (a Physics teacher): The teacher introduces the topic “Reflection, Refraction, and Propagation of Light” by displaying a titled slide on an interactive screen. She asks students what light is, changes slides to visualize phenomena, and uses heuristic questioning to guide understanding. Students observe the presentation, respond to questions, and record key points in their notes (≈10 minutes).
Case 29 (a Chemistry teacher): The teacher opens a Kahoot quiz. Students participate using their mobile phones and complete a 10-question test.
The next three examples are indicative of Amplification in practice.
Case 3 (a Biology teacher): The teacher uses a presentation structured around the lesson plan for new knowledge, enhanced with embedded GIF animations to visualize different phenomena and a 3D video from a digital platform. Students follow the teacher’s explanations, take notes, and answer questions (≈26 minutes).
Case 18 (a Physics teacher): The teacher launches a virtual laboratory simulation of a laser passing through different media. She demonstrates the experiment, measures results with a virtual protractor, and guides students to record and analyze outcomes. Students actively engage with the interactive simulation, observe results, and draw conclusions, such as the law of reflection (≈10 minutes).
Case 31 (a Chemistry teacher): The teacher introduces the next topic segment through a presentation with animated orbital models and poses questions and tasks to the students. Students watch, listen, and solve the tasks.
Finally, the following three cases describe how transformation occurs in practice.
Case 15 (a Biology teacher): Students access a shared text document in a cloud-based virtual classroom and enter data for group-assigned questions. The collected information is then compiled into a digital file formatted as a laboratory experiment report.
Case 19 (a Physics teacher): The teacher divides students into three groups (with one student with special educational needs working individually with the resource teacher) and activates Wordwall.
Case 25 (a Chemistry teacher): Students use their mobile phones to participate in a Kahoot game to check their knowledge.
Subject-Specific Patterns of Rat Use
Figure 4 compares the prevalence of RAT categories at the teacher level across biology, physics, and chemistry. While all teachers expressed amplification-oriented beliefs, transformational beliefs varied by discipline, appearing least frequently among biology teachers (43,8%) and most frequently among chemistry teachers (87,5%).
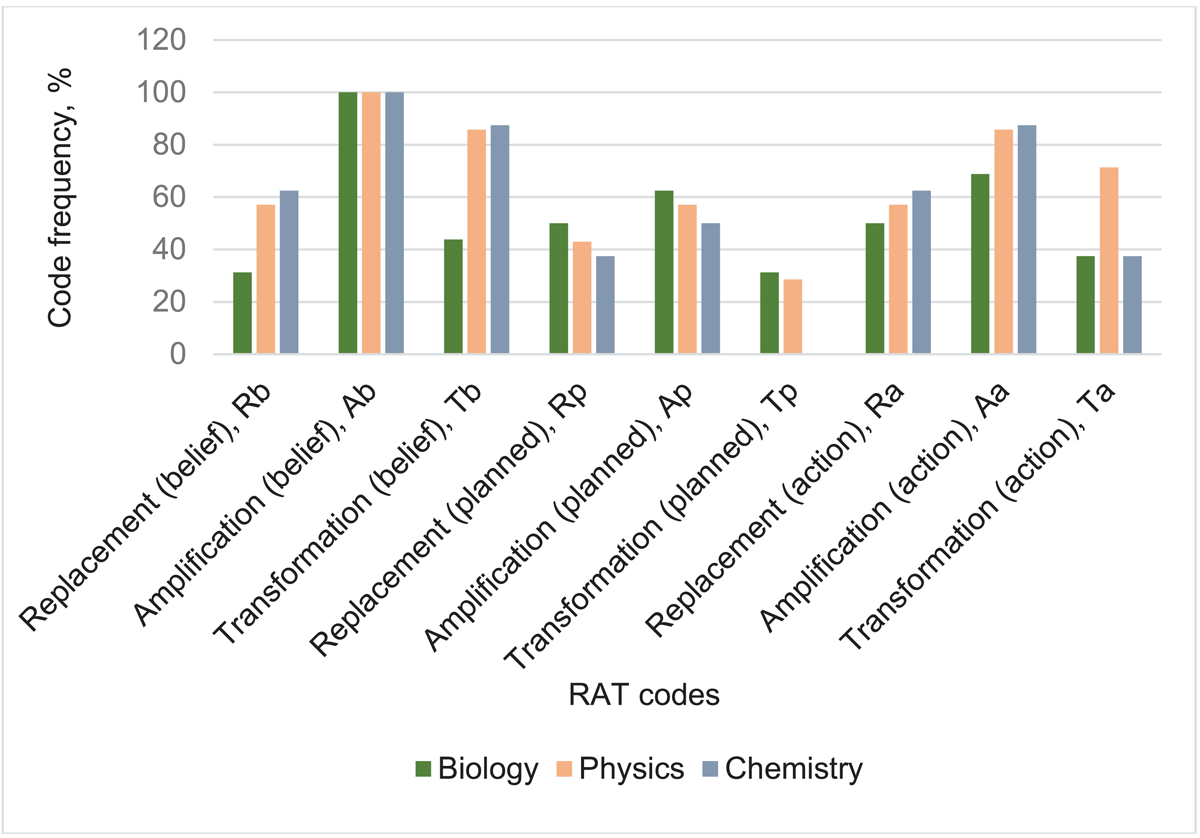
Figure 4
Comparison of RAT Category Use Among Subject Groups.
Across all subjects, planning for transformational integration was limited and notably absent among chemistry teachers. Physics teachers demonstrated the strongest alignment between transformational beliefs and classroom enactment, with 71,4% exhibiting transformational action-level use. Biology teachers showed the largest discrepancy between belief and practice, indicating a pronounced belief–action gap. Chemistry teachers, despite high aspirational beliefs and strong amplification in action, rarely planned for transformational integration, potentially reflecting curriculum rigidity or limited exemplars of transformational practice within the discipline.
Overall, these findings suggest that while belief in the enhancing role of technology is widespread, disciplinary context shapes how (and whether) such beliefs are translated into planning and practice.
Code Co-Occurence and Conceptual Relationships
To further examine relationships among RAT categories, a code co-occurrence analysis was conducted using the Jaccard similarity coefficient (Table 3; Figure 5). At the coded-segment level, the strongest co-occurrences (≥ 0,60) were observed between Ab–Aa (0,774), Ab–Tb (0,645), and Ab–Ap (0,581).
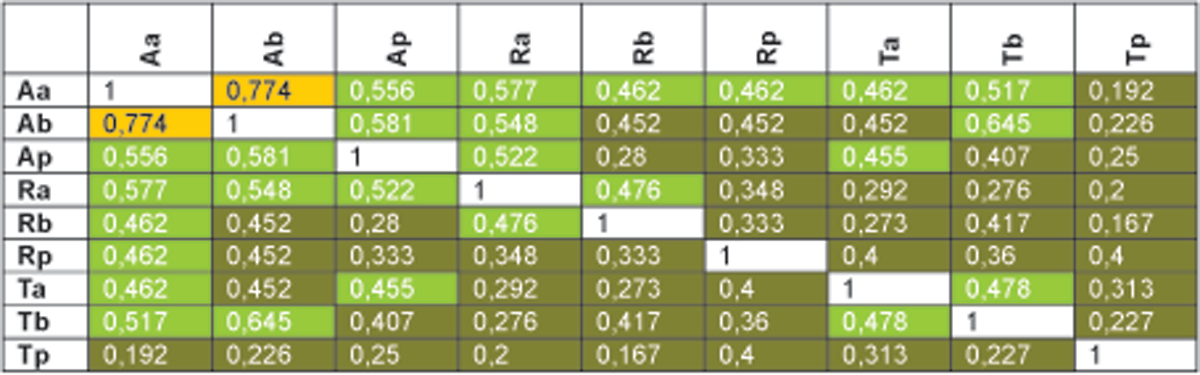
Table 3
Coding Co-occurrence Within Case. Similarity Index: Jaccard Coefficient (Occurrence).
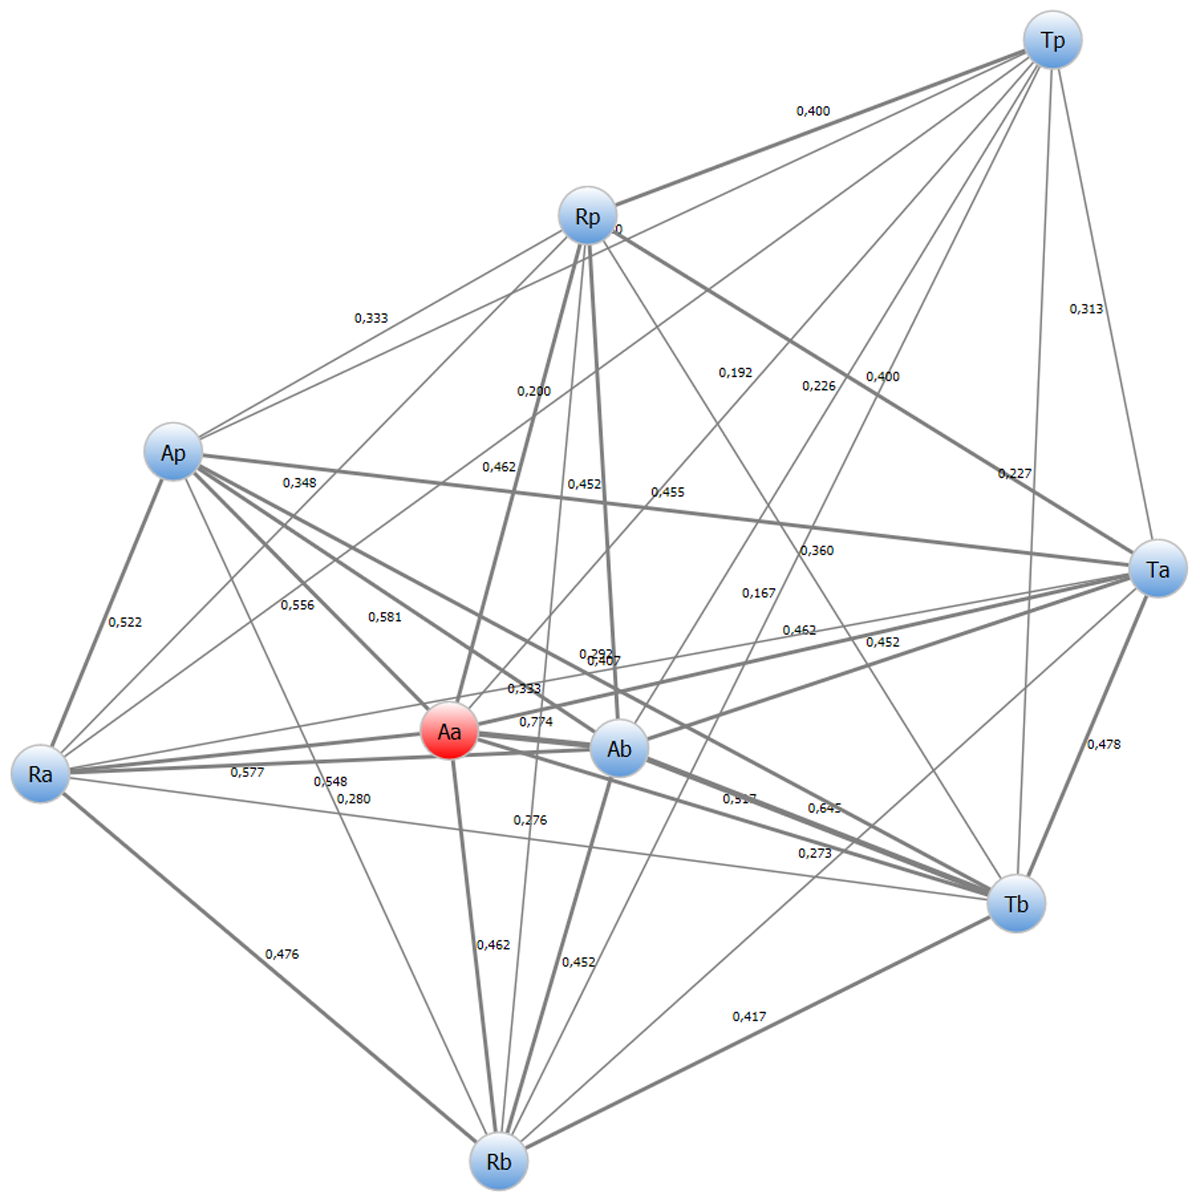
Figure 5
Coding Co-occurrence. Link Analysis.
These results indicate that amplification beliefs function as a central organizing construct, closely linked to both enacted practices and emerging transformational thinking.
Moderate co-occurrence (0,40–0,57) was found among several belief–planning–action combinations, including Ra–Aa, Ap–Aa, and Aa–Tb. These associations suggest partial alignment across levels, though not a fully coherent progression. In contrast, planning- and action-level replacement codes showed weak alignment with transformational codes, indicating limited pedagogical integration.
Transformation in planning (Tp) exhibited consistently weak co-occurrence (< 0,30) with other codes, underscoring its relative isolation. This confirms that explicit planning for transformational uses of technology remains uncommon, even among teachers who articulate transformational beliefs.
Hierarcichal Clustering of Codes
Hierarchical agglomerative clustering (Table 4) further supports these findings. The closest linkage emerged between Ab and Aa (similarity = 0,774), followed by their merger with Tb, indicating frequent co-occurrence of amplification-oriented beliefs, actions, and emerging transformational perspectives. A separate cluster linked Ap with Ra, reflecting functional overlap between planning for enhancement and enactment of substitution.
Table 4
Hierarchical Agglomerative Clustering Results Based on Jaccard Similarity Between RAT Model Codes in QDA Miner Project.
| NODE | GROUP 1 | GROUP 2 | SIMILARITY |
|---|---|---|---|
| 1 | Amplification (action) | Amplification (belief) | 0,774 |
| 2 | Node 1 | Transformation (belief) | 0,581 |
| 3 | Amplification (planned) | Replacement (action) | 0,522 |
| 4 | Node 2 | Node 3 | 0,491 |
| 5 | Node 4 | Transformation (action) | 0,428 |
| 6 | Replacement (planned) | Transformation (planned) | 0,400 |
| 7 | Node 5 | Replacement (belief) | 0,393 |
| 8 | Node 7 | Node 6 | 0,304 |
These clusters merged gradually, with decreasing similarity values, suggesting the presence of two overarching conceptual patterns:
a belief- and enhancement-oriented cluster centered on amplification, and
a more fragmented cluster involving replacement and selective transformation, particularly at the planning and action levels.
Case Similarity Across Teachers and Disciplines
To compare disciplinary patterns while accounting for unequal group sizes, a case similarity analysis based on interview data was conducted across all 31 teachers (Table 5). Chemistry teachers demonstrated the highest internal similarity, with most case pairs showing near-perfect alignment. Physics teachers also exhibited strong internal coherence, while biology teachers displayed greater heterogeneity, with similarity values ranging from 0,50 to 1,00.
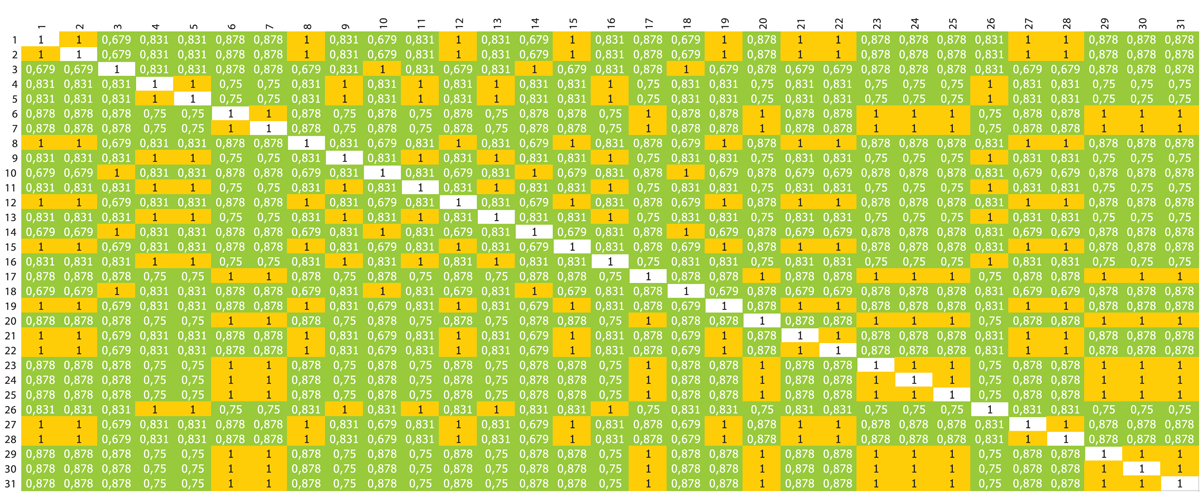
Table 5
Case Similarity Table Across the Entire Sample of Science Teachers (N = 31) Based on Interviews and RAT Model Categories.
Cross-disciplinary similarities were generally below 0,75, indicating limited overlap between subject groups and reinforcing the influence of disciplinary context on how teachers conceptualize and enact technology integration.
Agglomerative clustering of cases (Table 6) further illustrates these patterns. Chemistry cases merged rapidly at the highest similarity levels, followed by physics and then biology cases. Divergence increased at later stages of clustering, reflecting discipline-specific pedagogical emphases and contextual differences in technology use.
Table 6
The Agglomeration Results from the Interview-Based Case Similarity Analysis.
| NODE | GROUP 1 | GROUP 2 | SIMILARITY |
|---|---|---|---|
| 1 | 5 | 6 | 1 |
| 2 | 29 | Node 1 | 1 |
| 3 | 28 | Node 2 | 1 |
| 4 | 26 | Node 3 | 1 |
| 5 | 23 | 4 | 1 |
| 6 | 22 | Node 4 | 1 |
| 7 | 21 | 25 | 1 |
| 8 | 20 | Node 5 | 1 |
| 9 | Node 8 | Node 6 | 1 |
| 10 | 19 | Node 8 | 1 |
| 11 | 18 | Node 7 | 1 |
| 12 | 17 | Node 10 | 1 |
| 13 | 16 | Node 11 | 1 |
| 14 | 13 | Node 12 | 1 |
| 15 | 12 | Node 14 | 1 |
| 16 | 11 | Node 11 | 1 |
| 17 | 10 | Node 13 | 1 |
| 18 | Node 17 | Node 17 | 1 |
| 19 | Node 16 | Node 15 | 0,75 |
| 20 | Node 19 | Node 19 | 0,568 |
| 21 | Node 20 | Node 12 | 0,5 |
| 22 | Node 19 | Node 21 | 0,5 |
| 23 | 31 | Node 22 | 0,5 |
| 24 | 30 | Node 23 | 0,5 |
| 25 | Node 24 | Node 24 | 0,5 |
| 26 | 27 | Node 25 | 0,5 |
| 27 | 24 | Node 26 | 0,5 |
| 28 | 15 | Node 27 | 0,5 |
| 29 | 14 | Node 28 | 0,5 |
| 30 | Node 29 | Node 29 | 0,5 |
Contextual Influences on Rat Practices
In search of answers to the second research RQ2 question, a Cross-tabulation analysis was conducted using QDA Miner software, where all RAT codes and additional codes: Technological infrastructure; Institutional support; University training; Continuing Professional Development and Self-study, and Exchange between colleagues, were dependent variables, while school size, type of settlement, and teaching experience were independent variables.
Cross-tabulation by school size (Table 7) shows small-school teachers contribute a disproportionately high share of RAT codes (e.g., Transformation belief Tb = 70%, Amplification belief Ab = 64,5%) despite representing only 13% of the sample (Table 1). Large schools (64,5% of teachers) contribute fewer codes. This discrepancy likely reflects differences in teacher responsibilities and reporting intensity. Teachers in small schools often manage multiple roles and may report more examples of technology integration per person. Conversely, in large schools, digital tasks may be distributed among staff, producing fewer coded segments per teacher. Additionally, small schools show high percentages in institutional support (74,1%) and infrastructure (65,5%), which could facilitate RAT practices, suggesting that observed differences are influenced by resource allocation rather than school size alone.
Table 7
Cross-tab Analysis of RAT Model and Other Codes Against School Size.
| CODE | SMALL-SIZED SCHOOL, % | MIDDLE-SIZED SCHOOL, % | LARGE-SIZED SCHOOL, % |
|---|---|---|---|
| Rb | 57,1 | 28,6 | 14,3 |
| Ab | 64,5 | 22,6 | 12,9 |
| Tb | 70,0 | 30,0 | 0,0 |
| Rp | 64,3 | 21,4 | 14,3 |
| Ap | 44,4 | 38,9 | 16,7 |
| Tp | 57,1 | 42,9 | 0,0 |
| Ra | 47,1 | 35,3 | 17,6 |
| Aa | 58,3 | 29,2 | 12,5 |
| Ta | 64,3 | 28,6 | 7,1 |
| Technological infrastructure | 65,5 | 20,7 | 13,8 |
| Institutional support | 74,1 | 18,5 | 7,4 |
| University training | 75,0 | 18,8 | 6,3 |
| CPD of teachers | 60,7 | 25,0 | 14,3 |
| Self-learning and peer exchange | 67,9 | 21,4 | 10,7 |
By settlement type (Table 8), teachers in provincial cities dominate belief-focused codes (Rb = 71,4%, Ab = 67,7%, Tb = 65%), reflecting access to formal training (university education 75%) and institutional support (66,7%). Teachers in villages, though fewer, show relatively higher action-focused codes (Ta = 28,6%) and greater reliance on self-learning and peer exchange (21,4%), indicating that practical RAT engagement may compensate for limited infrastructure and formal CPD. Town teachers occupy an intermediate position. These patterns highlight confounding effects of resources, leadership, and CPD access on RAT adoption, cautioning against attributing differences solely to settlement type.
Table 8
Cross-tab Analysis of RAT Model and Other Codes Against Settlement Type.
| CODE | PROVINCIAL CITY, % | TOWN, % | VILLAGE, % |
|---|---|---|---|
| Rb | 71,4 | 7,1 | 21,4 |
| Ab | 67,7 | 12,9 | 19,4 |
| Tb | 65,0 | 15,0 | 20,0 |
| Rp | 64,3 | 14,3 | 21,4 |
| Ap | 61,1 | 16,7 | 22,2 |
| Tp | 57,1 | 28,6 | 14,3 |
| Ra | 58,8 | 17,6 | 23,5 |
| Aa | 66,7 | 12,5 | 20,8 |
| Ta | 64,3 | 7,1 | 28,6 |
| Technological infrastructure | 69,0 | 13,8 | 17,2 |
| Institutional support | 66,7 | 14,8 | 18,5 |
| University training | 75,0 | 18,8 | 6,3 |
| CPD courses | 64,3 | 14,3 | 21,4 |
| Self-learning and peer exchange | 64,3 | 14,3 | 21,4 |
Teaching experience (Table 9) further shapes RAT practices. Novice teachers (<5 years, 19,4%, Table 1) show high engagement in planned transformation (Tp = 42,9%) but limited amplification or replacement, suggesting experimentation enabled by recent CPD exposure. Mid-career teachers (6–20 years, 25,8% combined, Table 1) show mixed patterns, though small numbers make percentages sensitive to single contributions. Veteran teachers (≥21 years, 48,4%, Table 1) dominate belief-focused codes and institutional support–related codes, consistent with consolidated enhancement-level integration. Resource access and structured CPD likely reinforce these patterns, indicating that observed differences reflect both experience and systemic support.
Table 9
Cross-tab Analysis of the RAT Model and Other Codes Against Years of Service.
| CODE | YEARS OF SERVICE | |||
|---|---|---|---|---|
| <5 | 6–10 | 11–20 | >20 | |
| Rb | 7,1% | 21,3% | 28,4% | 42,6% |
| Ab | 16,0% | 16,0% | 32,0% | 35,2% |
| Tb | 10,0% | 15,0% | 25,0% | 50,0% |
| Rp | 14,2% | 21,3% | 42,6% | 21,3% |
| Ap | 16,8% | 5,6% | 44,8% | 33,6% |
| Tp | 42,9% | 14,3% | 42,9% | 0,0% |
| Ra | 23,6% | 5,9% | 41,3% | 29,5% |
| Aa | 12,6% | 16,8% | 33,6% | 37,8% |
| Ta | 7,1% | 7,1% | 56,8% | 28,4% |
| Technological infrastructure | 13,6% | 17,0% | 34,0% | 34,0% |
| Institutional support | 18,5% | 18,5% | 29,6% | 33,3% |
| University training | 18,9% | 6,3% | 37,8% | 37,8% |
| PD courses | 18,0% | 14,4% | 36,0% | 32,4% |
| Self-learning and peer exchange | 14,4% | 18,0% | 32,4% | 36,0% |
RAT practices appear shaped by a complex interplay of school size, settlement type, teacher experience, and structural supports. Observed differences in code distribution may reflect not only individual engagement but also contextual confounders such as infrastructure, leadership, and access to CPD, emphasizing caution in generalizing results.
Conclusion, Implications and Suggestions
The analysis shows that Amplification dominates science teachers’ beliefs, planning, and classroom practices, with all participants expressing Amplification-level beliefs and most translating them into practice. In contrast, transformational uses are far less evident, suggesting a gap between aspirations for pedagogical innovation and its implementation in lesson planning or in the classroom. This misalignment is most pronounced in planning, where transformational practices remain rare and are weakly linked to teachers’ stated beliefs.
Physics teachers exhibit the strongest belief–practice alignment at the transformational level, Biology teachers display the largest belief–action gap, and Chemistry teachers, despite high transformational beliefs, show no corresponding evidence in planning. Overall, the results indicate that teachers’ beliefs and practices align most closely at the amplification level, while transformational integration remains aspirational rather than systematically realized.
RAT practices in this particular sample of 31 science teachers appear to be shaped by a combination of school size, settlement type, and teacher experience, alongside the availability of structural supports. Small schools, despite representing only 13% of participants (4 teachers), contribute a disproportionately high number of RAT codes, possibly because teachers take on multiple roles and share more detailed accounts of their practices. In contrast, teachers in large schools (20 teachers, 64,5%) contribute fewer codes per person. Teachers in provincial cities (20 teachers, 65%) are most prominent in belief-focused RAT codes, likely reflecting greater access to institutional support, formal training, and technological resources, whereas teachers in towns and villages rely more on self-directed learning and peer collaboration to enact RAT practices in their classrooms.
Early-career teachers (≤5 years) are in the minority; they make up less than a fifth of all participants. Their higher reliance on action-oriented transformation (Tp at 42,9%) and on self-learning matches expectations for younger teachers, but the group size is moderate, so it’s valid, but not as strong as the veterans’ patterns. Mid-career teachers (6–10 years, 16,1%) and especially those with 11–20 years (9,7%) are very small groups. Their share in the coding may vary considerably, as they represent only a few cases. For example, the peak of Ta (56,8%) in the 11–20 years group should be interpreted very cautiously. Overall, the analysis indicates a clear divide between veteran teachers, who consolidate belief-based integration, and newer teachers, who are more open to transformative practices, with mid-career patterns less conclusive due to sample size.
The results indicate that Amplification is the primary approach to technology integration utilized by science teachers, influencing their beliefs, lesson design, and classroom behaviors. Although almost all participants demonstrate beliefs aligned with amplification and frequently put them into practice, transformational practices are still uncommon and mainly aspirational, particularly during the planning phase. This ongoing belief–practice divide indicates that educators recognize the potential of technology for innovation in teaching but may lack the necessary resources or structural backing to consistently implement it in their work. Differences specific to subjects bolster this trend: physics educators demonstrate greater alignment at the transformational phase, biology educators reveal the largest disparity between beliefs and actions, while chemistry educators possess strong transformational beliefs but show minimal evidence of implementation in planning. These findings should not be generalized regarding possible limitations.
Contextual elements significantly influence these trends. Major educational institutions and urban provincial settings favor belief-driven integration, bolstered by institutional training, university education, and technological resources. In comparison, small schools, towns, and villages, despite having limited resources, show greater percentages of practice-focused codes, with educators depending on CPD courses, peer sharing, and independent learning. A study on the relation of CPD of Bulgarian teachers and their digital competences reveals ”positive but not very high evaluations of the degree to which they have developed basic aspects of their digital competence as a result of the training courses” (Mizova et al., 2021). This duality indicates that contexts rich in resources might limit integration to theoretical dimensions, whereas resource-scarce settings encourage teachers to adopt adaptable strategies. Nonetheless, the disparity in coded segments among various school sizes and settlement types warns against making broad assumptions, as variations in communication style or distribution of responsibility might also influence the outcomes.
Teaching experience adds further depth to the findings. Experienced educators (≥20 years, nearly half of the sample) integrate enhancement-level applications and depend significantly on institutional resources, influencing the predominant trends of the research. Educators in the initial phases of their careers (≤5 years) demonstrate a stronger inclination towards transformative practices, often linked to self-directed learning and collaboration with colleagues, though the small size of their group somewhat lessens the importance of this finding. Mid-career teachers, who are less numerous, produce less reliable patterns and require careful examination. This may generally highlight a generational divide: experienced educators uphold belief-based integration, while their younger peers are more receptive to experimentation and changes at the action level.
These observations emphasize multiple consequences. Professional development must extend beyond enhancing amplification to actively create avenues for transformation, particularly by narrowing the divide between beliefs and implemented planning. Support should be tailored to the context: larger, well-resourced schools might need motivation to go beyond conceptual integration, whereas smaller, resource-limited schools require institutional and infrastructural backing to maintain their adaptive methods. Ultimately, mentoring frameworks that combine experienced teachers’ institutional insights with newcomers’ willingness to change could help reconcile stability with innovation.
Limitations
The choice of a theoretical model (the RAT model in this case) foregrounds certain dimensions of technology integration (replacement, amplification, transformation) while potentially overlooking others (e.g., teacher beliefs).
Observations of only one lesson per teacher limit the validity of classroom-level conclusions. Despite efforts to minimize disruption, the presence of an observer may have affected teachers’ behavior and possibly increased their use of digital tools (“observer effect”).
Data Accessibility Statement
The datasets presented in this article are not readily available, as they are part of an ongoing study. Requests for access to the datasets should be directed to the lead researcher of the project SUMMIT DigEdu-SU (European Union–NextGenerationEU, through the National Recovery and Resilience Plan of the Republic of Bulgaria, project No. BG-RRP-2.004-0008), Prof. Dr. Roumiana Peytcheva-Forsyth (r.peytcheva@fp.uni-sofia.bg). An anonymized codebook necessary to verify the findings of this article may be obtained from the corresponding author upon reasonable request.
Sustainable Development Goals (SDGs)
This study is linked to the following SDG(s): Quality education (SDG 4) and Partnerships for the goals (SDG 17).
Ethics and Consent
The study was conducted in accordance with the Code of Ethics and was approved by the Ethics Committee of Sofia University St. Kliment Ohridski (protocol No. 93-P-289/19 December 2023).
Author Contributions (CRediT)
Ivelina Kotseva: Conceptualization, Data collection, Data curation, Visualization, Writing—original draft preparation; Roumiana Peytcheva-Forsyth: Supervision, Project administration, Software, Funding acquisition, Writing—review; Maya Gaydarova: Literature, Investigation, Validation; Elena Boyadzhieva: Data Collection, Methodology; Isa Hadjiali: Data Collection, Methodology. All authors have read and agreed to the published version of the manuscript.