
Table 1
Profile of respondents.
| DEMOGRAPHIC FACTORS | CATEGORIES | FREQUENCY | PERCENTAGE (%) |
|---|---|---|---|
| Gender | Female | 259 | 59.8 |
| Male | 174 | 40.1 | |
| Age | 20–29 | 50 | 11.5 |
| 30–39 | 344 | 79.4 | |
| 40–49 | 24 | 5.5 | |
| Above 50 | 15 | 3.4 | |
| Educational level | Bachelor | 253 | 58.4 |
| Master | 146 | 33.7 | |
| PhD | 34 | 7.8 | |
| Type of institution | Public | 276 | 63.7 |
| Private | 157 | 36.3 | |
| Teaching experience | Less than 5 years | 102 | 23.6 |
| 5–10 years | 168 | 38.8 | |
| 11–15 years | 95 | 21.9 | |
| More than 15 years | 68 | 15.7 | |
| Region | East | 216 | 50 |
| Central | 95 | 22 | |
| West | 87 | 20 | |
| Northeast | 35 | 8 |
Table 2
Measurement items.
| CONSTRUCTS | ITEMS | INSTRUMENT | SOURCES |
|---|---|---|---|
| Perceived ease of use | PEOU1 | I find it easy to master and use AIGC technology in teaching activities | (Davis, 1989) |
| PEOU2 | The user interface of AIGC technology is intuitive and easy for me | ||
| PEOU3 | Using AIGC technology in teaching requires little mental effort | ||
| Perceived usefulness | PU1 | Using AIGC technology in teaching makes it easier for me to create instructional materials | (Davis, 1989) |
| PU2 | Using AIGC technology has enhanced my teaching skills and educational knowledge | ||
| PU3 | AIGC technology can save my time and improve efficiency in teaching | ||
| Attitude | AT1 | AIGC technology makes teaching more interesting | (Teo et al., 2009) |
| AT2 | Teaching with AIGC technology is fun | ||
| AT3 | I like using AIGC technology | ||
| Satisfaction | SAT1 | I am satisfied with my experience using AIGC technology in education | (Spreng & Olshavsky, 1993) |
| SAT2 | I am satisfied with the functions of AIGC technology in education | ||
| SAT3 | I am satisfied with the overall use of AIGC technology in education | ||
| Continuance intention to use | CITU1 | I intend to use AIGC technology frequently in my future teaching | (Bhattacherjee, 2001) |
| CITU2 | I plan to use AIGC technology regularly in my teaching practice in the future | ||
| CITU3 | I would strongly recommend AIGC technology in education to others | ||
| Flow experience | FLO1 | Using AIGC technology in education makes me fully immersed in the activity. | (Jackson & Marsh, 1996) |
| FLO2 | When using AIGC in education, I become so engaged that I lose track of time | ||
| FLO3 | When I use AIGC in teaching, I feel deeply focused and absorbed | ||
| Confirmation | CON1 | AIGC technology in education performed better than expected | (Bhattacherjee, 2001) |
| CON2 | AIGC technology in education is more interesting than I expected | ||
| CON3 | AIGC technology in education met my expectations |
Table 3
Measurement model assessment.
| CONSTRUCTS | ITEMS | LOADINGS | CR | AVE |
|---|---|---|---|---|
| Perceived ease of use | PEOU1 | 0.895 | 0.896 | 0.742 |
| PEOU2 | 0.840 | |||
| PEOU3 | 0.847 | |||
| Perceived usefulness | PU1 | 0.857 | 0.895 | 0.739 |
| PU2 | 0.840 | |||
| PU3 | 0.881 | |||
| Attitude | AT1 | 0.884 | 0.915 | 0.781 |
| AT2 | 0.897 | |||
| AT3 | 0.871 | |||
| Satisfaction to use | SAT1 | 0.922 | 0.944 | 0.850 |
| SAT2 | 0.924 | |||
| SAT3 | 0.920 | |||
| Continuance intention to use | CITU1 | 0.901 | 0.935 | 0.828 |
| CITU2 | 0.907 | |||
| CITU3 | 0.922 | |||
| Flow experience | FLO1 | 0.795 | 0.894 | 0.739 |
| FLO2 | 0.911 | |||
| FLO3 | 0.868 | |||
| Confirmation | CON1 | 0.923 | 0.938 | 0.835 |
| CON2 | 0.899 | |||
| CON3 | 0.920 |
Table 4
Discriminant validity (HTMT).
| DISCRIMINANT VALIDITY (HTMT) | |||||||
|---|---|---|---|---|---|---|---|
| CITU | CON | FLO | AT | PEOU | PU | SAT | |
| CITU | |||||||
| CON | 0.719 | ||||||
| FLO | 0.589 | 0.581 | |||||
| AT | 0.684 | 0.724 | 0.467 | ||||
| PEOU | 0.198 | 0.355 | 0.092 | 0.409 | |||
| PU | 0.621 | 0.640 | 0.413 | 0.784 | 0.375 | ||
| SAT | 0.669 | 0.573 | 0.560 | 0.623 | 0.202 | 0.579 | |
Table 5
CFA model fit indices.
| FIT INDEX | VALUE | RECOMMENDED THRESHOLD | EVALUATION |
|---|---|---|---|
| χ2 | 385.44 | – | – |
| df | 168 | – | – |
| χ2/df | 2.29 | <3.0 | Excellent |
| CFI | 0.964 | >0.95 | Excellent |
| TLI | 0.955 | >0.95 | Excellent |
| RMSEA | 0.055 | ≤0.06 | Close fit |
| SRMR | 0.053 | <0.08 | Good |
[i] Note: CFI = Comparative Fit Index; TLI = Tucker-Lewis Index; RMSEA = Root Mean Square Error of Approximation; SRMR = Standardized Root Mean Square Residual.
Table 7
Outer VIF results.
| VARIABLES | ITEMS | VIF |
|---|---|---|
| CITU | CITU1 | 2.511 |
| CITU2 | 2.735 | |
| CITU3 | 3.076 | |
| CON | CON1 | 3.098 |
| CON2 | 2.516 | |
| CON3 | 3.042 | |
| FLO | FLO1 | 2.225 |
| FLO2 | 2.977 | |
| FLO3 | 1.711 | |
| AT | AT1 | 2.062 |
| AT2 | 2.426 | |
| AT3 | 2.149 | |
| PEOU | PEOU1 | 2.185 |
| PEOU2 | 1.892 | |
| PEOU3 | 1.727 | |
| PU | PU1 | 1.836 |
| PU2 | 1.767 | |
| PU3 | 2.008 | |
| SAT | SAT1 | 3.134 |
| SAT2 | 3.224 | |
| SAT3 | 2.953 |
Table 8
Results of hypotheses testing.
| HYPOTHESES | RELATIONSHIPS | PATH COEFFICIENTS | T VALUES | P VALUES | INNER VIF | F2 | EFFECT SIZE | DECISION |
|---|---|---|---|---|---|---|---|---|
| H1 | CON→PU | 0.505 | 10.935 | 0.000 | 1.106 | 0.343 | Large | Supported |
| H2 | CON→SAT | 0.349 | 6.341 | 0.000 | 1.440 | 0.128 | Medium | Supported |
| H3 | FLO→CITU | 0.223 | 5.196 | 0.000 | 1.387 | 0.075 | Medium | Supported |
| H4 | FLO→AT | 0.220 | 5.559 | 0.000 | 1.154 | 0.084 | Medium | Supported |
| H5 | AT→CITU | 0.262 | 4.457 | 0.000 | 2.060 | 0.069 | Medium | Supported |
| H6 | PEOU→AT | 0.161 | 4.405 | 0.000 | 1.109 | 0.047 | Small | Supported |
| H7 | PEOU→PU | 0.156 | 3.507 | 0.000 | 1.106 | 0.033 | Small | Supported |
| H8 | PU→CITU | 0.139 | 2.610 | 0.009 | 1.867 | 0.021 | Small | Supported |
| H9 | PU→AT | 0.530 | 12.652 | 0.000 | 1.270 | 0.442 | Large | Supported |
| H10 | PU→SAT | 0.309 | 5.708 | 0.000 | 1.440 | 0.100 | Medium | Supported |
| H11 | SAT→CITU | 0.280 | 5.457 | 0.000 | 1.693 | 0.096 | Medium | Supported |
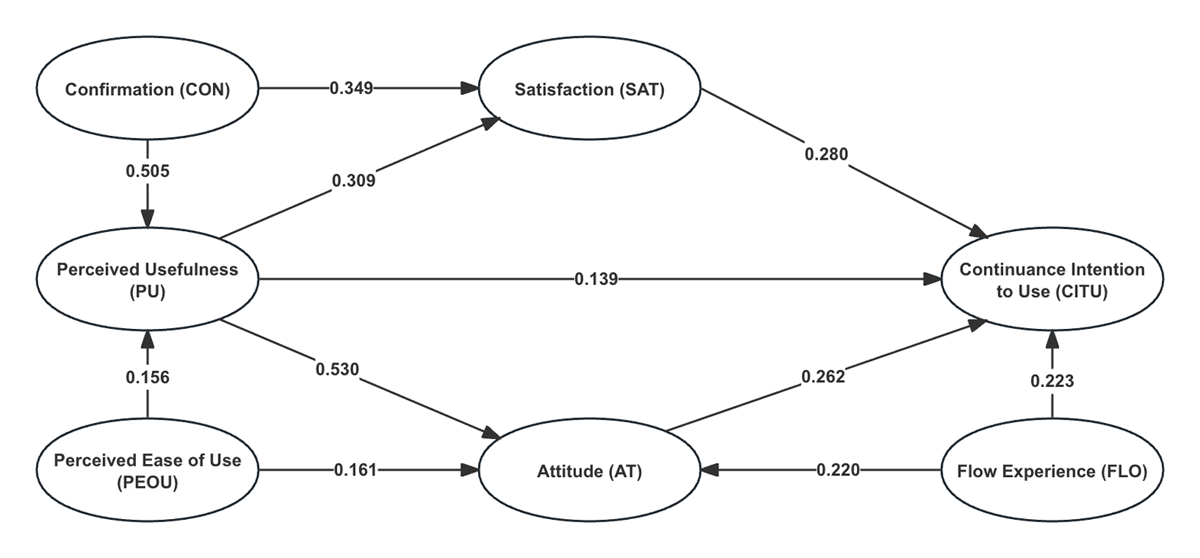
Figure 1
The research model (symmetric model).
Table 10
Analysis of necessary condition for CITU.
| HIGH CITU | LOW CITU | |||
|---|---|---|---|---|
| ANTECEDENTS | CONSISTENCY | COVERAGE | CONSISTENCY | COVERAGE |
| PEOU | 0.903 | 0.621 | 0.784 | 0.711 |
| ~PEOU | 0.579 | 0.670 | 0.582 | 0.888 |
| PU | 0.911 | 0.701 | 0.680 | 0.692 |
| ~PU | 0.600 | 0.587 | 0.707 | 0.913 |
| AT | 0.914 | 0.740 | 0.642 | 0.686 |
| ~AT | 0.612 | 0.564 | 0.757 | 0.921 |
| SAT | 0.782 | 0.845 | 0.500 | 0.712 |
| ~SAT | 0.733 | 0.526 | 0.891 | 0.844 |
| FLO | 0.690 | 0.860 | 0.443 | 0.729 |
| ~FLO | 0.782 | 0.516 | 0.914 | 0.795 |
| CON | 0.896 | 0.797 | 0.575 | 0.675 |
| ~CON | 0.634 | 0.531 | 0.827 | 0.913 |
Table 11
Sufficient configurations for CITU and ~CITU.
| CITU | ~CITU | |||||
|---|---|---|---|---|---|---|
| CONFIGURATION | PATH 1 | PATH 2 | PATH 3 | PATH 1 | PATH 2 | |
| PEOU | ⦁ | ~PEOU | • | |||
| PU | ⦁ | • | ~PU | • | • | |
| AT | • | ⦁ | • | ~AT | ⦁ | • |
| SAT | • | • | ~SAT | • | • | |
| FLO | • | ⦁ | ~FLO | • | • | |
| CON | • | ⦁ | • | ~CON | ⦁ | |
| Consistency | 0.933 | 0.945 | 0.967 | 0.825 | 0.810 | |
| Raw coverage | 0.705 | 0.632 | 0.573 | 0.005 | 0.005 | |
| Unique coverage | 0.122 | 0.049 | 0.009 | 0.003 | 0.003 | |
| Overall consistency | 0.918 | 0.815 | ||||
| Overall coverage | 0.764 | 0.009 | ||||
[i] Note: •denotes the presence of a condition, ⦁denotes the marginal presence of a condition. Blank spaces indicate the condition may be either present or absent.
Raw coverage = outcome share explained by a configuration, unique coverage = outcome share exclusively explained by a configuration.