
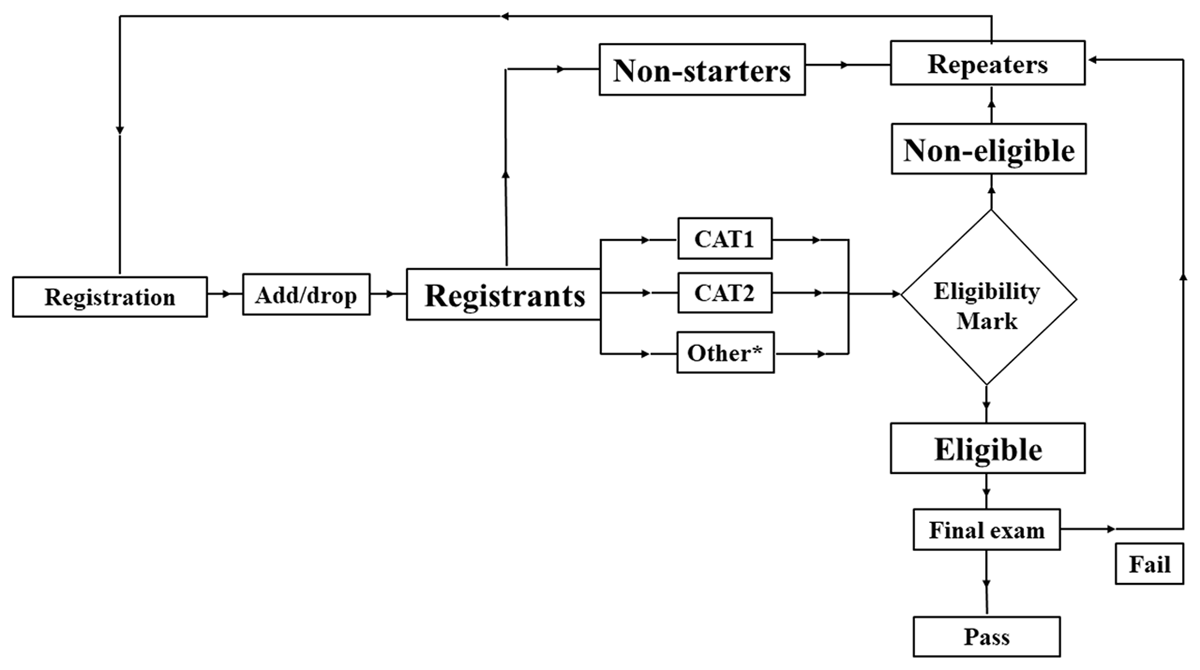
Figure 1
Identification of student groups: registrants, non-starters, non-eligible students, eligible students. *Other evaluations may include practical tests, quizzes in practical sessions or field trip reports.
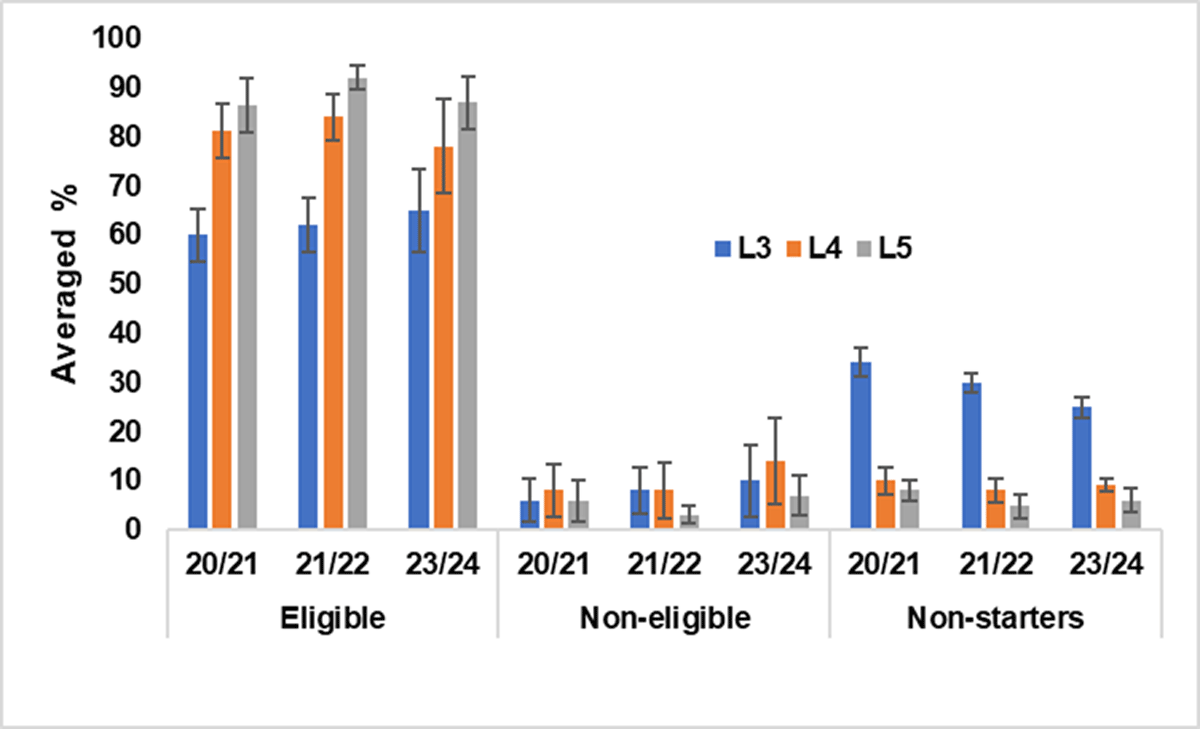
Figure 2
The percentage of each student category (eligible, non-eligible, and non-starters) with respect to the total number of registrants under each study level for the three recent academic years. Error bars indicate values.
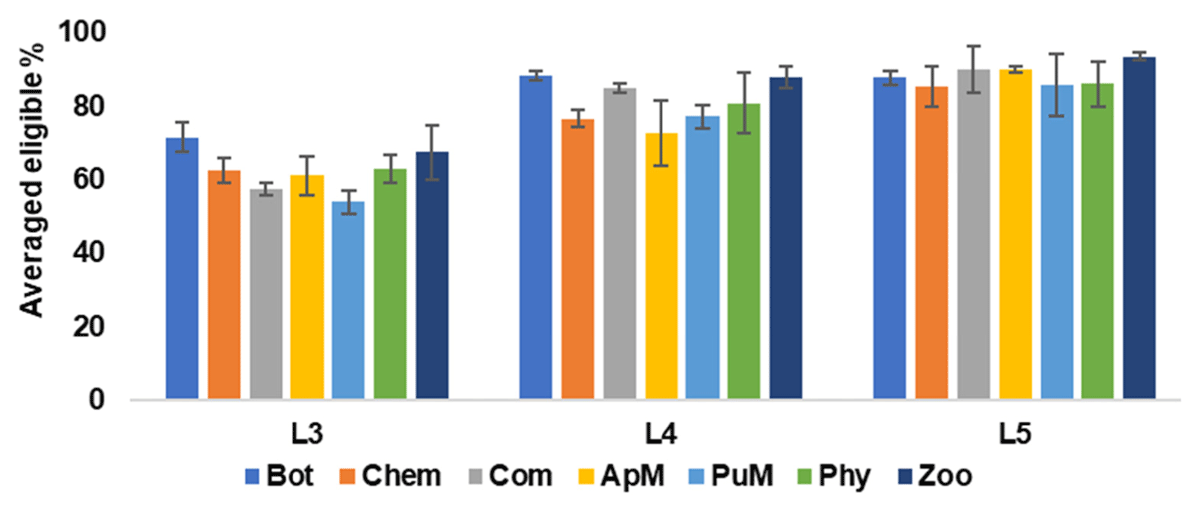
Figure 3
Averaged percentages of eligible students with respect to the number of registrants of each subject area. Error bars indicate SD values.
Table 1
Sample demographics.
| UNAFFECTED STUDENTS | DEMOTIVATED STUDENTS | TOTAL | |||||
|---|---|---|---|---|---|---|---|
| % | % | % | |||||
| Total | 209 | 113 | 322 | 100 | |||
| Gender | Male | 54 | 26 | 34 | 30 | 88 | 27 |
| Female | 154 | 74 | 79 | 70 | 233 | 72 | |
| Age | 19–29 y | 161 | 77 | 94 | 83 | 255 | 79 |
| 30–39 y | 39 | 19 | 16 | 14 | 55 | 17 | |
| 40–49 y | 8 | 4 | 3 | 3 | 11 | 3 | |
| ≥50 y | 1 | 0 | 0 | 0 | 1 | 0 | |
| Civil Status | Single | 166 | 79 | 82 | 73 | 248 | 77 |
| Married | 43 | 21 | 31 | 27 | 74 | 23 | |
| Employment | Unemployed | 112 | 54 | 45 | 40 | 157 | 49 |
| Government | 38 | 18 | 20 | 18 | 58 | 18 | |
| Semi-gov. | 7 | 3 | 5 | 4 | 12 | 4 | |
| Private | 36 | 17 | 31 | 27 | 67 | 21 | |
| Self-employ. | 16 | 8 | 12 | 11 | 28 | 9 | |
| Regional Center | ARC | 4 | 2 | 1 | 1 | 5 | 2 |
| BaRC | 2 | 1 | 2 | 2 | 4 | 1 | |
| BRC | 9 | 4 | 1 | 1 | 10 | 3 | |
| CRC | 115 | 55 | 61 | 54 | 176 | 55 | |
| JRC | 9 | 4 | 8 | 7 | 17 | 5 | |
| KRC | 45 | 22 | 30 | 27 | 75 | 23 | |
| KuRC | 9 | 4 | 5 | 4 | 14 | 4 | |
| MRC | 15 | 7 | 3 | 3 | 18 | 6 | |
| RRC | 1 | 0 | 2 | 2 | 3 | 1 | |
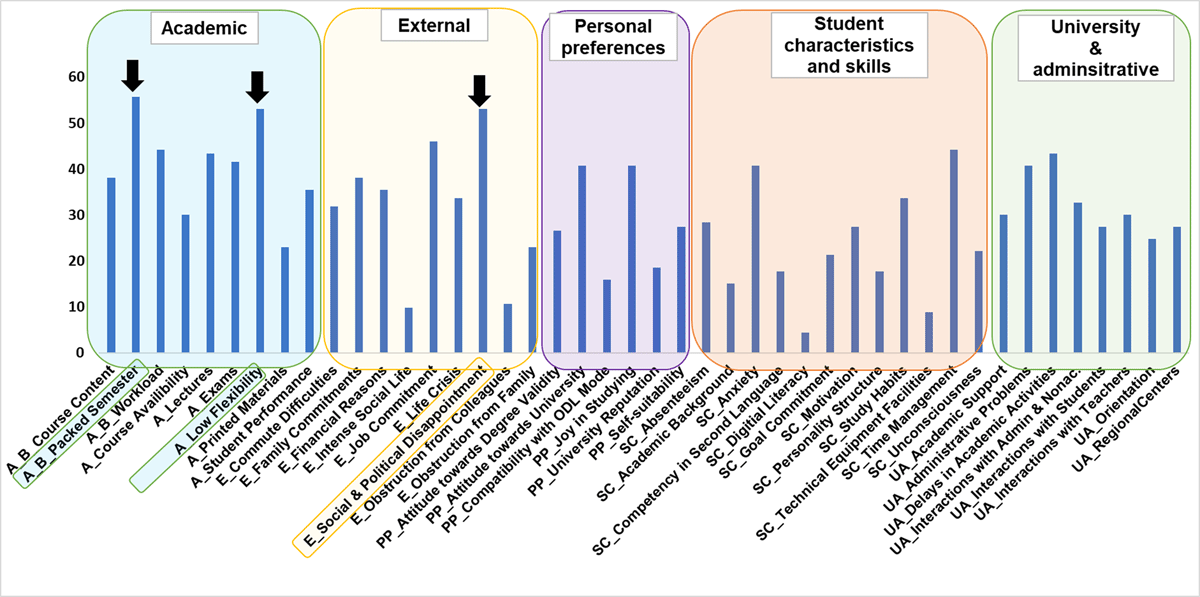
Figure 4
The percentages of cumulative frequencies of “strong influence” and “very strong influence” responses. Black arrows indicate the top three factors.
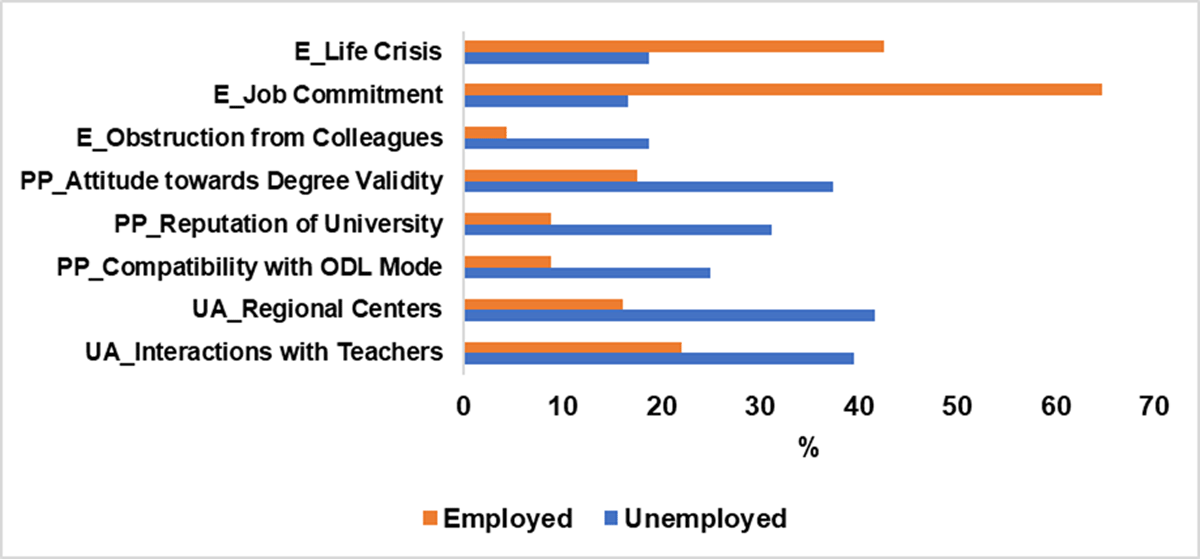
Figure 5
Variation of demotivational factors depending on employment status. The percentages of cumulative frequencies of “strong influence” and “very strong influence” responses are shown.
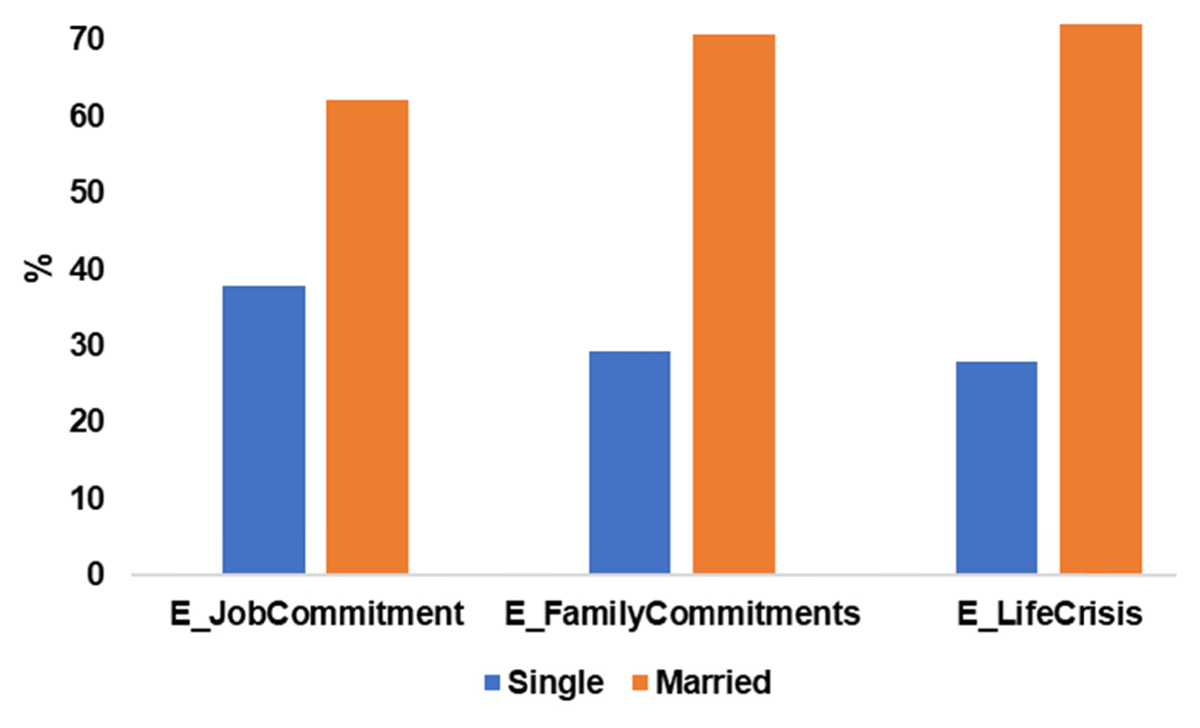
Figure 6
Variation of demotivational factors depending on the civil status. The percentages of cumulative frequencies of “strong influence” and “very strong influence” responses are shown.
Table 2
Motivational factors mentioned by the students when asked, “What motivated you to continue your studies at OUSL successfully?”.
| CATEGORY | MOTIVATIONAL FACTOR | CODE FREQUENCIES |
|---|---|---|
| Academic | Flexibility, ability to study part-time | 13 |
| Structure of the programme, Study Materials | 08 | |
| Student Performance – good results in L3 | 06 | |
| Online learning system, online lectures | 05 | |
| University and Administrative | Academic Support | 16 |
| Interactions with Teachers | 7 | |
| Orientation, PASS, or EfIL programme | 3 | |
| University facilities: library, laboratories, etc. | 3 | |
| Interactions with Admin and Non-academic staff | 2 | |
| No delays in Academic Activities | 2 | |
| Student societies such as Zoonet, BotSoc, etc. | 2 | |
| Regional Center facilities | 1 | |
| (Student) Skills and characteristics | Goal Commitment | 57 |
| Personality Structure – determination, desire to make the family happy, etc. | 8 | |
| Self-motivation | 6 | |
| (Student) Personal Preferences | ODL Mode, self-study mode | 17 |
| Joy in Studying | 15 | |
| Self-suitability – to change career pathway and for promotion | 11 | |
| Attitude towards Degree Validity | 07 | |
| Reputation of the University | 02 | |
| External | Support from Colleagues and family | 11 |
| Low cost of the degree | 10 | |
| Because parents paid for the degree | 05 | |
| Alumni success stories | 02 | |
| Social and Political Disappointment of the country | 01 | |
| Other Opportunities | Opportunity for higher studies or a good career.There is no chance of getting into a conventional government university | 11 |