
Introduction
Open and distance learning (ODL) has seen a considerable increase in enrollment due to its flexibility and accessibility, making it a viable option for many learners worldwide. However, research indicates that, in general, only about 15% of students in open universities complete their degrees, underscoring a critical gap between enrollment rate and persistence rate (Shaikh & Asif, 2022). Despite the many benefits it offers, ODL faces a significant challenge, the notably lower completion rates compared to general, conventional education.
Persistence and retention, while closely related, are distinct concepts in the context of Open and Distance Education (Yorke, 2004). Retention primarily focuses on an institution’s ability to keep students enrolled in their programs. In contrast, persistence emphasizes the students’ ongoing commitment and determination to continue their education despite facing various challenges and obstacles. A student may be retained within an education program for years due to the flexibility of the program and provisions given by the institute, yet unable to perform well academically hence to complete the program. Thus, one who is interested in increasing the completion rates in ODL programs should be focused more on enhancing student persistence rather than retention. Various factors such as time management, academic preparedness, and institutional support have been identified as significant contributors to student persistence in ODL environments (Bean & Metzner, 1985; Hartnett et al., 2011; Shaikh & Asif, 2022). The ultimate decision of a student who struggles to persist within a study program would .be dropping out. Further, student persistence in ODL is a complicated and dynamic phenomenon, that can be region or institution specific, thus frequent investigations are needed to identify the reasons behind low persistent rates and mitigation measures must be implemented by the institutions.
This study attempts to identify the whole spectrum of the potential challenges that may affect student persistence in ODL using the Bachelor of Science degree offered by the Open University of Sri Lanka (OUSL) as the sample. The study comprises two main phases: 1. Student performance and retention analysis which is conducted using the statistics available in the Open University Management Information System (OMIS). 2. Quantitative data of the demotivational factors and qualitative data about the students’ perceptions, encountered by the persistent students is collected via an online questionnaire survey and analyzed using SPSS statistical software.
Literature Review
Student persistence generally refers to continuous engagement of a student in an educational program until completion. It involves various factors that influence a student’s ability to remain in an enrolled program. As per previous studies (Bean, 1980; Braxton, 2000; Feldman & Astin, 1994; Hart, 2012; Kuh et al., 2019; Tinto, 1975) academic support, financial stability, personal motivation, institutional resources, and social integration are some key factors identified as influences on student persistence. When in the context of ODL, in which students often face unique challenges, student persistence is particularly an intricate concept (Feldman & Astin, 1994; Hart, 2012; Tinto,1975). A wide range of interpretations for student persistence can be found in related literature. Tinto states that “Students who find themselves unable to integrate into the academic and social life of the institution are more likely to depart” (Tinto, 1975, p. 94). According to another study “the greater the student’s involvement in college, the greater will be the amount of student learning and personal development” (Feldman & Astin, 1994) which emphasizes the student involvement to remain persist. Hart states that intrinsic motivation, where students find personal satisfaction in their learning, significantly contributes to their ability to persist (Hart, 2012, p. 23). The present study also adapts the same meaning on student persistence as, students’ ability or continuous and determined effort to remain enrolled in and complete their educational programs despite various challenges and obstacles they are facing. This covers students’ capacity to overcome difficulties, maintain motivation, and stay committed to their educational goals over time (Tinto, 1993).
Recent research has explored the complex nature of student persistence in ODL, which is influenced by a plethora of factors involving a combination of individual, institutional, and instructional factors (Shaikh & Asif, 2022). Existing literature emphasizes either quantitative metrics (e.g., retention rates, grades) (Baik et al., 1994; Feldman & Astin, 1994; James et al., 2016; Lee & Choi, 2011) or qualitative insights (Hart, 2012; Tinto, 1975) (e.g., student experiences, motivations) when gauging student persistence in ODL. Research has shown that college students with higher high-school GPAs (Grade Point Average) and higher SAT (scholastic aptitude test) scores are more likely to persist in the education institute (Feldman & Astin, 1994). Colleges with stricter admission standards tend to have the highest retention rates (Tinto, 1993). The quality of the learning environment, characterized by its engaging, interactive, and user-friendly nature, positively contributes to student satisfaction and persistence (Garrison et al., 2010; Kintu et al., 2017). On the other hand, schools with open enrollment policies, which are the least selective, usually have the lowest retention rates. The level of academic and social integration directly correlates with a student’s likelihood of persistence until graduation (Tinto, 1975) Because the level of a supportive learning community provides a sense of belonging (Rovai, 2003) and such factors are particularly significant in distance education, where in an environment that physical separation can lead to feelings of isolation and disconnection (Moore, 1993).
Moreover, Studies have highlighted the importance of self-regulation and motivation in student persistence (Carter et al., 2020; Hart, 2012; Park & Choi, 2009; Zimmerman, 2008). Students who are with effective managing capacities of their time, those who set realistic goals and maintain genuine motivation, and those who have support from family and employers are more likely to complete their courses (Brubacher & Silinda, 2019; Hart, 2012; Shillingford & Karlin, 2013). In contrast, dropouts often face challenges such as burdens from work and family responsibilities, as well as difficulty in maintaining focus and motivation in the absence of face-to-face interactions (Pearson, 2004). Furthermore, as recent studies suggest (Bağrıacık Yılmaz & Karataş, 2022; Ranasinghe et al., 2025), most of the significantly influential dropout factors are external or related to student characteristics and skills, thus beyond institutional control. However, the students who possess strong academic skills are more likely to succeed in ODL courses. Their academic performance, grades, and mastery of course content, directly influence a student’s likelihood to persist in an open and distance learning environment (Lee & Choi, 2011). However, the challenge of self-discipline and genuine motivation can be particularly subjective for many ODL learners. Institutional support also plays a vital role in student persistence (Hart, 2012). This not only includes academic support but also administrative support which comprises constant and clear communication with an efficient problem-solving approach (Brubacher & Silinda, 2019; Hart, 2012; Park & Choi, 2009; Shillingford & Karlin, 2013). The availability of resources such as remote access to libraries, discussion forums, and technical support also enhances the learning experience and encourage students to persist in their studies. Some studies have found that instructor characteristics also significantly impact student retention: Instructors who are responsive, capable of providing timely feedback, and foster a supportive study environment can (Baran et al., 2011; Shea et al., 2006) bring a positive influence on this.
By considering all the above-mentioned factors found in literature and potential regional or institute-specific factors, this study aims to provide a comprehensive understanding of the factors influencing student persistence at the Open University of Sri Lanka, with the goal of developing effective strategies to enhance student success.
Method
Research Method and Design
This study employed an exploratory sequential mixed methods design (Creswell & Plano Clark, 2023), to explore the demotivational factors encountered by persistent students who follow the Bachelor of Science General degree (BSc) offered by the Open University of Sri Lanka. This design begins with qualitative exploration to identify the potential demotivational factors, followed by the development of a quantitative analysis based on the initial qualitative findings. In the qualitative phase, in-person semi-structured interviews were conducted with 24 student participants and 14 instructors according to the methodology described in a recent study (Ranasinghe et al., 2025) to identify potential dropout factors/demotivational challenges. In the second phase of the research, an online survey was developed based on the outcomes of the qualitative analysis and literature. The survey link was distributed among the whole study population via e-mail and/or SMS. Responses were collected until the sample was statistically saturated. In addition, student retention statistics were also analyzed based on the student participation and their performance in subject-based courses of the same program.
Data Collection Tools
The contact information of registrants, their examination performances and the student retention data were obtained from the university IT division and the Dean’s office of the Faculty of Natural Sciences, respectively. A Google questionnaire was distributed among active students (who registered during 2016–2023) to collect demographics, academic details, and demotivational factors (if any) which can affect the persistence in the registered program. The data was analyzed using MS Excel and SPSS software.
Demographic details such as gender, age, civil status, and employment status, as well as other academic-related details such as registered center, language medium, subject combination, and extra-curricular activities at OUSL, were collected first. Then the participants were asked “Have you ever felt like dropping out at some point of your studentship?” and the students who said yes were further questioned to identify the reasons behind their demotivation. Forty-five demotivational factors were listed under six major categories (i.e. Academic, University and administrative, Student skills and characteristics, Student preferences, External, and Other opportunities). A Likert chart was provided to select applicable factors based on the degree of influence a certain factor has had on the persistence of their student life. The Likert scale was 0 to 3: 0 being no effect or very low influence, 1 being a low influence, 2 being a strong influence, and 3 being a very strong influence. The “Other opportunities” factor was evaluated separately as a multiple-choice question. Further, they were allowed to write (as an open-ended answer) any other factor/s relevant to them that is not listed in the questionnaire.
An open-ended question was asked to obtain details related to their inspiration to continue their studies. i.e., “What motivated you to continue your studies at OUSL successfully?” About 20% of the sample answered this question and all their responses were considered. The inductive approach was used to analyze the answers given for these questions: Initial codes were generated to assign each significant idea, and the coded data were examined for recurring themes, noting similarities, disparities, and variations in participants’ responses. Codes that relate to similar factors or issues were grouped together to gain a coherent perspective. The themes were adjusted, consolidated, or discarded if they were not aligned with the research objectives or if they overlap with other themes to create an organized set of themes that effectively represent the factors. The research methodology was developed based on the resent literature and publications (Creswell & Plano Clark, 2023; Elibol & Bozkurt, 2025; Miles & Huberman, 1994; Ranasinghe et al., 2025).
Sampling and Research Group
The students who have registered for the Bachelor of Science General degree (BSc) offered by the Open University of Sri Lanka for the latest academic structure (S1), which was initiated in 2016, are considered in this research as the study group. Within the six consecutive academic years considered (2016/2017, 2017/2018, 2019/2020, 2020/2021, 2021/2022, and 2023/2024), 7516 students have registered for the program. The academic years 2018/2019 and 2022/2023 were not conducted officially by the Faculty due to unavoidable country and pandemic situations. Out of the total number of registrants, 52% (3933) are active students who currently participate in the academic activities of the program, thus taken as the population of this study. The remaining 48% of the students (3583) identified as inactive students: 1002 non-starters – those who haven’t sat for any of the continuous assessments, 2120 potential dropouts – those who discontinued the studies midway but did not fall into the non-starter category, and 461 official dropouts – those who phased out after not registering for 5 consecutive academic years.
The BSc General degree comprises three levels similar to the academic years of conventional universities. These levels (L) are identified as (L): first year = L3, second year = L4, and third year = L5). Statistics of student participation and performance for each subject-based courses offered at each level were collected for the three latest academic years (2020/2021, 2021/2022, and 2023/2024). Courses are offered in six subject areas, namely, Botany (Bot), Chemistry (Chem), Computer Science (Com), Applied-Mathematics (ApM), Pure-Mathematics (PuM), Physics (Phy), and Zoology (Zoo). Each student follows three subject areas at L3, from which two are followed as major subjects in the upper levels, L4 and L5. Each course has an eligibility threshold, which qualifies a student to sit for the final examination (FE) of that particular course. The eligibility (Overall Continuous Assessment Marks- OCAM) is decided on how the students performed in the Continuous Assessment tests (CATs): a single-valued mark (usually a weighted average) is calculated based on the marks obtained for two or more CATs and/or practical examinations held during the semester/year. The eligibility mark (OCAM) is valid for two consecutive academic years to sit for the final exam in two attempts and if failed, the student has to re-register for the course as a repeating student. Furthermore, the students must re-register for a particular course as a repeat student, if unable to obtain the required eligibility mark. Accordingly, four major student groups were identified based on their participation/performance in each course, namely: registrants, non-starters, non-eligible students, and eligible students (Figure 1).
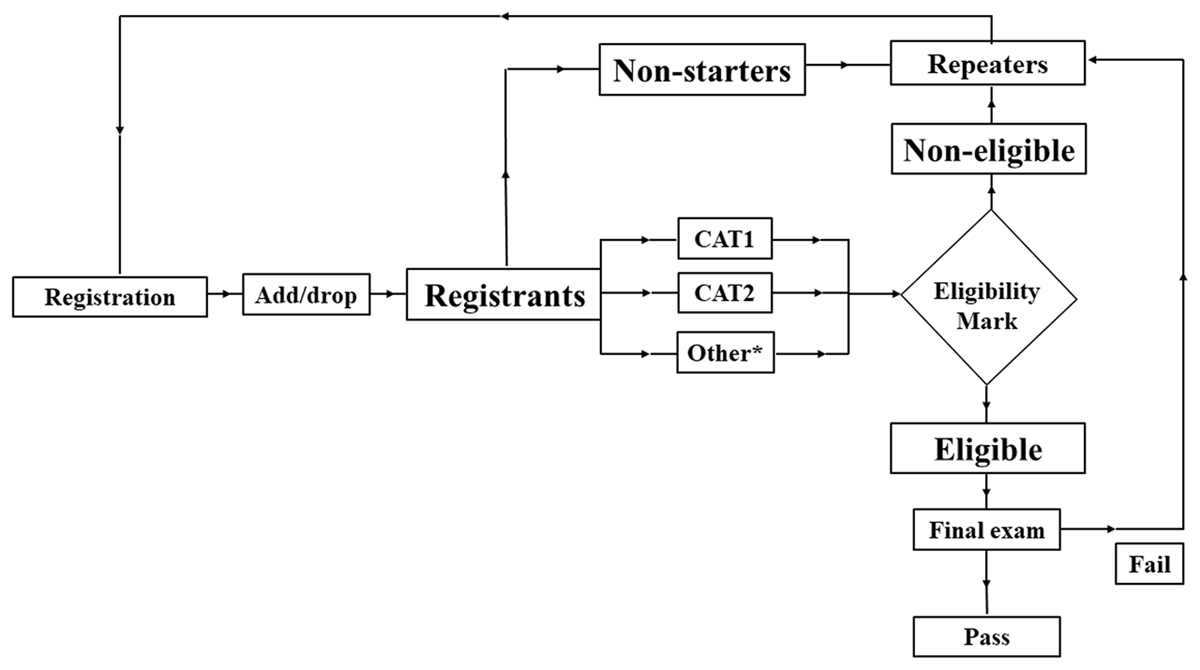
Figure 1
Identification of student groups: registrants, non-starters, non-eligible students, eligible students. *Other evaluations may include practical tests, quizzes in practical sessions or field trip reports.
Registrants are the students who remain in the course after the add/drop period, which is scheduled one month after the final date of registration.
Non-starters are the registrants who did not participate in any academic activities (or registrants who haven’t sat for any of the CATs). Since most of the academic activities including lectures (day schools) are not compulsory, the non-starters were identified based on their participation in CATs.
Non-eligible students are the registrants who sat for at least one CAT but did not obtain the eligibility mark.
Eligible students are the registrants who obtained the eligibility mark and are qualified to sit for the final exam
Reserach Procedure and Reliability Measures
The collected data were analyzed using SPSS software to examine mainly descriptive statistics. To determine if there were any statistically significant differences among student groups or demographic groups, the Mann-Whitney U test (if two independent groups) or Kruskal-Wallis H Test (if more than two independent groups) was used appropriately. These tests were used because the Kolmogorov-Smirnov normality test (p-value < 0.05), the distribution patterns of the histograms, skewness (|Skewness| > 1), and kurtosis tests (> 0 or < 0) confirmed that the collected data did not fit a normal distribution. These rank-based nonparametric tests were used as they are specifically established to analyze nonparametric ordinal scale data which do not fit a normal distribution. Statistical data is available upon request. Reliability analysis of the data was done by performing Cronbach’s Alpha (α) test (0.934), which confirmed the internal consistency of the students’ responses.
Research Ethics
Prior to the online survey, the ethical review committee approval was obtained from the Ethical Clearance Committee of the Research Unit of OUSL (ER/2023/022). Any risks associated with this research are not expected or predicted as the privacy and anonymity of the participants are protected, and sensitive questions were not included in the survey. The first part of the Google form questionnaire was the consent form, which must be clicked “read and agreed” by the participants to get to the real questions. The participants have been given the right to refuse or withdraw, answering questions at any point without any penalty. The data (Google form responses) are stored in a Google Drive with restricted access. They will not be shared with any other parties for any reason. This data will not have any details that reveal the identity of the participants, such as their names and registration numbers. Furthermore, the investigators take responsibility for safe monitoring, maintenance, and fate of data.
Findings Ans Discussion
Student Retention and Performance Statistics
Percentages of non-starters, non-eligible students, and eligible students with respect to the total registrants of each subject area were averaged to obtain single values representing each academic year (Figure 2). A full set of collected data for the four student groups, registrants, non-starters, non-eligible students, and eligible students, for each subject area for the considered three academic years can be obtained upon request.
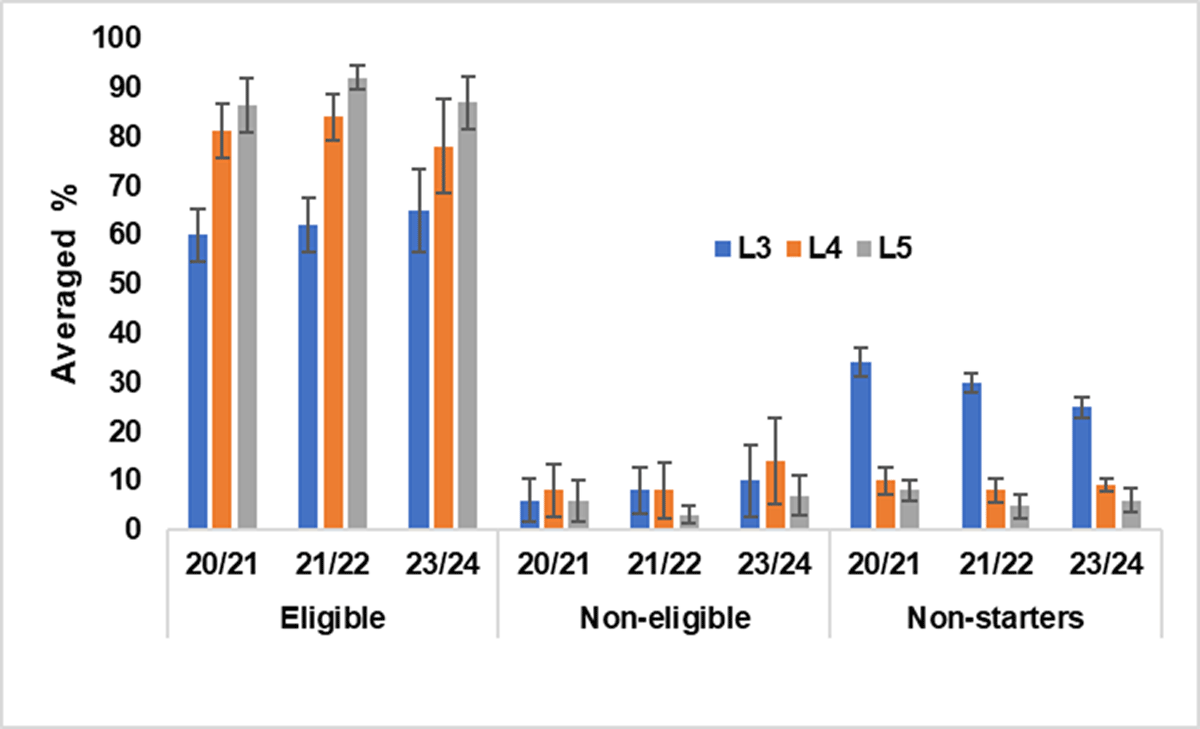
Figure 2
The percentage of each student category (eligible, non-eligible, and non-starters) with respect to the total number of registrants under each study level for the three recent academic years. Error bars indicate values.
Regardless of the academic year, L3 shows the lowest eligible percentages (60–66%) mainly due to the higher non-starter student fraction and perhaps due to the challenges in adaptability to ODL system. This trend is in line with the findings of some recent studies (De Paepe et al., 2018). (The percentage of eligible students increases when going to higher levels and attains 86–92% at L5. It is important to note that the number of registrants per course reduces when going to higher levels: E.g. every year, on average 1000, 600, and 250 registrants enroll for individual chemistry courses at levels 3, 4, and 5, respectively (The exact registeration statistics can be provided upon an email request from the corresponding author). According to some recent studies, the reduction of the number of registrants when going to higher levels of ODL systems is a common phenomenon that happens due to various reasons. (Moore & Kearsley, 2012) However when compared with this study, the reduction can also be due to the availability of a pool of optional courses to choose from at higher levels while level 3 only contains compulsory courses.
The non-starter fraction is prominent in L3 compared to the other levels. Yearly, the non-starter fraction at L3 varies between 25 to 35% while it is reduced and stabilized in the 10 to 5% range at L4 and L5, indicating that the students who retain (and perform well) during L3 tend to continue their studies at higher levels without much difficulty. This could be due to reasons such as them being familiar with the ODL approach and the university, developing good study habits, creating a good supporting group with peers and academics, self-motivation, goal commitment, etc. (Park & Choi, 2009; Rovai, 2003; Simpson, 2004; Tait, 2003). The quantitative survey analysis presented in the next section provides a comprehensive understanding of these motivational factors. Another study (Ranasinghe et al., 2025) conducted for the students who dropped out of this degree program has shown that employed students are more likely to drop out of the program. Further, according to that study, the most influential dropout factors mentioned by the non-starters are job and family commitment, high workload, poor time management, low flexibility of the program, and inadequate academic support given by the instructors. It is conceivable that these factors could severely affect a newly registered L3 student who is not familiar with the academic environment and especially the ODL model than a student at a higher level. In addition, the dropout study (Ranasinghe et al., 2025) reveals that 63% of the non-starters have mentioned that they discontinued the program for another opportunity (such as a placement in a state university where there is no fee or foreign university, a job, and migration). A student would likely transfer to such an opportunity, leaving the program early on (at L3), in which less commitment or time is invested. These factors may collectively result in high non-starter percentages observed at L3: Most of these early dropouts result due to external reasons (e.g. job or family commitment) and due to student skills or characteristics (e.g. poor time management), thus, increasing the student retention at L3 is most likely beyond the control of the university. However, a positive trend of reducing the number of non-starters is observed over the years: The latest academic year (2023/2024) shows the lowest non-starter percentage at L3 out of the three considered years, indicating that the mitigation measures taken by the faculty administration may have a positive impact on students. Some such measures are strengthening the learner support unit, introducing the student mentoring program, and avoiding academic delays by strictly adhering to the scheduled time for the completion of the academic year; during the last convocation held, 46 students (5%) graduated by completing their studies in three consecutive academic years, which is the least possible duration.
Another interesting fact revealed by the data is that the percentage of non-eligible students at level 4 is slightly higher relative to the other levels. This could be because the courses at level 4 consist of advanced subject content compared to the level 3 courses in which a major amount of the content is at the introductory level bridging the knowledge gap between high school and college. Further, notably, majority of the students who enroll to OUSL have moderate to low high-school performance (as students with high performance get eligibility to enroll in the state universities where the tuition is free) thus it is possible that their lack of prior knowledge and varying capacities in absorbing new knowledge may lead to low academic performance. It is important to closely monitor the non-eligible students and provide adequate academic support as there may be a risk of them dropping out of the courses (or the program) due to dissatisfaction arising from their poor academic performance.
As shown in Figure 2, the overall eligible student percentage increases when going to higher levels. The same trend is observed for individual subject areas (Figure 3). There is no significant difference among the eligible percentages obtained in each subject area at level 5 (85–93%), whereas a considerable variation is observed at L3 (54–72%). In general, Pure and Applied Mathematics (PuM and ApM) show lower eligible percentages while Botany and Zoology (Bot and Zoo) exhibit higher values relative to other subjects, Chemistry (Chem), Physics (Phy), and Computer Science (Phy), which are common subjects for both biological and physical stream students.
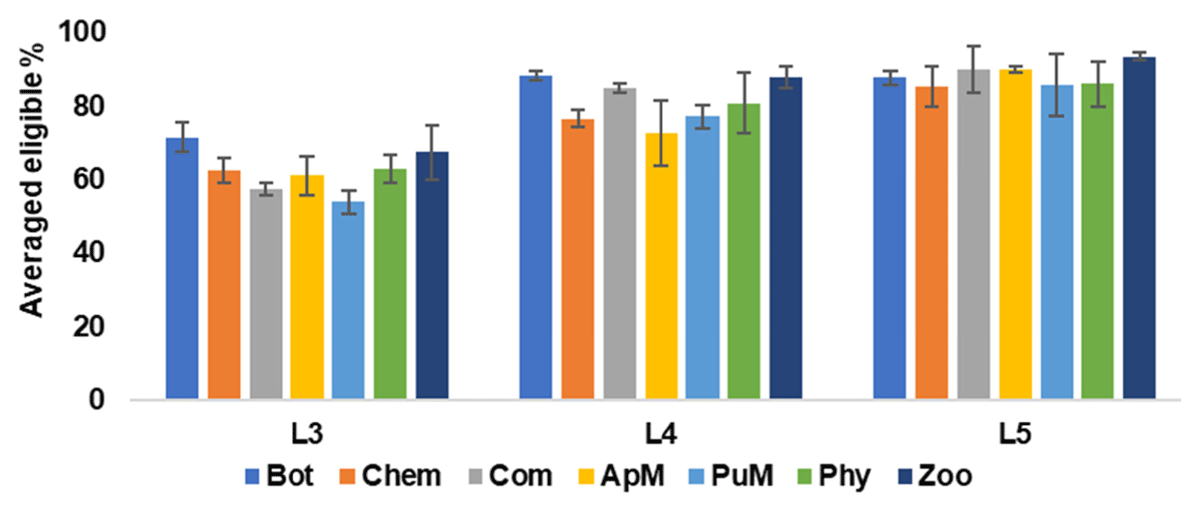
Figure 3
Averaged percentages of eligible students with respect to the number of registrants of each subject area. Error bars indicate SD values.
Finally, it is worthy to note that according to OMIS data reported by 2023 December, the BSc graduation percentages of OUSL are 24.4 (for the 2009/2010 academic year), 24.8 (2010/2011), 23.0 (2011/2012), 31.6 (2012/2013), 30.4 (2013/2014), 35.1 (2014/2015), and 32.7 (2015/2016) and growing (permitted program duration is 10 academic years), which are higher values compared to the average percentage (< 20%) reported for ODL programs (Bozkurt et al., 2015; Muljana & Luo, 2019; Shaikh & Asif, 2022; Simpson, 2018).
Survey
A total of 322 responses were collected, which is 8% of the study population, a sample that is eligible for statistical analysis with a 95% confidence level. Table 1 shows the demographics of the participants.
Table 1
Sample demographics.
| UNAFFECTED STUDENTS | DEMOTIVATED STUDENTS | TOTAL | |||||
|---|---|---|---|---|---|---|---|
| % | % | % | |||||
| Total | 209 | 113 | 322 | 100 | |||
| Gender | Male | 54 | 26 | 34 | 30 | 88 | 27 |
| Female | 154 | 74 | 79 | 70 | 233 | 72 | |
| Age | 19–29 y | 161 | 77 | 94 | 83 | 255 | 79 |
| 30–39 y | 39 | 19 | 16 | 14 | 55 | 17 | |
| 40–49 y | 8 | 4 | 3 | 3 | 11 | 3 | |
| ≥50 y | 1 | 0 | 0 | 0 | 1 | 0 | |
| Civil Status | Single | 166 | 79 | 82 | 73 | 248 | 77 |
| Married | 43 | 21 | 31 | 27 | 74 | 23 | |
| Employment | Unemployed | 112 | 54 | 45 | 40 | 157 | 49 |
| Government | 38 | 18 | 20 | 18 | 58 | 18 | |
| Semi-gov. | 7 | 3 | 5 | 4 | 12 | 4 | |
| Private | 36 | 17 | 31 | 27 | 67 | 21 | |
| Self-employ. | 16 | 8 | 12 | 11 | 28 | 9 | |
| Regional Center | ARC | 4 | 2 | 1 | 1 | 5 | 2 |
| BaRC | 2 | 1 | 2 | 2 | 4 | 1 | |
| BRC | 9 | 4 | 1 | 1 | 10 | 3 | |
| CRC | 115 | 55 | 61 | 54 | 176 | 55 | |
| JRC | 9 | 4 | 8 | 7 | 17 | 5 | |
| KRC | 45 | 22 | 30 | 27 | 75 | 23 | |
| KuRC | 9 | 4 | 5 | 4 | 14 | 4 | |
| MRC | 15 | 7 | 3 | 3 | 18 | 6 | |
| RRC | 1 | 0 | 2 | 2 | 3 | 1 | |
Factors Affecting Student Persistence
Most of the students responded that they have never experienced any demotivation to continue their studies while 35% mentioned that they got the feeling of “dropping out” at some point during their studentship. This student group was given the four-point Likert scale containing forty-four potential factors under six major categories (i.e., Academic (A), University and Administrative (UA), Personal skills and Characteristics (SC), Personal Preferences (PP), and external (E)) to select depending on the severity of the influence of each factor on their demotivational feeling.
Percentages of the cumulative frequencies of the strongly influenced and very strongly influenced responses obtained for each factor were compared to determine the significance order among the demotivational reasons. The results are presented in a column chart in Figure 4 and each category (A = Academic; UA = University and Administrative; SC = (Student) Skills and Characteristics; PP = (Student) Personal Preferences; E = External) is clustered for comparison. The most significant factors identified were A_Burden_Packed Semester (tight semester schedule with high workload compressed within the semester), A_Low Flexibility (fixed deadlines with limited alternative options within the program structure), and E_Social and Political Disappointment (country-specific issues), which were considered significant by more than 50% of the study sample.
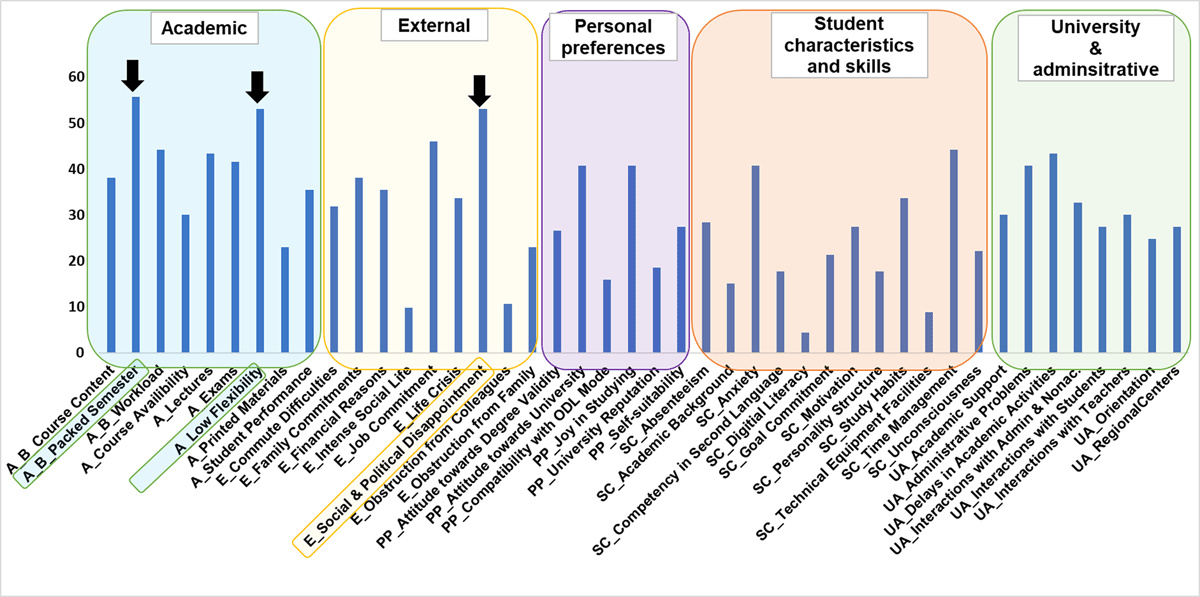
Figure 4
The percentages of cumulative frequencies of “strong influence” and “very strong influence” responses. Black arrows indicate the top three factors.
Academic factors (A): The topmost influential demotivational factor is “academic burden due to packed semester”, which was selected by 56% of the demotivated students indicating that they suffer from the academic pressure exerted due to the tight schedule they follow. It is more likely that this factor is associated with other related academic factors such as academic burden due to high workload (A_Burden_Workload, 44%) and academic burden due to high course content (A_Burden_Course Content, 38%). Further, the cumulative academic burden may partially contribute to other demotivational factors such as anxiety (SC_Anxiety), difficulty in managing time to complete academic activities promptly (SC_Time Management), and no/less joy in academic work (PP_Joy in Studying) (Xavier & Meneses, 2022). The second most influential factor is “low flexibility” (A_Low Flexibility (53%)) of the academic program. Flexibility within an ODL program is considered as the degree of ability to facilitate the individual needs of students within the program structure. A program structure should not be too rigid or too flexible, because either will lead to high dropout rates (Moore, 1993). Given the limited physical and human resources available, compulsory academic activities such as exams and practical sessions of the program are with fixed dates and times or with limited alternative options making the program’s structural rigidity high, perhaps the reason why students have selected the low flexibility factor. Other academic factors selected by more than 40% of the demotivated students are the quality and the usefulness of the lectures (A_Lectures, 43%) and the exam-related matters such as quality and the easiness of the questions and possibility of makeup exams (A_Exams, 42%). Students often enter ODL with high expectations about flexibility and access, but find that the reality (e.g., program design, support mechanisms) does not meet these expectations—leading disengagement and withdrawal (Elibol & Bozkurt, 2025; Pumpe & Jonkmann, 2025). Especially the academic persistent problems in the design of programs, curriculum alignment, and academic structure were significant contributors to dropout behaviors. (Elibol & Bozkurt, 2025).
External factors (E): Only two external reasons have been clicked by more than 40% of the demotivated students, namely, “E_Social and Political Disappointment” (the disappointment due to social and politicak factors) and E_Job commitment (demotivation due to the workload and responsibilities of the employment). In general, it is difficult for the administration or the academic institute to control external demotivational factors, however, by making the students aware of the common political and social issues and on how to mitigate the effects of them could be useful in maintaining a high persistent student rate. The dropout survey conducted for this program showed that the most significant dropout reasons clicked by the students who have already dropped out of this program were mainly external factors such as job and family commitments and financial difficulties rather than academic factors (Ranasinghe et al., 2025). In contrast, the persistent students have clicked academic reasons more frequently (Bağrıacık Yılmaz & Karataş, 2022).
Students’ personal preferences (PP), and skills & characteristics (SC): Forty-four percent of the demotivated students clicked SC_Time Management indicating that their inability to allocate time for academic activities and meet deadlines promptly has severely affected their academic success. According to the resent studies poor Time Management profoundly undermines students’ success in online learning contexts (Akar, 2024; Liu, 2022). In addition, the lack of connectivity with the university (PP_Attitude towards University, 41%) and lack of enthusiasm to be involved in academic activities (PP_Joy in Studying, 41%) were the other student-related characteristics that students have clicked most frequently.
University and administrative factors (UA): The most frequently clicked factor in the admin category is “Delays in Academic Activities” (43%). Academic delays are usually associated with institute-specific or country-specific issues. In this particular study sample, the academic delays referred by the students could be certain local and global calamities such as COVID-19 and the Easter Bomb attack in 2019, which happened in recent years. The Administrative Problems (41%): a university and administrative factor was also frequently clicked, which represents the registration issues, provision of misinformation, and communication issues committed by the administration.
Relationships
To determine if there are any significant relationships between the demographic data of the persistent students and the demotivational factors, Mann–Whitney U or Kruskal-Wallis H tests were conducted: The existence of statistically significant differences among the groups for the study variables (demotivational factors) was positive when the calculated p-value was less than 0.05. Low Flexibility of the program (A_Low Flexibility) has a significant influence on females compared to males as a demotivational factor. A 2022 survey of 1,760 distance-learning students across 28 universities has also revealed that female students were significantly less satisfied with the flexibility offered, compared to male peers (Turan et al., 2022). Out of the total female respondents, 58.22% have been significantly affected by this factor. Interestingly, 70% of the sample is composed of females and 62% of them are employed. Therefore, the demotivation by the low flexibility of the program could be also partially aided by the fact that most of the female population is employed.
External factors such as “Job Commitment”, “Obstruction from Family” and “Life Crisis” have significantly demotivated employed students compared to the unemployed students (Figure 5). Out of the total employed student sample (60%), private sector employees (27%) have severely affected by the job commitments compared to other employment types such as government, semi-government, and self-employed students. Although not ODL-specific, research in private-sector employees highlights that imbalanced work-life conditions and less supportive organizational cultures lead to higher job burnout and reduced well-being. As a result, the private-sector workers typically struggle more with work-life conflict than those in government roles—suggesting greater stress and fewer resources to manage their studies (Khan et al., 2022). However, some of the problems associated with university and administrative factors such as poor interaction with the teachers (UA_Interactions with Teachers) and low facilities and resources at the regional centers (UA_Regional Centres) have become significantly influenced by the unemployed students who usually spend more time in the university than employed students. Furthermore, personal perceptions such as “Compatibility with ODL Mode”, “Attitude towards Degree Validity” and “Reputation of the University” have also contributed to demotivating the unemployed students. This may be due to more engagement with the university and depending on the importance of the university reputation and the validity of the degree for their carrier plans. Interestingly, a significant difference has not been identified between employed and unemployed students with respect to the academic factors.
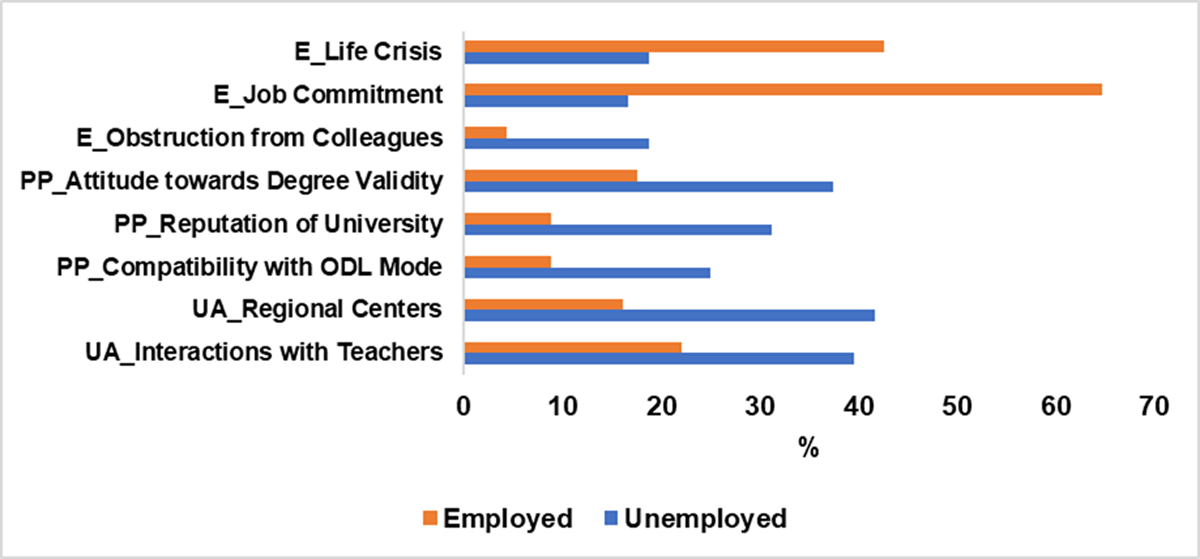
Figure 5
Variation of demotivational factors depending on employment status. The percentages of cumulative frequencies of “strong influence” and “very strong influence” responses are shown.
Three external factors, namely, “Family Commitments”, “Job Commitment” and “Life Crisis” have significantly demotivated married students compared to the single students (Figure 6). Twenty seven percent of the study sample are married students and 77% of them are employed. Accordingly, the responsibilities associated with family and employment have significantly influenced the demotivation of married students, emphasizing the importance of considering their needs to minimize potential dropouts. The findings of recent studies also highlight that marriage increased role complexity, stress, and dropout intention in ODL settings (Adu Henaku et al., 2024; Ranasinghe et al., 2025).
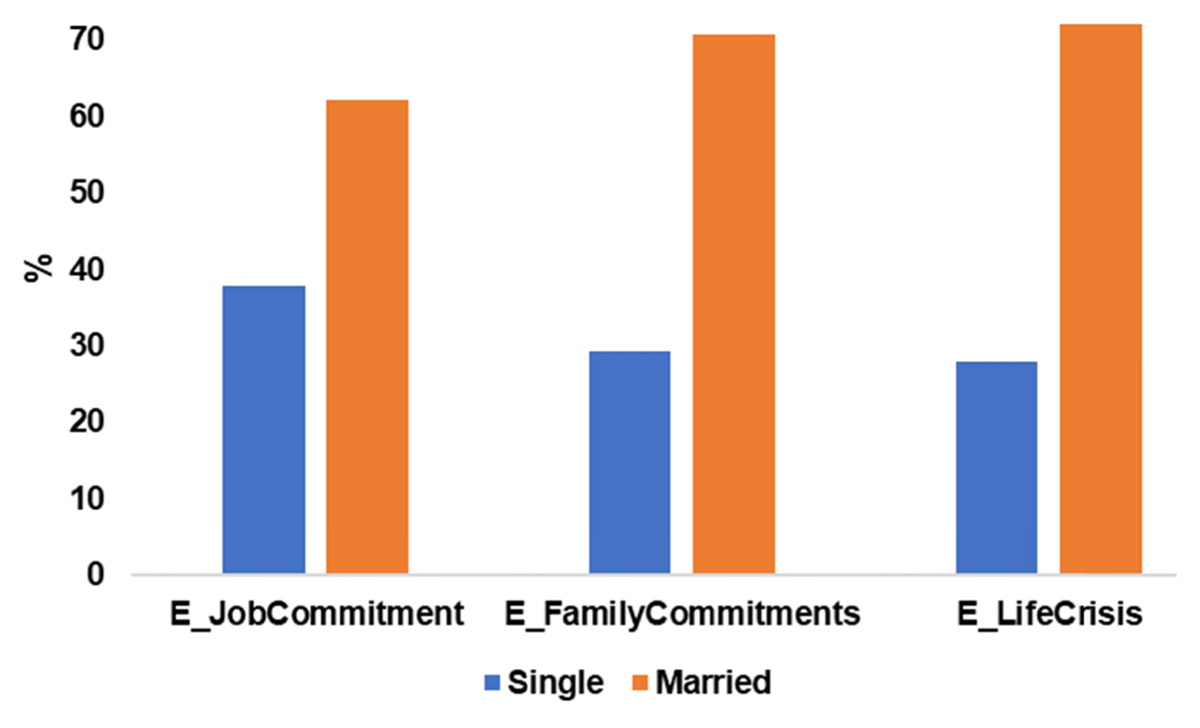
Figure 6
Variation of demotivational factors depending on the civil status. The percentages of cumulative frequencies of “strong influence” and “very strong influence” responses are shown.
In addition to English, students are allowed to follow Level 3 courses in their native language, Sinhala or Tamil, to facilitate their adjustment to follow the courses only in English at the higher levels. The influence of the registered language on the demotivational factors were analyzed using the Kruskal-Wallis H Test. The competency in second language (i.e., English) has become a significant demotivational factor among the Tamil and Sinhala medium registrants as 70% and 44% of them clicked the “Competency in Second Language” factor related to their skills and characteristics (SC), respectively. Accordingly, the students those who registered in English medium seems satisfied more compared to other language registrants confirming the importance of improving English language skills. Several recent studies reveal that, language proficiency emerged as the most significant predictor of academic success, with challenges stemming from second-language instruction context causing poor performance, frustration, and higher withdrawal rates (Kamaşak & Sahan, 2023).
Vast majority of the study samples are between 19 and 29 years of age (87%). A positively skewed age distribution is observed (skewness coefficient = +2.473) with a mean value of 25.95. Thus, the significance of the demotivational factors against age was not analyzed. In addition, no statistically significant relationships were observed between the demotivational factors and the subject combinations or their involvement in extra-curricular activities at the university.
Motivational Factors
One open-ended question asked from the persistent students is, “What motivated you to continue your studies at OUSL successfully?”. Comments for this question were analyzed and summarized below (Table 2). Please note that some of the motivational factors identified are the positive counterparts of the demotivational factors identified in above section: Factors affecting student persistence. For example, if less joy in studying is a demotivational factor, enjoying the studies can be taken as a motivational factor for continuing studies. The most frequently given motivational factor to continue their studies at OUSL was goal commitment. In addition, many students have appreciated the special features in the Programme compared to the conventional education setting, which are flexibility (ability to study while maintaining a career) and the mode of education (ODL). Further, the students mentioned that the support given by various parties, such as academics, colleagues, and family members, has also motivated them to continue their studies. Most of these factors have already been identified and categorized in some of the recent studies (Bağrıacık Yılmaz & Karataş, 2022; Rovai, 2003).
Table 2
Motivational factors mentioned by the students when asked, “What motivated you to continue your studies at OUSL successfully?”.
| CATEGORY | MOTIVATIONAL FACTOR | CODE FREQUENCIES |
|---|---|---|
| Academic | Flexibility, ability to study part-time | 13 |
| Structure of the programme, Study Materials | 08 | |
| Student Performance – good results in L3 | 06 | |
| Online learning system, online lectures | 05 | |
| University and Administrative | Academic Support | 16 |
| Interactions with Teachers | 7 | |
| Orientation, PASS, or EfIL programme | 3 | |
| University facilities: library, laboratories, etc. | 3 | |
| Interactions with Admin and Non-academic staff | 2 | |
| No delays in Academic Activities | 2 | |
| Student societies such as Zoonet, BotSoc, etc. | 2 | |
| Regional Center facilities | 1 | |
| (Student) Skills and characteristics | Goal Commitment | 57 |
| Personality Structure – determination, desire to make the family happy, etc. | 8 | |
| Self-motivation | 6 | |
| (Student) Personal Preferences | ODL Mode, self-study mode | 17 |
| Joy in Studying | 15 | |
| Self-suitability – to change career pathway and for promotion | 11 | |
| Attitude towards Degree Validity | 07 | |
| Reputation of the University | 02 | |
| External | Support from Colleagues and family | 11 |
| Low cost of the degree | 10 | |
| Because parents paid for the degree | 05 | |
| Alumni success stories | 02 | |
| Social and Political Disappointment of the country | 01 | |
| Other Opportunities | Opportunity for higher studies or a good career.There is no chance of getting into a conventional government university | 11 |
Conclusions and Recommendations
Being the only university in Sri Lanka offering ODL programs, the Open University of Sri Lanka (OUSL) is providing an invaluable opportunity for the enthusiastic Sri Lankan students, who are employed, scattered around the island to pursue their educational goals full- or part-time basis. This research was conducted to identify the challenges and their degree of influence to demotivate the persistent students who enrolled in the Bachelor of Science (BSc) degree of OUSL. Firstly, the student retention patterns for individual BSc courses over the past three academic years were analyzed using available student statistics. Secondly, a questionnaire survey was conducted to identify the demotivational factors encountered by the students.
Student statistics revealed that the lowest student retention is exhibited in the first year (65– 75%). In the second and third years, a significant improvement in student retention is observed (>90%). In all the study levels, most of the students perform well academically, which is gauged by the eligible student percentage which is >60%. Further, there is no significant difference observed in student retention with respect to the subject combinations they follow.
The results showed that 35% of persistent students felt demotivated at some point in their studentship. Over 50% of affected respondents rated 1) packed semesters, 2) low flexibility in the program, and 3) social and political disappointment as the most influential factors for their demotivation. The first two factors are academic related thus can be addressed by the university administration while the social and political disappointment is beyond the university’s authority. A separate study conducted to identify dropout reasons for the BSc degree program reveals that most of the dropout reasons mentioned by the students were non-academic (e.g. job and family commitments, time management, etc.) (Ranasinghe et al., 2025). However, one significant academic factor identified by that study was low flexibility of the study program, which is also one of the main demotivational factors exposed by the current study. Overall, this study explains the complex influence of academic, external, personal, and institutional factors at different levels, driving demotivation and hence potential dropout decisions among persistent students. In line with the findings of recent studies, single-cause models do not explain the full picture of demotivational challenges and dropouts in ODL systems as it is driven by a complex interplay of various factors such as individual, cultural, institutional, and systemic (Elibol & Bozkurt, 2025).
We suggest improving the flexibility of academic activities, especially in the first year, to increase the satisfaction of the persistent students. Further, implementing a less rigorous academic schedule may reduce academic burden and enhance retention. Overall, the execution of an effective monitoring mechanism to identify demotivated students and to reach them in advance to address their academic or other problems may increase student persistence substantially.
The outcomes of this study hold significant implications to the world-wide ODL systems and administrative bodies of the ODL institutes to improve student retention. The main demotivational factors that identified in this study (1) packed semesters, 2) low flexibility in the program, and 3) social and political disappointment are mostly applicable to ODL institutions where andragogy exists. The adult learners try to balance their education, work and family responsibilities, especially in ODL systems. It is important to prioritize such needs when designing academic schedules and policies to minimize the problems or the impact of these demotivational factors on persistence students of ODL institutes. Moreover, proactive retention strategies, such as tracking the students’ progress and their demotivational factors, to specifically identify potential dropouts and help them to promote persistence and completion. As highlighted in this article, understanding the dynamics of ODL system and accordingly admit, support, sustain and facilitate the requirements of Open and distance learners lead to improve student retention in ODL systems while creating lifelong learning experiences. This is important to accommodate society’s ever-expanding need for tertiary education.
Data Accessibility Statement
The datasets used and/or analysed during the current study are available from the corresponding author on reasonable request.
Sustainable Development Goals (SDGs)
This study is linked to the following SDG: Quality education (SDG 4),
Ethics and Consent
Prior to the online survey, the ethical review committee approval was obtained from the Ethical Clearance Committee of the Research Unit of the Open University of Sri Lanka (ER/2023/022). The ethical committee approval letter is attached in the supplementary file.
Competing Interests
The authors have no competing interests to declare.
Author Contributions (CRediT)
T. Lakshini D. Fernando: Conceptualization, Data curation, Formal Analysis, Investigation, Methodology, Project administration, Software, Validation, Visualization, Writing – original draft, Writing – review & editing. Kokila Ranasinghe: Conceptualization, Data curation, Formal Analysis, Investigation, Methodology, Project administration, Software, Validation, Visualization, Writing – original draft, Writing – review & editing. Nimali Vineeshiya: Conceptualization, Data curation, Formal Analysis, Investigation, Methodology, Project administration, Software, Validation, Visualization, Writing – original draft, Writing – review & editing. G.W.A. Rohan Fernando: Conceptualization, Data curation, Formal Analysis, Investigation, Methodology, Project administration, Resources, Software, Validation, Visualization, Writing – review & editing. All authors have read and agreed to the published version of the manuscript.