
Introduction
The high cost of commercial textbooks and other required course materials poses a significant barrier to undergraduate student learning in many regions of the world, including in Canada (e.g., Jhangiani & Jhangiani, 2017), Australia (e.g., Lambert & Fadel, 2022), South Africa (e.g., Cox et al., 2020), and the United States (e.g., Jenkins et al., 2020). This makes the affordability of course materials an important consideration for faculty and administrators at institutions of higher education that value equity and access. The problem of inequitable access to course materials is especially acute in the United States and Canada, where the cost of college textbooks rose by nearly 6% each year between 2000 and 2016, which is nearly triple the average annual rate of inflation (Perry, 2022) and contributes to student debt that totals over US$1.75 trillion in the United States (Hahn, 2024) and CA$23.5 billion in Canada (Wong, 2023). Numerous surveys of undergraduate students conducted across the United States and Canada over the last decade have shown that a majority of students do not purchase at least one of their required course textbooks due to their high cost, that a significant proportion of learners choose or withdraw from their courses as a function of textbook costs, and that only a minority of students have not been impacted by high textbook costs (e.g., Contrada & Good-Schiff, 2021; Florida Virtual Campus 2016, 2018, 2022; Jhangiani & Jhangiani, 2017; Seaman & Seaman, 2023; Strauss & Cordice-Little, 2021; Versluis et al., 2017). The negative impact of high textbook costs often disproportionately affects first-generation, ethnic minority, low socioeconomic status, and other marginalized students, who experience poorer educational outcomes as a result (Fischer et al., 2021). High textbook costs also exacerbate food and housing insecurity (e.g., Dubick et al., 2016), which renders the unaffordability of course materials a social justice issue (Hodgkinson-Williams & Trotter, 2018; Jenkins et al., 2020; Lambert, 2018).
Even prior to rapid acceleration of digital learning during the COVID-19 pandemic, commercial textbook publishers offered automated billing of leased digital course materials as an affordability strategy; however, this approach (marketed variously as “inclusive access,” “day one access,” “unlimited access,” “digital direct,” “immediate access,” “exclusive access,” or “equitable access”) has been criticized on several grounds including affordability, accessibility, data privacy, faculty academic freedom, and student agency (Swaak, 2023; Vitez, 2020).
Fortunately, the proliferation of open educational resources (OER), particularly in the form of open textbooks, has become an increasingly viable alternative to expensive commercial textbooks. UNESCO defines OER as “learning, teaching and research materials in any format and medium that reside in the public domain or are under copyright that have been released under an open license, that permit no-cost access, re-use, re-purpose, adaptation and redistribution by others” (2019, para. 1). With significant support from entities such as philanthropic organizations (e.g., William and Flora Hewlett Foundation), professional societies or consortia (e.g., Centre for Computer-Assisted Legal Instruction), state and provincial governments (e.g., Province of British Columbia), and higher education institutions and systems (e.g., University System of Georgia), there has been rapid growth in the supports available to post-secondary educators who wish to create, adapt, and adopt OER (Jhangiani et al., 2024), including in the forms of financial incentives (e.g., through OER grants and faculty stipends), practical supports (e.g., OER publishing programs), and recognition (e.g., inclusion among tenure and promotion criteria). These supports, combined with concerted efforts to raise awareness about textbook affordability and to build institutional capacity to support local campus OER initiatives, have more than doubled the proportion of U.S. faculty who are between somewhat and very aware of OER from 27% in 2014–15 to 64% in 2022–23, with the actual use of OER growing from 5% to 29% over the same period, including 36% of introductory undergraduate courses (Seaman & Seaman, 2023).
This is not to say that campus efforts to support OER adoption do not face challenges. For example, Boyle (2023) conducted a five-year study at the College of Staten Island to assess the impact of a grant-funded OER initiative aimed at increasing faculty adoption. Although the initiative successfully raised faculty engagement and resulted in over 80 open educational works published, sustaining this momentum beyond initial funding proved challenging, with funding shifting towards faculty professional development rather than course conversions. Key barriers included faculty resistance to new technologies and the need for long-term support mechanisms for OER programs.
Impact of OER on Student Outcomes
With OER use now accounting for student cost savings in excess of US$1 billion (Allen, 2018), research on the use and impact of OER has shown that the economic benefits are not achieved at the expense of educational outcomes. For example, Hilton (2016) reviewed nine OER efficacy studies published between 2008–2015 and found that three studies demonstrated a significantly positive impact of the use of OER on learning outcomes, whereas an additional three studies revealed no significant differences. Just one study in Hilton’s (2016) review showed that the use of OER was related to lower learning outcomes;1 however, Hilton also noted several weaknesses of these early studies, including problematic designs that failed to control for potential confounds. Hilton (2020) then repeated this analysis with an additional nine OER efficacy studies published between 2015–2018. Once again, despite results that predominantly associated OER use with better learning outcomes, several of these studies failed to control for confounding variables such as teacher and/or student differences. However, four studies that attempted to control for both instructor and student variables found that students assigned OER either performed better (Colvard et al., 2018; Jhangiani et al., 2018; Winitzky-Stephens & Pickavance, 2017) or no differently from students assigned commercial textbooks (Clinton, 2018); however, in the latter case a pattern of greater course persistence was identified among students assigned OER.
Clinton & Khan (2019) included many of the studies reviewed earlier by Hilton (2016, 2020) in a meta-analysis of 23 independent studies that showed no differences in the learning efficacy between open textbooks and commercial textbooks. Moreover, the same analysis revealed that the withdrawal (persistence) rate for courses using open textbooks is significantly lower than for courses that assigned commercial textbooks. This finding, together with other research that has shown students enrolled in courses that assign OER tend to enrol in more credit hours relative to their peers enrolled in courses that do not utilize OER (Fischer et al., 2015; Neu-Stephens, 2020) point to two benefits of using OER through which student cost savings can translate into higher tuition revenue for the institution. This in turn outlines a potential sustainability model to cover the costs of providing OER supports (Wiley et al., 2016).
Research published since October 2018 (the cutoff date for Clinton and Khan’s meta-analysis) has continued to reflect the same pattern, with students typically showing similar or superior outcomes when enrolled in courses that use OER. For example, Hardin et al. (2019) identified a slight increase in students’ content knowledge when using an OER text and Magro and Tabaei (2019) found that students assigned OER had higher course grades than those assigned traditional textbooks. Mayer (2023) found that students in courses that assigned OER earned higher course passing rates and higher completion rates. However, Grissett & Huffman (2019), Engler & Shedlosky-Shoemaker (2019), Nusbaum et al. (2020), and Tila & Levy (2022) found no significant differences between students assigned OER or the incumbent commercial textbook. Similarly, Sansom et al. (2021) found that students who took the option to use OER instead of a commercial textbook performed no differently than their peers, even after controlling for relevant academic factors (e.g., prior academic success), while Fischer et al. (2021) found no main effect for OER use, but instead an interaction between OER and course difficulty such that OER use mitigated the negative impact of more difficult courses on course performance. Finally, Diaz Solodukhin et al. (2025) found that although students who enrol in no-cost or low-cost courses do not decrease their time-to-graduation, they did show increased graduation rates. This was especially true in the case of older learners, who are among the populations historically underserved by higher education.
It is worth noting that although the vast majority of OER efficacy studies has been conducted in the context of post-secondary institutions located within the United States, three such studies conducted at Canadian institutions have mirrored the trends summarized above. Specifically, Jhangiani and colleagues (2018) found that students assigned OER in print or digital format performed either no differently or better than those assigned a commercial textbook, while Ross and colleagues (2018) found that students enjoyed higher course completion rates when assigned OER instead of a commercial textbook, and Hendricks and colleagues (2017) found no significance change in students’ learning outcomes following the adoption of OER.
Other known Outcomes of using OER
Although the impact of OER on student outcomes remains an important area of study, research frameworks such as COUP (cost, outcome, use, perceptions; Bliss et al., 2013) and, more recently, SCOPE (social justice, cost, outcomes, perceptions, and engagement; Clinton-Lisell et al., 2023) have drawn attention to additional dimensions of OER that merit investigation. For example, research by Nagashima and Hrach (2021) has found that the use of OER has enhanced pedagogical flexibility for educators who have been able to avail of the affordances of open licensing to better contextualize learning materials. This may be through revising OER to incorporate recent research developments, reflect regional or local data or cultural references, or simply reflect the sequencing or required topics of coverage of the approved course outline. This includes the many cases in which educators collaborate with students to co-create knowledge by revising, remixing, and publishing OER. This innovative pedagogical approach, which is consistent with the principles of open pedagogy (Ashman, 2023; Bali et al., 2020; Tijerina, 2024), is associated with increased motivation, improved attitudes about learning, and greater skill development (Trust et al., 2023).
Interestingly, Vojtech & Grissett (2017) found that students rated faculty who assign OER as more kind, more creative, and more encouraging than faculty who assign commercial textbooks. These results were mirrored in findings by Nusbaum and Cuttler (2020), in which students rated instructors who assigned OER more positively than those who assigned a commercial textbook. In the same study, students were also more likely to select courses that had no required costs for course materials, effects that speak to the broader benefits of OER adoption, including the perception that instructors who adopt OER genuinely care about their learners and their success (Levy & Tila, 2022).
Other relevant findings in the literature on OER include similar levels of student use and reading of OER and commercial textbooks and generally comparable student perceptions of the quality of OER and commercial textbooks, albeit with different perceptions of their relative strengths and weaknesses (see Clinton [2019] for a narrative review).
From OER to Zero Textbook Cost (ZTC) Programs
The increasing professionalization and institutionalization of OER creation, adaptation, and adoption, which only accelerated through the COVID-19 pandemic (Johnson & Seaman, 2021), laid the foundation for a more strategic approach to supporting OER within post-secondary institutions, one that does not allocate the benefits of OER adoption to students solely as a function of faculty awareness and decision-making, but instead purposefully plans and incentivizes the vertical integration of OER across all of the required courses and program requirements of a degree program (Correa & Bozarth, 2023). Whether at the level of a diploma, an Associate’s degree, or a Baccalaureate degree, these “zero textbook cost (ZTC) programs” enable students to complete an entire program of study without having to incur any costs for course materials (Draper et al., 2023; Griffiths et al., 2022; Nickerson, 2025). This is often achieved by identifying programs of study that enjoy a) a critical mass of relevant and high quality OER, b) a cadre of faculty members who are using or considering using OER, and c) popularity of the programs among learners, including those learners who experience significant economic barriers (e.g., first generation students, working adults, etc.). Once one or more candidate ZTC programs are identified, responsible administrators or program leads may allocate institutional resources to support the identification and adoption of OER across all of the required courses in a given program, a strategy that may be augmented as needed by the adaptation and even the creation of OER to fill identified curricular gaps. Importantly, ZTC programs are identified as such to students at the point of registration, often through the use of specialized course marking in the course timetable or academic calendar (Ainsworth et al., 2020).
ZTC courses and programs may be assembled exclusively through the use of OER, as was the case with the OER Degree Initiative launched by 38 community colleges across the United States (Griffiths et al., 2022). However, in other cases these programs augment OER adoption with other pragmatic strategies to achieve the goal of zero required course material costs for learners, including the use of library subscriptions (paid for by institution, not students) and the use of public or instructor-created resources, even if these are not openly licensed. This practical approach helps offset the uneven availability of OER across all disciplines and levels of study, a major limitation of OER that is a function of the tendency of funding organizations to prioritize OER creation in higher enrollment areas that demonstrate a greater return on investment (i.e. introductory survey courses and popular fields of study).
Impact of ZTC Programs on Student Outcomes
To date there has been little research published on the impact and perceptions of ZTC programs; however, these few studies mirror some of the findings of the broader OER literature. For example, a set of quasi-experimental impact studies and a meta-analysis across 11 American community colleges participating in Achieving the Dream’s OER degree initiative (Griffiths et al., 2022) found that in 6 out of the 11 colleges, students enrolled in courses that used OER had accumulated significantly more course credits than those who had not taken any courses that used OER whereas in the remaining 5 colleges there was no significant difference in accumulated course credits. An analysis of students’ cumulative GPA yielded mixed results, as students taking OER courses achieved a higher GPA at 1 college, a lower GPA at 2 colleges, and a GPA that was not statistically different from their non-OER-using peers at 5 colleges. These results were partly moderated by Pell status (eligibility for a United States federal educational grant program), such that students with financial need show greater gains in credit accumulation and cumulative GPA (Griffiths et al., 2022).
Another study, this one involving an examination of three years of institutional data at demographically diverse Houston Community College, showed that students enrolled in ZTC courses were more likely to pass than students enrolled in non-ZTC courses (Smith et al., 2020), a result that held after controlling for course and instructor level effects. However, this study did not find evidence that enrolling in ZTC courses was associated with course completion.
In addition to these findings, the OER working group at Millersville University developed and implemented an Open Textbook Initiative to incentivize faculty to adopt OER in courses. The purpose of their study was to examine the relationship between ZTC, students’ ability to access these resources, and their attitudes about the usefulness of course materials (Pfannenstiel et al., 2020). Unsurprisingly, their research revealed that students enrolled in ZTC courses reported spending significantly less on course materials compared to when they enrolled in traditional courses. Furthermore, whereas student attitudes towards the usefulness of materials did not significantly affect spending, those who believed they could pass their courses without textbooks still acknowledged their utility. Overall, students enrolled in ZTC courses reported average savings of US$75–96, highlighting the potential financial benefits of OER initiatives (Pfannenstiel et al., 2020).
Finally, a survey of 890 students enrolled in ZTC courses at community colleges within the City University of New York system, found that 76% of respondents found the materials for their ZTC courses easier to access than materials for their previous non-ZTC courses (Brandle et al., 2019). Open-ended responses revealed that cost-savings was perceived as the most important benefit of ZTC courses (55% of respondents), followed by ease of access (27%), and being better for learning (10%). These themes were echoed by the explanations provided by the 95% of respondents who indicated that they would recommend ZTC courses to other students.
Given the potential benefits of the systematic adoption of OER in the form of ZTC programs, and in line with the COUP (Bliss et al., 2013) and SCOPE (Clinton-Lisell et al., 2023) research frameworks, it is important to investigate the impact of these initiatives on a range of student academic outcomes, including enrolment, persistence, and performance. Furthermore, given that the entirety of the published literature on the impact of ZTC programs has been situated in the context of community colleges within the United States, it is valuable to extend this body of research by considering the impact of ZTC programs at universities as well as in other countries, with different kinds and degrees of societal and educational inequities (e.g., Dill, 2022; Zajacova & Siddiqi, 2022).
Context of the Present Study
Kwantlen Polytechnic University (KPU) is a public degree-granting undergraduate polytechnic university in British Columbia, Canada, with campuses in Surrey, Richmond, Cloverdale, and Langley. KPU is one of the largest institutions by enrolment in British Columbia garnering a total of 20,000 students and 1,400 faculty members across its five campuses in the Metro Vancouver area. KPU provides undergraduate and vocational education including bachelor’s degrees, associate degrees, diplomas, certificates, apprenticeships, and citations in more than 140 diverse programs (Kwantlen Polytechnic University, n.d.). Already a leading institutional adopter of OER in the province, KPU launched Canada’s first ZTC program in 2018, with the primary goal of reducing the cost of learning for students (Kwantlen Polytechnic University, 2017).
In line with a strategic goal to support the development and growth of ZTC programs, KPU developed robust institutional supports for educators who wish to replace commercial textbooks with course materials that are free of cost to students (including OER, library resources, instructor-created resources, and free online resources).2 At the time of writing (Fall 2024), KPU’s ZTC initiative spans eight credentials (including Baccalaureate degree programs in Arts and Interior Design, Associate degree programs in Sociology and General Studies, diploma programs in General Studies and Adult Basic Education, and certificate programs in Arts and Design) and nearly 800 individual courses taught by over 480 instructors (Spavor & Grey, 2024). As of the 2023–2024 academic year, the proportion of courses offered by KPU that qualify for the ZTC designation currently approaches 30% of all course offerings. Overall, over 24,000 students have benefited from nearly CA$13 million in cost savings since the inception of KPU’s ZTC initiative.
Research Objectives and Hypotheses
The present study aims to investigate the multi-year impact of KPU’s ZTC programs on educational outcomes, specifically focusing on student performance, course enrollment, and withdrawal rates. By analyzing institutional-level data collected at KPU between January 2018 and August 2022, this research aims to inform policy and practice in higher education by broadening the evidence base for ZTC initiatives and testing a series of hypotheses drawn from previous research findings in other institutional and national contexts. Based on our literature review, we hypothesized that course sections implementing ZTC would demonstrate either similar or enhanced levels of outcomes, as reflected through better overall performance, greater enrollment, and lower withdrawal rates.
Methods
Research Procedures
Preregistration
The hypotheses for this study were preregistered on the Open Science Framework (OSF) platform (Jhangiani & Pakkal, 2023), and the preregistration document may be accessed at https://doi.org/10.17605/OSF.IO/X294S.
Source of the Dataset
We obtained the dataset from KPU’s Office of Planning & Accountability, which collects and analyzes data to support internal academic planning and decision-making. The data were extracted from KPU’s student information system, Ellucian Banner, which holds comprehensive records on student course enrollment and performance across all Faculties and programs, including both domestic and international students, and full-time and part-time enrollments. These data are regularly published and updated on KPU’s internal data dashboards and are accessible only to KPU employees. To ensure individual student confidentiality, the data were made available to us only at the course section level, rather than at the individual student level.
Description of the Analytic Dataset
The dataset for this study included data related to 13,605 course sections offered at KPU between September 2018 (the onset of ZTC program) and August 2022. Therefore, the basic unit of the data is the course section, representing an individual offering of a course in a specific semester and academic year. For example, PSYC 1100-S10 offered in the Fall semester of the 2018/2019 academic year is a single course section of the Introduction to Psychology course. Outcome variables, such as GPA and withdrawal rates, are recorded at the course section level.
Course sections are grouped within a course, which refers to the subject taught. For instance, all sections of PSYC 1100 offered from 2018/2019 to 2021/2022 fall under the course PSYC 1100 (Introduction to Psychology). We assume that sections within the same course share more similarities (e.g., content, teaching methods, difficulty) compared to sections from different courses. For example, sections of “Introduction to Psychology” are expected to be more similar to each other than to sections of “Psychology Statistics.”
Courses are further organized within a program, which is a recognized field of study such as Psychology, Biology, or History. Finally, programs are nested within a Faculty, the organizational unit in higher education institutions encompassing related academic departments. Table 1 below shows the number of observations at each data level, stratified by Faculty.
Variable Description
Please refer to Table 2 for a summary of the key variables used in the analyses. Detailed descriptions of these key variables and covariates are provided in the subsequent paragraphs.
Table 2
Definitions of Key Variables Categorized by Their Roles in the Statistical Model.
| VARIABLE TYPE | DEFINITION |
|---|---|
| Predictor | |
| ZTC Status | Indicates whether a given course session was designated as zero-textbook cost offering. |
| Outcomes | |
| GPA | The estimated average GPA for a given course section. |
| Withdrawal Rates | The proportion of students who withdrew from a given course section. |
| Seats Fill Rates | The proportion of available seats that were occupied by students in a given course section. |
In addition to the key variables, we incorporated all remaining variables as covariates for two primary reasons. First, employing such a comprehensive approach helps to minimize researcher degrees of freedom, thereby reducing reliance solely on researchers’ judgments (Wicherts et al., 2016). Second, we consider these covariates as potential “common causes” or confounds that may limit our ability to make causal inferences (Glymour et al., 2008; Witte & Didelez, 2019). By statistically controlling for these factors, we enhance our capacity to make causal inferences regarding the impact of the ZTC initiative on the targeted outcomes. Rationales for including these covariates are provided in the respective subsections.
Predictor Variable
ZTC Designation. This is a binary variable indicating whether a course section had received the ZTC (zero textbook cost) designation. The ZTC variable has two levels: 0 (non-ZTC) and 1 (ZTC). Among all course sections offered during the study period, approximately 81% (11,076 sections) did not qualify for the ZTC designation, while 19% (2,529 sections) did. This included 15% of offerings (528 of 3,580 sections) in 18/19, 18% (605 of 3,425 sections) in 19/20, 22% (774 of 3,502 sections) in 20/21, and 20% (622 of 3,098 sections) in 21/22. In the analyses, this variable was cluster-mean centered to ensure that only its within-course associations with the outcomes were estimated (Hamaker & Muthén, 2020; Yaremych et al., 2023).
Given previous research suggesting uneven distributions of ZTC offerings across disciplines and course levels, we examined this phenomenon using the KPU data (see Table 3). In line with the existing literature, we observed that ZTC offerings were predominantly clustered in lower-level courses and majors related to social sciences and humanities (also known as arts).
Outcome Variables
GPA. GPA represents the mean performance achieved by students in a specific course section. Given that we only have access to the proportions of students obtaining each letter grade (e.g., A+, A, D, F), Section GPA was estimated using the following formula:
GPA = (p_A_plus × 4.33) + (p_A × 4.00) + (p_A_minus × 3.67) + (p_B_plus × 3.33) + (p_B × 3.00) + (p_B_minus × 2.67) + (p_C_plus × 2.33) + (p_C × 2.00) + (p_C_minus × 1.67) + (p_D × 1.00) + (p_F × 0),
where p represents the proportion of students assigned to each letter grade for a given course section.
The resulting index is a continuous variable ranging from 0 to 4.33, with higher scores indicating better average performance. The mean GPA in the data set is 2.69 (SD = 0.77), following a slightly negatively skewed but overall symmetrical distribution. This indicates that most course sections achieved approximately a B-minus ranking, with fewer sections receiving extremely low or high rankings.
Seats Fill Rates. Seats fill rates indicate the proportion of available seats that have been filled in a course section, ranging from 0.00 to 1.00. Higher values represent higher enrollment rates. The mean seats fill rate is 0.78 (SD = 0.23), following a negatively skewed distribution, suggesting that most course sections had relatively high enrollment rates.
Withdrawal Rates. This continuous variable measures the proportion of enrolled students who withdrew from a course section after the add/drop period, ranging from 0 to 1. Higher values indicate a greater percentage of student withdrawals. The mean withdrawal rate is 0.08 (SD = 0.09), and the distribution is positively skewed, suggesting that most course sections experience very low withdrawal rates.
Within-Course Covariates
Academic Year. Academic year is treated as a categorical variable, reflecting the belief that university dynamics varied from the academic year 18/19 to 21/22, especially due to COVID-19 and significant changes in school policies and learning modes. It includes four levels: 18/19 (26%, 3,580 sections), 19/20 (25%, 3,425 sections), 20/21 (26%, 3,502 sections), and 21/22 (23%, 3,098 sections). The proportion and number of course sections offered were relatively consistent across these years. We statistically controlled for academic years to account for changes over time. As professors gain more experience and improve their teaching skills, they may also become more open to adopting ZTC practices, both of which can affect the outcomes of interest.
Semester. This categorical variable indicates whether a course section was offered in the Fall (September to December), Spring (January to April), or Summer (May to August) semester. The distribution is as follows: Fall (35%, 4,811 sections), Spring (42%, 5,780 sections), and Summer (22%, 3,014 sections). Each semester lasts 15 weeks, including two weeks of final exams. Based on institutional observation, university summer courses often feature smaller class sizes compared to regular semester courses. Additionally, they attract students with specific needs, such as those aiming to accelerate their program completion, make up for lost credits due to failed courses, or reduce course loads during the primary enrollment semesters (September to April). These distinctive characteristics can influence both the outcomes of interest and the implementation of ZTC initiatives, making academic semesters a potential confound that needs to be controlled for.
Between-Course Covariates
Course Level. Course level is a categorical variable ranging from Level 1 to Level 6, with higher levels indicating course sections for more advanced knowledge or specialized training. The distribution of course sections across levels is as follows: Level 1 accounts for 56% (7,603 sections), Level 2 for 18% (2,398 sections), Level 3 for 14% (1,929 sections), Level 4 for 8% (1,803 sections), Level 5 for 3% (452 sections), and Level 6 for 1% (140 sections). Initially, we included interactions between ZTC designation and course level to examine whether the association between ZTC status and the outcomes of interest differ across course level. The interaction was non-significant, but course level itself improved model fit by explaining unique variance in the outcomes of interest. As a result, we retained course level as a covariate.
Faculty. Faculty refers to the general category of the discipline to which a major is classified. Detailed information about Faculty categories is presented in Table 1. As with course levels, Faculty was originally included to examine its interaction with ZTC designation. Despite the non-significance of the interaction term, Faculty was retained as a covariate due to its ability to improve model fit and uniquely explain the outcomes of interest.
Analysis Plan
The primary objective of our study is to infer the potential impact of the ZTC designation on various course outcomes, such as GPA, seats fill rates, and withdrawal rates. A common statistical approach to achieve this objective is the t-test, which estimates the difference in outcomes between ZTC and non-ZTC course sections. However, this method may attribute differences in outcomes to ZTC status when they are actually due to characteristics of the courses themselves. For instance, courses that frequently qualify as ZTC might also tend to be easier or at the introductory level, leading to better student performance independent of the ZTC policy. In such scenarios, the co-occurrence of ZTC designation and course difficulty or course level can result in misattributing the impact of course difficulty or course level on GPA to the ZTC designation.
One solution to this problem is to measure and statistically control for all possible confounding variables that vary between courses, but this is often impractical. Alternatively, a repeated measures approach can be employed, where predictors and outcomes are measured at multiple timepoints for the same course. This is the approach adopted in our current data collection. It allows for assessing associations within courses, mitigating concerns about varying characteristics across courses that could confound the relationship of interest. Multilevel modeling, also known as mixed-effect modeling, is an appropriate statistical method for this type of data (Moerbeek, 2004; Tasca & Gallop, 2009). It can estimate the association between ZTC designation and course outcomes, effectively controlling for potential confounds arising from between-course characteristics.
However, it is important to note that while multilevel modeling controls for between-course confounders, it does not automatically account for confounding variables that vary within each course. For example, within a single course, the observed better performance associated with ZTC designation might be due to the instructor employing more effective pedagogical approaches rather than the ZTC practice itself. Therefore, when possible, within-entity covariates should still be statistically controlled for to ensure accurate inference. In our study, we statistically controlled for the two within-course variables, academic years and semesters, the only two within-course variables available besides our key predictor and outcomes of interest. Other potential within-course confounders might include differences or changes in instructors, as well as variations in curriculum and pedagogy within the same course. Unfortunately, these types of variables are not available in our dataset, which is a limitation of our study. Furthermore, despite a modest enhancement in control mechanisms, this study remains correlational and cannot establish causality.
Analyses Setup
Multilevel regression modeling was conducted using the lmerTest package (version 3.1-3) in R (version 4.4.2). Separate models were built to predict each of the three course outcomes: GPA, withdrawal rates, and seats fill rates.
A crucial step in multilevel modeling is specifying the nested structure of the data. In our analyses, we account for two levels: course and section, with multiple sections nested within each course (see Figure 1). The intercepts of the outcomes were modeled as random effects to capture variability in average GPA, withdrawal rates, and seats fill rates across different courses.
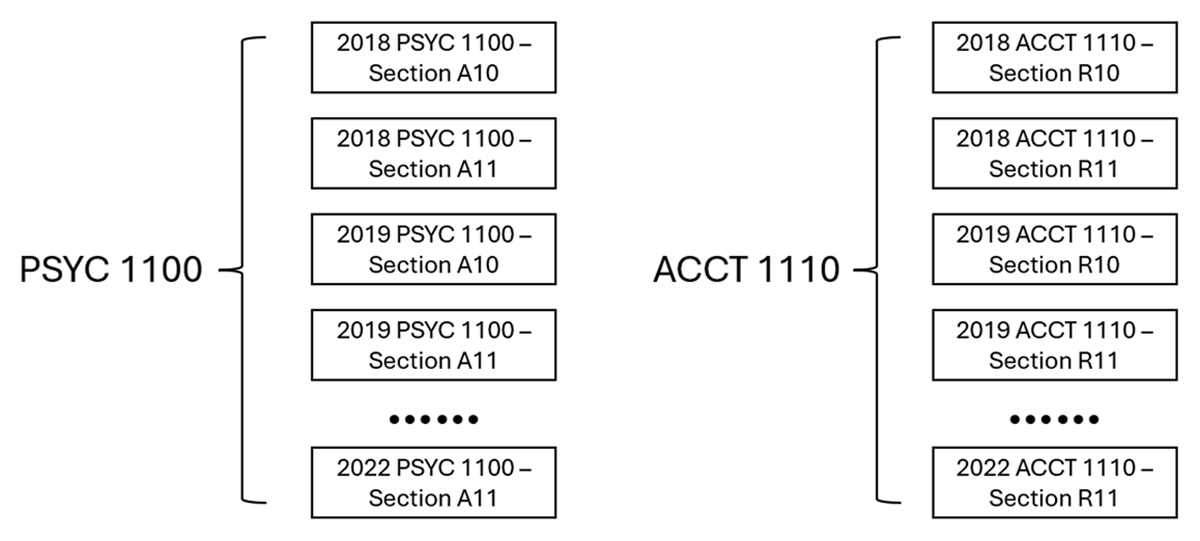
Figure 1
Specification of Nested Data Structure for Multilevel Modelling.
Note: This figure illustrates how the nested structure was set up for our analyses using multilevel modeling. Course sections offered over the years were specified to be nested within each course.
ZTC designation, the primary predictor of interest, was included in the model to assess whether course outcomes differ between course sections that endorse ZTC practices and those that do not. This estimates the relationship between ZTC endorsement and the outcomes within the same course, representing a within-course association. We allowed this association to vary across courses to reflect our belief that the relationship between ZTC endorsement and the outcomes may differ across courses.
Within-course covariates, including the term and academic year, were incorporated into the models to control for their potential confounding effects on the association between ZTC endorsement and course outcomes. Between-course covariates, such as Faculty and course level, were also included. Although the inclusion of between-course covariates is unlikely to substantially impact our estimates of the within-course associations, they were added to provide readers with insights into their relationships with the outcomes of interest.
Finally, we also tested interactions between ZTC designation and the covariates to determine if the relationship between ZTC designation and the outcomes varies as a function of the covariates. However, none of these interactions achieved statistical significance, so they were excluded from our final statistical models.
Findings and Discussion
Findings
Table 4 presents a comparison between unclustered and clustered means of the outcome variables based on ZTC status, with the additional inclusion of the aggregate proportions of students who earned letter grades of A or B (“AB rates”) and those who earned letter grades of D or F, or who withdrew from the course (“DFW rates”). The table reveals that most ZTC-related differences in the outcomes are slightly larger in absolute magnitude when clustering by course is not considered, with AB rates being an exception. Even when the differences between unclustered and clustered means appear small, their relative ratios tell a different story. For example, in the case of seats fill rates, the ZTC-related differences derived from unclustered and clustered means were –0.7% and –0.1%, respectively. Although the absolute difference between these values is only 0.6% points, the ZTC-related difference from the unclustered means is seven times as great as that from the clustered means, indicating substantial inflation. This level of inflation justifies our choice of multilevel modeling over the t-test.
Table 4
Outcomes by ZTC status (unclustered and clustered means).
| OUTCOMES | UNCLUSTERED MEANS | CLUSTERED MEANS | ||||
|---|---|---|---|---|---|---|
| NON-ZTC | ZTC | DIFFERENCE | NON-ZTC | ZTC | DIFFERENCE | |
| GPA | 2.64 | 2.91 | 0.27 | 3.02 | 3.07 | 0.05 |
| Seats Fill Rates | 78.40% | 77.70% | –0.70% | 69.00% | 68.90% | –0.10% |
| Withdrawal Rates | 8.00% | 6.70% | –1.30% | 6.10% | 6.10% | 0.00% |
| AB Rates | 24.50% | 22.90% | –1.60% | 76.20% | 77.80% | 1.60% |
| DFW Rates | 17.80% | 15.50% | –2.30% | 12.10% | 11.60% | –0.50% |
[i] Note. The difference is calculated by subtracting the values for the non-ZTC condition from those for the ZTC condition. Analyses of AB and DFW rates were not included in the main manuscript. Please refer to Appendix B for the definitions of these variables, the results of their analyses, and an explanation for their exclusion.
Outcome: GPA
Controlling for other variables in the model, ZTC designation was a significant predictor of GPA (B = 0.04, 95% CI [0.00, 0.08], d.f. = 327.87, p = .03). Within a given course, sections that qualified for the ZTC designation achieved a GPA that was 0.042 points higher out of 4.33 on average compared to sections without ZTC practices. Although statistically significant, this difference was small. Additionally, the estimated association showed little variation across courses, with a 95% trimmed range between 0.022 and 0.111 after excluding 5% of outliers. This indicates that for approximately 95% of the courses, the estimated GPA difference between ZTC and non-ZTC sections was minimal.
Outcome: Seats Fill Rates
Controlling for other variables in the model, the association between ZTC designation and seats fill rates was not statistically significant (B = 0.01, 95% CI [–0.01, 0.02], d.f. = 177.95, p = .38). This suggests that, within a given course, there is almost no difference in average seats fill rates between sections that endorse ZTC practices and sections without ZTC practices. Additionally, the estimated association demonstrated little variation across courses, with a 95% trimmed range between –0.021 and 0.031 after excluding 5% of outliers. This indicates that for approximately 95% of the courses, the estimated difference in seats fill rates between ZTC-endorsed and non-ZTC sections was minimal.
Outcome: Withdrawal Rates
Controlling for other variables in the model, the association between ZTC designation and course withdrawal rates was not statistically significant (B = –0.00, 95% CI [–0.01, 0.00], d.f. = 313.45, p = .09). This suggests that, within a given course, there is almost no difference in average withdrawal rates between ZTC and non-ZTC sections. Additionally, the estimated association demonstrated minimal variation across courses, with a 95% trimmed range between –0.01 and 0.00 after excluding 5% of outliers. This suggests that for approximately 95% of the courses, the estimated difference in withdrawal rates between ZTC and non-ZTC sections was minimal.
Key Takeaways
Overall, our analyses showed that within the same course, there were no statistically significant or substantial differences in GPA, withdrawal rates, and seat fill rates between sections with ZTC designations and those without. Moreover, the lack of significant impact of ZTC designation on these outcomes was consistent across various factors, including course levels, Faculties, academic years, and academic semesters. These findings suggest that ZTC designation likely does not substantially affect course performance, withdrawal, or enrollment.
Discussion
The present study investigated the impact of KPU’s ZTC program on various educational outcomes from January 2018 to August 2022. A simple reading of differences in mean enrolment, persistence, and performance between ZTC and non-ZTC courses sections initially suggested that the ZTC program had a positive impact on these outcomes, akin to many of the OER efficacy studies that failed to control for instructor or course level effects (e.g., Hilton 2016, 2020; Magro & Tabaei, 2019; Mayer, 2023; Ross et al., 2018). Whereas some previous research that controlled for instructor or student variables also found improved student outcomes from using OER (Colvard et al., 2018; Jhangiani et al., 2018; Winitzky-Stephens & Pickavance, 2017), the present study employed rigorous multi-level modeling that controlled for both between-course (Faculty, course level) and within-course (semester, academic year) sources of variation and which failed to reveal differences between ZTC and non-ZTC sections that were statistically significant (in the case of seat fill rates and withdrawal rates) or substantial (in the case of GPA). Although this finding stands in slight contrast to the findings of Smith et al. (2020), it is consistent with the findings of Clinton (2018). This lack of observed differences can be attributed to two possible explanations.
First, the ZTC designation itself may not directly influence course outcomes. Other factors such as instructors’ quality of teaching (Martin, 2017), pedagogical practices, and classroom environment (Lindstrom, 2021) may be more relevant contributors to outcomes like academic performance and engagement. Furthermore, while it is possible that instructors who embrace OER or the ZTC approach may also be open to other innovative teaching practices (Jhangiani et al., 2016) and are generally viewed more positively by students (Clinton-Lisell & Kelly, 2024; Pakkal et al., 2024), the ZTC intervention itself may not improve course outcomes for all students. Indeed, according to Grimaldi and their colleagues (2019), it is more likely that removing required textbook costs for students improves learning outcomes only for those students who would not otherwise have had access to course materials (the “access hypothesis”). Without access to student-level data and a very large sample size, this moderated effect is not possible to detect.
Perhaps more surprisingly, our study did not find that ZTC designation was associated with higher seats fill rates, which is unexpected given that the ZTC approach is designed to alleviate the cost burden for students. A possible reason for this finding is that the ZTC designation was not easily visible to students, appearing as an option only in the “advanced search” version of the course timetable.3 As a result, one cannot assume that students—especially those who would have most benefited from the associated cost savings—would have known of the existence of or exercised this optional filter.
Second, the lack of ZTC-related differences in course outcomes may be attributed to suppression effects. Suppression effects refer to other factors that prevent an effect from being detected. In the context of the present study, the ZTC approach may have introduced additional challenges for students such as the use of a curated collection of resources instead of a single textbook and the use of multi-modal resources. Furthermore, most data were collected during the COVID-19 pandemic, a time of rapid changes in delivery modes, course policies, and socio-economic conditions. The challenges associated with navigating these significant changes and their impact on students’ personal lives and academic performance may have negated any potential positive impact of the ZTC program.
Despite the absence of a significant positive effect of the ZTC program on course enrolment and persistence, or a substantial effect on course performance, it is worth underscoring that none of these outcome variables showed a negative impact resulting from the ZTC program. Considering that students benefited from millions of dollars in cost savings during the period in question, this study provides compelling evidence, via rigorous multi-level analysis, that the economic benefits to students from the programmatic use of OER via a ZTC approach does not come at the cost of learning outcomes.
Besides the absence of a ZTC effect for the overall sample, we examined whether ZTC effects might vary by course levels and disciplines. Although our findings indicate that the absence of a ZTC effect was consistent across both course levels and disciplines, this conclusion should be approached with caution. The reason is that for certain majors and course levels—particularly courses above year 3 and those from the design, science/horticulture, and health disciplines—we lacked sufficient observations to reliably estimate the ZTC effect. Consequently, even if ZTC has differential impacts in these areas, our dataset does not include enough observations to detect these differences. Therefore, future studies should aim to gather more comprehensive data from courses above year 3 and from fields such as design, science/horticulture, and health, to more accurately assess the differential impacts of ZTC initiatives.
Conclusion, Implications and Suggestions
Implications for Policy and Practice
The programmatic approach to OER adoption represented by ZTC initiatives has gained recognition for its potential benefits to learners, instructors, and post-secondary institutions. For example, by eliminating the need to purchase expensive commercial textbooks, ZTC initiatives alleviate the financial strain for students in need, thereby improving equitable access to course materials. By embracing the ZTC approach, instructors can ensure that all learners have immediate, irrevocable access to course materials. Furthermore, instructors who select and assign OER as part of their ZTC approach can benefit from greater pedagogical flexibility by availing of the permissions to revise and remix the openly licensed content to reflect their course learning outcomes and instructional preferences. Of course, instructors may elect to go further still, whether by localizing or contemporizing the content to enhance the relevance and currency of the curriculum or by increasing the sociocultural diversity of the curriculum to advance epistemic justice and belongingness. Finally, institutions that support the development of ZTC initiatives can help advance strategic goals, including those related to access, equity, and pedagogical innovation.
Whereas the present study shows that the benefits of ZTC initiatives do not come at the cost of poorer learning outcomes for students, it also highlights the importance of ensuring that the student body is educated about the ZTC initiative. Failing this, it is unreasonable to expect that ZTC initiatives will realize gains in student outcomes over cases in which students learn about the adoption of OER from faculty members during the first day of class. Relatedly, for institutions that have integrated course marking into the timetable or academic calendar, it is essential that students receive guidance on how they can benefit from the option to identify and register in course sections designated as ZTC, which itself should be made as simple and visible as possible.
Finally, this study also underscores the importance of accounting for other sources of variation (both between-course and within-course) when systematically evaluating ZTC initiatives, as well as of obtaining student-level data where possible.
Limitations
Although this study provides valuable insights into the impact of a ZTC program on student outcomes, it is important to acknowledge several limitations that should be considered when interpreting the findings.
The primary limitation of an archival study such as this that draws on institutional-level data is the absence of a true experimental design, including random assignment of students and instructors to ZTC and non-ZTC courses. The lack of randomization introduces the possibility of selection bias, as students may have chosen specific courses or instructors based on unobserved factors that are correlated with ZTC status (e.g., popularity of course, instructor reputation for innovative and engaging teaching, etc.). Similarly, instructors who voluntarily adopt a ZTC approach may hold a belief in its effectiveness, leading them to invest more effort or attention into these courses. These instructors may also adopt other innovative pedagogical strategies and high impact practices. These confounding variables may have influenced the outcomes observed in the study, and their impact cannot be fully accounted for. Indeed, despite the statistical models employed in this study, a substantial portion of the variance in the outcomes remains unaccounted for. This unexplained variance raises concerns about the presence of unobserved confounding variables and undermines the conclusiveness of the findings.
Another notable limitation is that the ZTC designation itself is a superordinate label, and may reflect either the use of any possible combination of four types of course materials (OER, library resources, instructor-created resources, and free online resources) or the absence of any required course materials. While we appreciate that the field continues to be challenged by the confusion of OER with other materials that are free of cost yet not openly licensed and that cost savings is but one benefit of open licensing, we nevertheless recognize that cost is likely the most important dimension for students who are struggling with affordability. However, without course-section level data on the specific nature of the ZTC approach taken, it is impossible to determine whether, for example, not requiring the use of any course materials has a similar or different effect to assigning OER. Furthermore, even when it may be known that an instructor has assigned OER to their students in a given course section, it would not be known whether they are simply adopting the OER or whether they have also adapted (e.g., localized or otherwise customized) the OER prior to adopting it. Given that it is entirely possible for an educator to assign and use OER in a manner that is not meaningfully different from how they might assign and use a commercial textbook, one cannot assume that the use of OER is necessarily designed to unlock its pedagogical benefits. These distinctions and research questions may be tackled by future research.
A third limitation is that our analyses were conducted at the course-section level, rather than at the student level, to which we do not have access. This limitation exposes us and our readers to the potential for ‘ecological fallacy’ (Gnaldi et al., 2018; Walker, 2021), a risk particularly relevant in our study where inferences about the policy’s impact on students are made based on course-level analyses. For example, it would be erroneous to conclude that the ZTC designation did not affect students’ performance, persistence, and interest in enrollment based solely on course-section data, which does not capture individual student variations in these outcomes. It is conceivable that ZTC may benefit some students, impair outcomes for others, and have no effect on the rest—a complexity that can only be uncovered with student-level data. Consequently, while we cannot entirely avoid making speculations about students, we must caution our readers and ourselves to treat such inferences with caution and skepticism.
As noted above, this study is also limited by doubts concerning the sensitivity of the intervention, as the extent to which students were aware of and utilized the optional ZTC filter in the course timetable is unknown. Without access to a manipulation check in this study, it is impossible to know whether the ZTC designation has no substantial effect or whether a potentially significant effect of this approach to course materials is being masked by ignorance of its existence.
Finally, it is possible that the results of this study were impacted by broader societal change precipitated by the onset of the COVID-19 pandemic, which had significant direct (e.g., greater use of digital learning materials, more online learning) and indirect (e.g., limited access to study spaces outside of the home, fewer employment options) effects on the learning environment.
Future research should consider employing mixed methods approaches and collecting student- and instructor-level data to mitigate these limitations. For example, exploring students’ economic and social circumstances can provide a better understanding of how their characteristics interact with access to learning materials. Additionally, incorporating qualitative responses from instructors can shed light on questions related to course design, effort, and instructor disposition, adding valuable context to the observed outcomes. By addressing these limitations, future studies can further enhance our understanding of the impact of ZTC initiatives on student success.
Conclusion
This study represents the first assessment of the impact of a Canadian post-secondary institution’s ZTC initiative. Using rigorous multi-level modeling with a data set that encompassed 13,605 course sections across four academic years, our analyses found no significant differences between ZTC and non-ZTC sections in student course enrolment and persistence, and a small positive impact on student course performance. Considering the significant cost savings enjoyed by students as a result of OER and ZTC initiatives, this study demonstrates that there is no trade-off necessary between cost-savings and student outcomes.
In addition to pointing to the importance of controlling for potential sources of variation (both between-course and within-course) and obtaining student-level data where possible, the study also highlights the critical importance of ensuring that ZTC initiatives are well understood and navigable by the student body.
At a time when the post-secondary sector in many regions of the world is strained by chronic under-funding, when efforts to advance equity and inclusion are being demonized, and when neoliberalism continues to peddle a narrow-minded and impoverished view of the purpose and potential of education, the adoption and expansion of OER/ZTC initiatives should be considered as a strategic priority. By alleviating the cost burden on students while enhancing flexibility for educators, institutions can harness ZTC initiatives to catalyze pedagogical innovation and support student success while simultaneously strengthening the commons and serving social justice.
Data Accessibility Statement
The data that support the findings of this study are available from Kwantlen Polytechnic University but restrictions apply to the availability of these data, which were used under license for the current study, and so are not publicly available. Data are however available from the authors upon reasonable request and with permission of Kwantlen Polytechnic University.
Sustainable Development Goals (SDGs)
This study is linked to the following SDGs: Quality education (SDG 4) and Reduced inequalities (SDG 10).
Appendices
Appendix A
Multilevel Regression Coefficient Tables for the Three Analyses
In this appendix, you are provided with the complete regression outputs. Below is a guide to help you interpret these results. For the current study, all predictors were categorical, and all outcomes were continuous.
Reference Levels for Categorical Predictors
Within-Course:
ZTC_Status = 0: Sections that did not endorse ZTC practice.
Academic Year = 18/19
Semester = Fall
Between-Course:
Faculty = Art
Course Level = 1
Coefficients were not estimated for these reference levels to avoid complete collinearity. The coefficients for other levels within the same variable represent the difference in the outcome between the given category and the reference category (i.e., the outcome value for a specific categorical level minus the outcome value for the reference level). A positive coefficient indicates that the given category has a higher outcome value than the reference category, while a negative coefficient indicates a lower outcome value.
It is important to note whether a variable is a between-course or within-course variable when interpreting the coefficients:
Within-Course Variables: Interpretation is made for course sections within the same course.
Between-Course Variables: Interpretation is made across different courses.
Examples
GPA Outcome:
ZTC_Status = 1 (Within-Course Predictor): The coefficient is +0.04. This means that, after controlling for other variables, sections that endorse ZTC practices have a GPA that is 0.04 points higher on average compared to sections that do not endorse ZTC practices.
Withdrawal Rates Outcome:
Faculty = Health (Between-Course Predictor): The coefficient is -0.061. This means that, after controlling for other variables, the average withdrawal rates for Health faculty courses are 0.061 points lower than those for Art faculty courses.
Detailed output tables are as follows:
Table 1
Multilevel Regression Output for Outcome: GPA (Possible Range 0–4.33).
| PARAMETERS | ESTIMATE | SE | STATISTIC | DF | 95% CI |
|---|---|---|---|---|---|
| Intercept | 2.68a | 0.03 | 80.73 | 1341.60 | (2.61, 2.74) |
| ZTC Status = 1 | 0.04 | 0.02 | 2.20 | 327.87 | (0.00, 0.08) |
| Academic Year 19/20 | 0.14a | 0.01 | 10.65 | 12136.67 | (0.12, 0.17) |
| Academic Year 20/21 | 0.12a | 0.01 | 9.32 | 12113.85 | (0.09, 0.14) |
| Academic Year 21/22 | –0.00 | 0.01 | –0.10 | 12220.81 | (–.03, 0.03) |
| Spring Semester | 0.04a | 0.01 | 3.51 | 12829.37 | (0.02, 0.06) |
| Summer Semester | 0.12a | 0.01 | 8.92 | 12581.28 | (0.09, 0.10) |
| School of Business | –0.17a | 0.04 | –4.13 | 1165.45 | (–.24, –0.09) |
| School of Design | 0.36a | 0.05 | 6.97 | 1465.11 | (0.26, 0,46) |
| Faculty of Health | 1.03 | 0.06 | 17.11 | 1448.94 | (0.91, 1.14) |
| Faculty of Science & Horticulture | –0.13b | 0.04 | –2.86 | 1373.39 | (–.21, –0.04) |
| Course Level 2 | 0.11 | 0.04 | 2.67 | 1240.33 | (0.03, 0.18) |
| Course Level 3 | 0.26a | 0.04 | 6.54 | 1313.13 | (0.18, 0.33) |
| Course Level 4 | 0.45a | 0.05 | 10.01 | 1329.06 | (0.37, 0.54) |
| Course Level 5 | 0.46a | 0.08 | 5.81 | 1119.70 | (0.31, 0.62) |
| Course Level 6 | 0.69a | 0.12 | 5.71 | 1141.37 | (0.45,0.93) |
| sd Intercept | 0.44 | ||||
| cor Intercept & ZTC Status | 0.05 | ||||
| sd ZTC Status | 0.15 | ||||
| sd Residual | 0.52 |
[i] Note: SE = standard error; df = degrees of freedom; 95%CI = lower and upper confidence limits for 95% confidence intervals; aEstimates are statistically significant at p < .001; bEstimates are statistically significant at p < .01.
Table 2
Multilevel Regression Output for Outcome: Seats Fill Rate (Possible Range 0–1).
| PARAMETERS | ESTIMATE | SE | STATISTIC | DF | 95% CI |
|---|---|---|---|---|---|
| Intercept | 0.79a | 0.01 | 57.17 | 1262.21 | (0.76, 0.81) |
| ZTC Status = 1 | 0.01 | 0.01 | 0.87 | 177.95 | (–0.01, 0.02) |
| Academic Year 19/20 | –0.02a | 0.00 | –3.86 | 12425.42 | (–0.02, –0.01) |
| Academic Year 20/21 | –0.03a | 0.00 | –6.74 | 12409.89 | (–0.03, –0.02) |
| Academic Year 21/22 | –0.06a | 0.00 | –15.03 | 12448.50 | (–0.07, –0.05) |
| Spring Semester | –0.02a | 0.00 | –4.35 | 12993.51 | (–0.02, –0.01) |
| Summer Semester | 0.04a | 0.00 | 8.57 | 12751.65 | (0.03, 0.04) |
| School of Business | 0.03 | 0.02 | 1.45 | 1162.79 | (–0.01, 0.06) |
| School of Design | 0.07a | 0.02 | 3.24 | 1300.22 | (0.03, 0.11) |
| Faculty of Health | 0.01 | 0.02 | 0.28 | 1327.32 | (–0.04, 0.06) |
| Faculty of Science & Horticulture | –0.16a | 0.02 | –8.98 | 1270.30 | (–0.20, –0.13) |
| Course Level 2 | –0.10a | 0.02 | –5.79 | 1200.75 | (–0.13, –0.06) |
| Course Level 3 | –0.06a | 0.02 | –3.90 | 1245.93 | (–0.10, –0.03) |
| Course Level 4 | –0.12a | 0.02 | –6.24 | 1254.65 | (–0.16, –0.08) |
| Course Level 5 | –0.15a | 0.03 | –4.23 | 1127.62 | (–0.21, –0.08) |
| Course Level 6 | –0.20a | 0.05 | –3.81 | 1145.47 | (–0.30, –0.01) |
| sd Intercept | 0.20 | ||||
| cor Intercept & ZTC Status | 0.11 | ||||
| sd ZTC Status | 0.05 | ||||
| sd Residual | 0.16 |
[i] Note: SE = standard error; df = degrees of freedom; 95%CI = lower and upper confidence limits for 95% confidence intervals; aEstimates are statistically significant at p < .001; bEstimates are statistically significant at p < .01.
Table 3
Multilevel Regression Output for Outcome: Withdrawal Rate (Possible Range 0–1).
| PARAMETERS | ESTIMATE | SE | STATISTIC | DF | 95% CI |
|---|---|---|---|---|---|
| Intercept | 0.07a | 0.00 | 18.31 | 1339.31 | (0.06, 0.07) |
| ZTC Status = 1 | –0.00 | 0.00 | –1.71 | 313.45 | (–0.01, 0.00) |
| Academic Year 19/20 | 0.02a | 0.00 | 8.44 | 12664.61 | (0.01, 0.02) |
| Academic Year 20/21 | 0.02a | 0.00 | 12.24 | 12669.19 | (0.02, 0.03) |
| Academic Year 21/22 | 0.03a | 0.00 | 13.18 | 12759.523 | (0.02, 0.03) |
| Spring Semester | 0.01a | 0.00 | 5.23 | 13403.79 | (0.01, 0.01) |
| Summer Semester | –0.01b | 0.00 | –2.43 | 13223.56 | (–0.01, –0.00) |
| School of Business | –0.01 | 0.00 | –1.88 | 1024.67 | (–0.02, 0.00) |
| School of Design | –0.06a | 0.01 | –9.87 | 1676.36 | (–0.07, –0.05) |
| Faculty of Health | –0.06 | 0.01 | –9.14 | 1499.50 | (–0.07, –.05) |
| Faculty of Science & Horticulture | 0.02a | 0.01 | 3.20 | 1357.39 | (0.01, 0.03) |
| Course Level 2 | –0.01b | 0.00 | –2.53 | 1174.21 | (–0.02, –0.00) |
| Course Level 3 | –0.01a | 0.00 | –3.34 | 1265.14 | (–0.02, –0.01) |
| Course Level 4 | –0.03a | 0.01 | –5.79 | 1315.89 | (–0.04, –0.02) |
| Course Level 5 | –0.06a | 0.01 | –6.57 | 1022.11 | (–0.07, –0.04) |
| Course Level 6 | –0.08a | 0.01 | –5.92 | 1069.89 | (–0.10, –0.05) |
| sd Intercept | 0.04 | ||||
| cor Intercept & ZTC Status | 0.26 | ||||
| sd ZTC Status | 0.01 | ||||
| sd Residual | 0.08 |
[i] Note: SE = standard error; df = degrees of freedom; 95%CI = lower and upper confidence limits for 95% confidence intervals; aEstimates are statistically significant at p < .001; bEstimates are statistically significant at p < .01.
Appendix B
Associations between ZTC Status and AB and DFW Rates
Definitions
AB rate: the aggregate proportion of students in a course section who earned a letter grade of B- or higher.
DFW rate: the aggregate proportion of students in a course section who 1) earned a letter grade of C- or below and 2) withdrew.
In the main body of the manuscript, we report findings on GPA and withdrawal rates instead of AB rates and DFW rates because continuous variables like GPA offer more nuanced and granular information, enhancing the statistical model’s ability to detect associations or differences. Although AB and DFW rates may appear continuous, they intrinsically categorize participants into binary groups (e.g., AB vs. non-AB; DFW vs. non-DFW). This binary categorization limits the model’s sensitivity to smaller effects, as it reduces the variability and nuances that continuous variables like GPA can capture. For example, assuming a ZTC program has a positive impact on students’ grades, if we measure the impact of the program by looking at AB or DFW rates, the program would need to cause a substantial number of students to move from the non-AB category to the AB category, or from the DFW category to the non-DFW category. In short, the program would need to have a large effect to be noticeable. However, if instead we measured the impact of the program by looking at GPA, we would be more likely to be able to detect smaller improvements, as with a student’s grade improving from a C- to a C or from an F to a D.
For interested readers, we provide the findings concerning AB and DWF rates below, which show that ZTC-status was not significantly associated with differences in these two outcomes.
Table 4
Multilevel Regression Output for Outcome: AB Rate (Possible Range 0–1).
| PARAMETERS | ESTIMATE | SE | STATISTIC | DF | 95% CI |
|---|---|---|---|---|---|
| Intercept | 0.64a | 0.01 | 64.38 | 1369.32 | (0.62, 0.66) |
| ZTC Status = 1 | 0.01 | 0.01 | 1.35 | 328.57 | (–.00, 0.02) |
| Academic Year 19/20 | 0.05a | 0.00 | 12.00 | 12341.53 | (0.04, 0.06) |
| Academic Year 20/21 | 0.04a | 0.00 | 9.54 | 12332.88 | (0.03, 0.05) |
| Academic Year 21/22 | 0.00 | 0.00 | 0.31 | 12445.52 | (–0.01, 0.01) |
| Spring Semester | 0.02a | 0.00 | 4.23 | 13056.75 | (0.01, 0.02) |
| Summer Semester | 0.03a | 0.00 | 7.42 | 12835.57 | (0.02, 0.04) |
| School of Business | –0.05a | 0.01 | –4.10 | 1155.72 | (–0.07, –0.03) |
| School of Design | 0.15a | 0.02 | 9.28 | 1539.20 | (0.11, 0.18) |
| Faculty of Health | 0.24a | 0.02 | 13.21 | 1491.89 | (0.20, 0.28) |
| Faculty of Science & Horticulture | –0.06a | 0.01 | –4.14 | 1402.14 | (–0.08, –0.03) |
| Course Level 2 | 0.04a | 0.01 | 3.55 | 1248.46 | (0.02, 0.07) |
| Course Level 3 | 0.01a | 0.01 | 8.23 | 1328.22 | (0.07, 0.12) |
| Course Level 4 | 0.15a | 0.01 | 11.24 | 1356.55 | (0.13, 0.18) |
| Course Level 5 | 0.16a | 0.02 | 6.63 | 1117.37 | (0.11, 0.21) |
| Course Level 6 | 0.25a | 0.04 | 6.82 | 1140.22 | (0.18, 0.32) |
| sd Intercept | 0.13 | ||||
| cor Intercept & ZTC Status | 0.02 | ||||
| sd ZTC Status | 0.05 | ||||
| sd Residual | 0.17 |
[i] Note: SE = standard error; df = degrees of freedom; 95%CI = lower and upper confidence limits for 95% confidence intervals; aEstimates are statistically significant at p < .001; bEstimates are statistically significant at p < .01.
Table 5
Multilevel Regression Output for Outcome: DFW Rate (Possible Range 0–1).
| PARAMETERS | ESTIMATE | SE | STATISTIC | DF | 95% CI |
|---|---|---|---|---|---|
| Intercept | 0.20a | 0.01 | 29.34 | 1439.09 | (0.18, 0.21) |
| ZTC Status = 1 | –0.01 | 0.01 | –1.76 | 366.83 | (–0.02, 0.00) |
| Academic Year 19/20 | –0.02a | 0.00 | –4.95 | 12451.84 | (–0.02, –0.01) |
| Academic Year 20/21 | –0.01 | 0.00 | –1.58 | 12443.43 | (–0.01, 0.00) |
| Academic Year 21/22 | 0.02 | 0.00 | 6.03 | 12542.06 | (0.01, 0.03) |
| Spring Semester | –0.00 | 0.00 | –1.55 | 13127.25 | (–0.01, 0.00) |
| Summer Semester | –0.03a | 0.00 | –9.60 | 12950.47 | (–0.04, –0.03) |
| School of Business | 0.01 | 0.01 | 1.16 | 1151.94 | (–0.01, 0.03) |
| School of Design | –0.10a | 0.01 | –9.86 | 1728.34 | (–0.13, –0.08) |
| Faculty of Health | –0.13a | 0.01 | –10.69 | 1591.69 | (–0.15, –0.11) |
| Faculty of Science & Horticulture | 0.04 | 0.01 | 4.71 | 1473.50 | (0.02, 0.06) |
| Course Level 2 | –0.04a | 0.01 | –5.48 | 1284.07 | (–0.06, –0.03) |
| Course Level 3 | –0.07a | 0.01 | –9.29 | 1383.45 | (–0.09, –0.06) |
| Course Level 4 | –0.10a | 0.01 | –11.38 | 1423.78 | (–0.12, –0.09) |
| Course Level 5 | –0.13a | 0.02 | –8.05 | 1127.72 | (–0.16, –0.01) |
| Course Level 6 | –0.17a | 0.02 | –7.19 | 1165.43 | (–0.22, –0.12) |
| sd Intercept | 0.081 | ||||
| cor Intercept & ZTC Status | –0.04 | ||||
| sd ZTC Status | 0.03 | ||||
| sd Residual | 0.13 |
[i] Note: SE = standard error; df = degrees of freedom; 95%CI = lower and upper confidence limits for 95% confidence intervals; aEstimates are statistically significant at p < .001; bEstimates are statistically significant at p < .01.
Notes
[9] KPU’s operational definition of “ZTC” also includes course sections that have no required textbook; however, if students are required to pay for lab manuals or homework systems the course section cannot be designated as ZTC. Studio fees and equipment such as calculators or art supplies do not impact the ZTC designation (Kwantlen Polytechnic University, n.d.).
Ethics and Consent
This study received ethics clearance from Brock University’s Research Ethics Board for the research-based secondary use of data (File 22-201 JHANGIANI).
Acknowledgements
The authors wish to thank Dr. Alan Davis, Dr. Diane Purvey, and Dr. Lori McElroy from Kwantlen Polytechnic University for their support in advancing this project.
Competing Interests
Between 2014 and 2022 KPU’s OER and ZTC initiatives were led by the first author, who served in academic leadership positions at KPU including Special Advisor to the Provost on Open Education, Associate Vice Provost, Open Education, and Associate Vice President, Teaching and Learning.
The second and third authors have no competing interests to declare.
Author Contributions (CRediT)
Rajiv Jhangiani: Conceptualization, data curation, supervision, project administration, writing—original draft, writing—review and editing; Oya Pakkal: formal analysis, project administration, writing—original draft, writing—review and editing; Xiaoyang Xia: methodology, formal analysis, writing—original draft, writing—review and editing. All authors have read and agreed to the published version of the manuscript.