
Introduction
Basically, MOOCs “provide a structured curriculum around a given theme or topic, but learners are expected to be autonomous and manage their own learning by making their own social and conceptual connections to suit their own needs” (Tschofen & Mackness, 2012, p. 126). After 10 years in their history, MOOCs have reached more than 220 million learners and 19 thousand courses (Shah, 2021). Enrolling in open online courses is quite different from enrolling in conventional courses (Kruchinin, 2019). With this enrollment freedom in MOOCs, the massive number of learners in MOOCs has led to the problem of low completion rates (e.g., Jordan, 2014; Reich & Ruipérez-Valiente, 2019) as it has been the case for distance education (Gündüz & Karaman, 2020). Furthermore, the prevalence of low completion rates and accordingly high dropout rates often became a central argument for MOOC critics in the MOOC discourse (Bozkurt, 2021; Lackner et al., 2015). However, there are some issues associated with traditional completion rates that will be addressed in this study. For instance, traditional completion rates incorporate the learner group who never accessed the learning material (Meinel et al., 2014). Calculating the completion rate solely based on initial enrollment is an ineffective metric to evaluate the success of MOOCs as the evidence shows that most participants who enroll in MOOCs do not start participating in the MOOC in any way (Perna et al., 2014; Reich & Ruipérez-Valiente, 2019; Rieber, 2017). In other words, many participants who sign up for a MOOC do not engage in any activities within the course; some of them do not even begin the MOOC. Supporting this, Jansen et al. (2020) reported that 39% (955 out of the 2,426) of MOOC learners never performed any behavior in the MOOC in their research sample. This raises the concern of including these learners in the traditional calculation of completion rates. The more realistic metric to judge the success of a MOOC is considering the level of activity among learners who really participate in the MOOC (Rieber, 2017). When completion is defined based on a percentage of active learners in courses, the wider range was observed (Jordan, 2014).
Despite the many criticisms, certification rates can describe and evaluate MOOCs when they are properly contextualized (Chuang & Ho, 2016). One of the considerations can be the focus on learner intentions. Completion rates can be calculated based on a percentage of students enrolled in a course having the intention to complete the course and to receive a certificate (Reich, 2014). Traditional certification rates ignore participant intentions as well, and in this way, it leads to inappropriate comparisons with residential certification rates, which is more consistent regarding participant intention to certify (Chuang & Ho, 2016). Because of these issues and corresponding criticisms caused by these issues, the educational value of MOOCs is being undervalued.
Purpose of the Study
This paper seeks to draw together the different approaches to present MOOC completion rates comprehensively, which was mostly available standalone in previous research studies. The paper intends to synthesize these separate approaches into a comprehensive overview and understanding. The purpose of this study is to examine MOOC completion rates based on three perspectives using four MOOCs provided by Bilgeİş MOOC Portal. This study focuses on the following research question: What are completion rates based on traditional and alternative approaches in MOOCs?
This study provides an overall view of MOOC completion rates from three different perspectives, which are calculated based on enrolled learners, active learners, and learner intentions in four MOOCs. By conducting a comparison of MOOC completion rates, a thorough comparison can be made regarding the MOOC completion rates. In addition, despite the widespread low completion rates criticism in the relevant literature, it becomes possible to highlight that the completion rates indeed are not as low as commonly located in the literature. This study can help change the prevailing notion of low MOOC completion rates. Particularly, this study employs a comparative approach to investigate completion rates, facilitating a more detailed analysis and a deeper comprehension. This comparative approach can help to identify more diverse learners who exhibit different behaviors in MOOCs, and this understanding may inform the development of strategies to improve completion rates for a wider group of learners with different behaviors in future MOOCs. By examining completion rates, this study has the potential to inform the development of more inclusive and equitable educational opportunities, especially in developing countries. The paper makes a significant contribution to the broader field of MOOC research, specifically focusing on the complex domain of MOOC completion. Through a comprehensive and holistic analysis of previously explored concepts, this study offers a compelling contribution to the field, presenting original content and a valuable synthesis that enriches scholarly discourse. Unlike existing studies, this research boldly challenges the conventional belief of low MOOC completion rates in distance education, shedding new light on the practicality and effectiveness of MOOCs. Additionally, this study provides novel and innovative suggestions, particularly for MOOC designers, developers, and providers.
Literature
MOOC Completion and Dropout
MOOCs provide a new field for educating people, yet there is no consensus on how to define and characterize success and persistence in MOOCs (Evans & Baker, 2016). Various definitions of MOOC completion are available (Jordan, 2015). In the relevant literature, MOOC completion and dropout have been used by different terms such as persistence, retention, success, attrition, noncompletion. Completion rate has been calculated basically as the fraction of individuals who initially enroll and successfully finish a course based on the course requirements (Jordan, 2014; Koller et al., 2013). In the earliest MOOC research, MOOC learners on edX were assessed in the same way with the on-campus students through homework assignments, labs, and exams. Taking these into account, “success” in one MOOC was defined as the grades students earned. This “success” was kept equal as “achievement” (Breslow et al., 2013, p. 20). Later, Jordan (2015) located several MOOC completion definitions. Earning a certificate was the most prevalent definition provided in 93 MOOCs out of 129 MOOCs followed by completed course, passed course, and completed assignments. In another study, retention was operationalized as “number of days between the start of the MOOC and the last day of activity by the student” (Xiong et al., 2015, p. 28). Pursel et al. (2016) operationalized course completion in their study as “the number of quizzes and reflection surveys completed” (p. 207). Halawa et al. (2014) defined dropout in two ways, either the MOOC student has been absent in the course for more than one month or the MOOC student has viewed less than 50% of the course videos. Indeed, their findings showed that being absent exceeding three weeks is related to dropout on multiple performance metrics.
Although completion rate is a convenient and simple metric, the interpreted completion rates can provide misleading views about the online course because this rate fails to include the diversity of goals and engagement patterns of the learners (Koller et al., 2013). For this reason, a better approach can be utilized for completion rates. In other words, completion rates can be calculated based on a percentage of students enrolled in a course having the intention to complete the course and to receive a certificate (Reich, 2014).
MOOC Completion and Dropout Rates
Completion rates in MOOCs have generally been criticized in the literature, and they have been reported low by many research studies. Breslow et al. (2013) studied edX’s first MOOC, where initially, over 155,000 students registered. However, less than 5% of the students who registered for the course at any one time completed the course. Cisel (2014) examined the completion rates in the first French xMOOC. Of 3495 participants who registered for the course, 38.1% (n = 1332) received a certificate. Although 48.5% (n = 1697) of participants were active in the course, they did not obtain any certificate. These participants were referred to as “non completers” because they included participants who were either dropout and auditing learners. Also, some of the participants (13.4%, n = 466) did not go beyond the registration process as they never accessed the course. These participants were referred to as “no-show”. Jordan (2014) examined the initial trends in enrollment and completion of MOOCs by focusing on 91 MOOCs for enrollment numbers and 42 MOOCs for completion from three main MOOC portals (Coursera, EdX, and Udacity). Completion rates were found to change between .9% and 36.1%. In the data, 5% completion rate was the typical rate. Courses characterized active users as students who engaged in the course material to some extent as opposed to enrolled users who did not use the course materials at all.
When completion rates are calculated as the percentage of active students who completed the courses, this time completion rates ranged from 1.4% to 50.1%. Jordan (2015) revisited the MOOC completion rates. The dataset of the study included 221 MOOCs from different MOOC providers. Completion rates, calculated by the traditional method, varied between .7% and 52.1% having the median value of 12.6%. Similar to Jordan’s works, Hew and Cheung (2014) summarized the accumulated state of knowledge concerning the use of MOOCs, and they reported that the dropout rates in MOOCs are high, and the courses are completed by only 10–20% of students. Henderikx et al. (2017) reported the completion rates using the traditional approach for two MOOCs as 6.5% and 5.6%, respectively. Reich and Ruipérez-Valiente (2019) have provided the recent analysis results by analyzing data of all MOOCS which were provided on edX platform covering the dates between October 2012 and May 2018. The striking conclusion was that the growth in MOOC participation has been significant in the world’s wealthy countries from the developed world, and not surprisingly low completion rates in the MOOCs has not shown any improvement over six years. Moreover, most people who register for a MOOC leave the MOOC right after enrollment, and particularly, 52% of those who register for a MOOC never start the course (Reich & Ruipérez-Valiente, 2019).
In brief, completion rates in MOOCs have been highly researched in the literature using MOOC from various MOOC providers. Completion rates have been reported low by many research studies as mentioned above, and these studies as well as the media have criticized the low completion rates. Then other research studies have begun to appear in the literature, which approached completion rates from different perspectives using different measures in addition to the traditional metrics.
Intention and Completion
As mentioned earlier, completion rates have been used to measure the success of a MOOC. However, Reich (2014) criticized how completion rates were calculated and evaluated. He asked whether the participants in MOOCs who dropped out from the course had really wanted to complete the course before starting. Moreover, Koller et al. (2013) argued that retention should be examined carefully considering the intentions of learners as learners, who choose to enroll in MOOCs, have varied backgrounds and motivations. Studying completion rates among learners who actually start the courses with an intention to complete them is important due to the variation in student intent (Koller et al., 2013). These gave importance to the intentions of MOOC learners before starting the MOOC, and therefore, it is important to assess their intentions before reporting completion rates. Intention is “the key index of a person’s mental readiness for action” (Sheeran, 2002, p. 29). Intentions are “indications of how hard people are willing to try, of how much of an effort they are planning to exert, in order to perform the behavior” (Ajzen, 1991, p. 181).
Accordingly, several studies focused on learner intent and completion in MOOCs. Reich (2014) investigated completion and retention in the context of student intent. Following an unweighted course average (the number of registrants in each MOOC was ignored), 65% of MOOC students attempted at least one action while 35% never entered the courses, and 6% of MOOC students earned a certificate. In detail, the certification rates (the percentage of all students who obtained a certificate) in these courses was found to range from 2% to 11.2% with an average of 5.9%. The results also showed that the certification rates varied significantly among students who reported different intentions. The percentages of earning a certificate changed between 9.1% and 35.7% among students who stated their intention to earn a certificate. The average of certificate earners in this way was 22.1%. In another study, Engle et al. (2015) asked students about their intentions for the course. When students who completed either some or all course exams were compared to students who did not take any exams, it was found that students self-reporting intention to complete all course activities were more likely to complete either some or all course exams. This shows intention is likely to impact students’ course activity completion in the courses. Pursel et al. (2016) examined MOOC students’ intended behaviors to better understand the factors which are indicative of MOOC completion using a course on Coursera platform. In their study, 66% of the MOOC students in the pre-course survey either agreed or strongly agreed with the intention to earn a statement of accomplishment. They found out that student expectations and plans for the MOOC predicted the MOOC completion. In other words, MOOC students who planned to watch all MOOC lectures, and who agreed that they would obtain a statement of accomplishment, and who intended to be active in the course (i.e.,‘not just visiting’) had higher course completion probability than others who indicated otherwise. Henderikx et al. (2017) reported the completion rates using the traditional approach for two MOOCs as 6.5% and 5.6%, respectively. The completion rates from the perspectives of the MOOC-takers based on their intentions were 59% and 70%, respectively.
When completion rates are calculated considering MOOC learners’ intentions, the rates are mostly higher than the traditional completion rates. This makes intention an important valuable construct in MOOC environments. When the effect of learners’ intention on MOOC completion was evaluated, the relevant literature showed that learners’ intention to complete the course significantly influenced the probability of their MOOC completion. Previous studies on MOOC completion primarily focused on developed countries. This study addresses the completion rates of MOOCs in a developing country, which is often overlooked in existing research. Understanding dropout rates and characteristics as well as identifying methods to reduce dropout, are also crucial in developing countries. This study fills the gap in knowledge by examining MOOC completion rates from multiple perspectives at the same time, building upon and expanding existing literature. Knowledge about MOOCs in developing countries is still very limited. Given the earlier findings from the literature in developed countries, this research also aimed to reveal the situation of MOOC completion in a developing country and/or verify whether they are in parallel with the common understanding of low MOOC completion rates. Also, it aims to understand whether the MOOC dropout phenomenon also holds for a developing country, providing a more balanced look using three perspectives.
Methods
For the purposes of describing and interpreting what is happening (Cohen et al., 2007) about MOOC completion rates, this quantitative study benefited from the descriptive research method. Before the study, the ethical approval was obtained from Middle East Technical University Human Subjects Ethics Committee. As the research context, Bilgeİş MOOC Portal (bilgeis.net) was used. A total of four MOOCs (two for technical skills and two for soft skills) were selected by using a three-stage sampling strategy. The data were collected using system logs and an intention survey with four options provided by Reich (2014). The system logs were used to examine MOOC completion figures. Completion rates based on traditional and alternative approaches in MOOCs were analyzed as follows. The number of participants was recorded on 26th April 2018. Since all the courses are self-paced, the participants can enroll in, start, and complete the course anytime. Open enrollment periods and use of course resources with no restrictions leads to challenges regarding analysis and design in MOOCs. For this reason, the relevant time or times is required in these courses for longitudinal research with the constraint that the analysis results tend to rely on the specification of time/times (Ho et al., 2014). In the literature, there are different time indicators for calculating these rates. Perna et al. (2014) used a 2-month cutoff date for standardizing the length of time to count registrants as most MOOCs are open for registration even if they run between specific dates. Halawa et al. (2014) located drop out as absence times exceeding 3 weeks due to the drops on multiple performance metrics. Wang et al. (2017) obtained the clickstream log data 3 months after the course was officially concluded. For these reasons, the completion and non-completion rates were calculated on 9th July 2018 after waiting for 75 days.
Each MOOC is likely to have a different definition and calculation for completion. For example, Jordan (2015) located several MOOC completion definitions. Earning a certificate was the most prevalent definition. In a study, completion was defined as obtaining an overall grade average exceeding 70% or above, and this rate was calculated based on the average of six highest grades earned out of eight assignments (Crossley et al., 2017). This issue primarily leads to some problems regarding calculation and comparison of the completion rates in the literature. The definition used in the current study was that “grades obtained 70 or above from course quizzes and/or course assignments/projects”. As mentioned above, the calculation was carried out based on three approaches.
The participants were grouped into three distinct categories based on their behaviors in MOOCs: non-starters, non-completers, and completers. Non-starters are the participants who registered for the MOOC, but never carried out any activity. Non-completers are the participants who started to carry out some activity in the MOOC, but failed to satisfy the required criteria, and therefore, did not finish it. Completers are the participants who successfully completed the MOOC after satisfying the required criteria and got a certificate of completion. Traditional completion rates based on enrolled participants were calculated by dividing the number of completers by the number of total registrations. As an alternative to the traditional approach, completion rates based on active learners (starters) were calculated by dividing the number of completers by the number of active learners, who are the learners who started MOOCs after registration. As the second alternative to the traditional approach, learner intentions were used. Intention is one’s self-evaluation of course participation. In the beginning of the courses, the participants were asked to answer an intention survey including four distinct participant intent categories: unsure, browse, audit, and complete. To calculate the completion rates based on intention, the number of completers was divided by the number of participants who stated their intention as complete. Completion rates have been calculated based on traditional and alternative approaches. These were reported using descriptive statistics in the form of frequencies and percentages.
Findings and Discussion
The first MOOC was DPP (Dealing with Problematic People) with the total enrollment of 7176. Although the participants registered for the course, 26.80% (n = 1923) of them did not start to take the course at all, and 73.20% (n = 5253) started to take the course. In the 75-day period, of the participants, 3161 completed the course while 2092 of them did not. The completion rate based on enrolled participants was calculated as 44.05% while that based on active learners was calculated as 60.18%. Similarly, the non-completion rate based on enrolled participants was 55.95%, and the non-completion rate based on active learners was 39.82%. Completion rate based on intention was calculated as 66.06%. For DPP MOOC, when completion rates are calculated based on intention, they are higher than traditional completion rates and completion rates based on active learners. The second MOOC was PP-I (Python Programming – I) with the total enrollment of 5666. Although the participants registered for the course, 27.07% (n = 1534) of them did not start to take the course at all, and 72.93% (n = 4132) started to take the course. Of the participants, 1138 completed the course while 2994 of them did not. The completion rate based on enrolled participants was calculated as 20.08% while that based on active learners was calculated as 27.54%. Similarly, the non-completion rate based on enrolled participants was 79.92%, and the non-completion rate based on active learners was 72.46%. Completion rate based on intention was calculated as 31.03%. For PP-I MOOC, when completion rates are calculated based on intention, they are higher than traditional completion rates and completion rates based on active learners. Table 1 provides the completion rates from traditional and active learner perspectives.
Table 1
Completion Rates from Traditional and Active Learner Perspectives.
| MOOCs | TEnr | NS | S | NC | C | CR (ENr) | CR (S) | NCR (ENr) | NCR (S) |
|---|---|---|---|---|---|---|---|---|---|
| DPP | 7176 | 1923 | 5253 | 2092 | 3161 | 44.05% | 60.18% | 55.95% | 39.82% |
| PP-I | 5666 | 1534 | 4132 | 2994 | 1138 | 20.08% | 27.54% | 79.92% | 72.46% |
| VDP | 1561 | 743 | 818 | 626 | 192 | 12.30% | 23.47% | 87.70% | 76.53% |
| DMMA | 1402 | 591 | 811 | 557 | 254 | 18.12% | 31.32% | 81.88% | 68.68% |
| Total | 15805 | 4791 | 11014 | 6269 | 4745 | 30.02% | 43.08% | 69.98% | 56.92% |
[i] Note: TEnr: Total Enrolment, NS: Non-starters, S: Starters, NC: Non-completers, C: Completers, CR (Enr): Completion rate based on enrolled participants, CR (S): Completion rate based on starters, NCR (Enr): Non-completion rate based on enrolled participants, NCR (S): Non-completion rate based on starters.
The third MOOC was VDP (Visual Design Principles) with the total enrollment of 1561. Although the participants registered for the course, 47.60% (n = 743) did not start to take the course at all, and 52.40% (n = 818) started to take the course. Of the participants, 192 completed the course while 626 of them did not. The completion rate based on enrolled participants was calculated as 12.30% while that based on active learners was calculated as 23.47%. Similarly, the non-completion rate based on enrolled participants was 87.70%, and the non-completion rate based on active learners was 76.53%. Completion rate based on intention was calculated as 25.54%. For VDP MOOC, when completion rates are calculated based on intention, they are higher than traditional completion rates and completion rates based on active learners. The fourth MOOC was DMMA (Database Management with MS Access) with the total enrollment of 1402. Although the participants registered for the course, 42.15% (n = 591) did not start to take the course at all, and 57.85% (n = 811) started to take the course. Of the participants, 254 completed the course while 557 of them did not. The completion rate based on enrolled participants was calculated as 18.12% while that based on active learners was calculated as 31.32%. Similarly, the non-completion rate based on enrolled participants was 81.88%, and the non-completion rate based on active learners was 68.68%. Completion rate based on intention was calculated as 34.67%. For DMMA MOOC, when completion rates are calculated based on intention, they are higher than traditional completion rates and completion rates based on active learners.
Completion rates in MOOCs have generally been criticized in the literature, and they have been reported low by many research studies. Accordingly, they have been used as an effective argument to dispute MOOCs by MOOC critics (Lackner et al., 2015). Jordan (2015) reported that completion rates, calculated by the traditional method, varied between .7% and 52.1%. Another comprehensive summary provided by Reich and Ruipérez-Valiente (2019) showed that low completion rates have been maintained over the years. The most important issue to consider here is that all these completion rates were traditional completion rates. The related literature has been dominated by these traditional completion rates, and discussions have aroused from these rates. MOOCs were criticized about their failure based on low course completion rates; however, this might be unfair. The term enrollment in MOOCs only means registration unlike the traditional understanding of taking the course associated with enrollment (Kruchinin, 2019), and enrollment in a MOOC does not provide any guarantee that a learner can or intend to spare enough amount of time to complete the course (Kizilcec & Halawa, 2015). However, traditional completion rates included all participants who enrolled in the MOOCs, and it has been already shown that traditional completion rates incorporate the learner group who never got in touch with the learning material (Meinel et al., 2014). For these reasons, using traditional completion rates for MOOCs is not a wise choice because they tend to be low due to the massive nature of MOOCs. Furthermore, it is not fair to criticize MOOCs due to their low completion rates calculated through the traditional approach. Although they are still relatively low, the traditional completion rates observed in this study are higher than the ones typically reported by previous studies. In brief, calculating the completion rate solely based on initial enrollment is a poor metric to evaluate the success of MOOCs as the evidence shows that and this study also confirmed that most participants who enroll in MOOCs do not start participating in the MOOC in any way (Rieber, 2017).
The more realistic metric to judge the success of a MOOC is considering the level of activity among learners who really participate in the MOOC (Rieber, 2017). Particularly, it was found that 52% of those who register for a MOOC never start the course (Reich & Ruipérez-Valiente, 2019). Similarly, Jordan (2014) reported that approximately 50% of the total enrollment are active students in MOOCs. These were partly confirmed in the current study. In this study, overall non-starter rate was 30.31% for four MOOCs. Calculating completion rates based on active learners, who started the courses after enrollment, makes more sense, and it is more fair than traditional completion rates because they provide more holistic evaluation of MOOCs when MOOC learners who do not even log in the courses are not considered in the calculation of completion rates. This time, based on active learners, completion rates ranged from 1.4% to 50.1%, with a median of 9.8% (Jordan, 2014). Gil-Jaurena et al. (2017) reported the traditional completion rate, which considers the whole enrollment, as 13.71%, and the completion rate based on learners who started the courses as 17.79%. These results showed remarkable differences between the completion rates based on traditional calculations and active learners. This clearly showed that completion rates are higher when they are calculated based on active learners instead of including all enrolled learners in the completion rate calculation. In this study, the completion rates based on active learners were 60.18%, 27.54%, 23.47%, and 31.32% for four MOOCs, and overall, it was 43.08%. The completion rates based on active learners in this study are higher than the ones typically reported by previous studies. This also ensures completion rates when calculated based on these different perspectives, such as considering active learners in the completion rate calculation instead of all enrolled learners etc., provided higher completion rates than the traditional completion rates. It can be said that these rates are higher in Bilgeİş MOOCs as these MOOCs support the learning needs of the learners.
When completion rates are calculated based on intention, they are higher than traditional completion rates and completion rates based on active learners in four MOOCs. Moreover, DPP has the highest course completion rate while VDP MOOC has the lowest course completion rate. Table 2 provides the completion rates based on intention.
Table 2
Completion Rates based on Intention to Complete.
| MOOCs | INTENTION TO COMPLETE | CONSENT GIVEN | COMPLETERS | COMPLETION RATE |
|---|---|---|---|---|
| DPP | 4521 | 4160 | 2748 | 66.06% |
| PP-I | 3338 | 3055 | 948 | 31.03% |
| VDP | 655 | 603 | 154 | 25.54% |
| DMMA | 703 | 646 | 224 | 34.67% |
| Total | 9217 | 8464 | 4074 | 48.13% |
Traditional certification rates ignore participant intentions, and therefore, it leads to inappropriate comparisons with residential certification rates, which is more consistent regarding participant intention to certify (Chuang & Ho, 2016). In MOOCs, it is not clear whether the participants in MOOCs who dropped out from the course had really wanted to complete the course before starting (Reich, 2014). Also, Reeves et al. (2017) reported that MOOC participants intended to receive a free certificate, and they received a free certificate in actuality. These issues gave rise to the intentions of people before starting the MOOC. When completion rates are approached from the learner intention point of view, opposite results are obtained. Reich (2014) showed that the percentages of earning a certificate changed between 9.1% and 35.7% among students who stated their intention to earn a certificate with the average of 22.1%. In edX courses, Chuang and Ho (2016) indicated that ranging from 1% (CS50x) to 82% (a Chinese History module), the median certification rate was 30% among 498 thousand participants who intended to complete the course and earn a certificate in the MOOCs that provided free certificates. Moreover, Henderikx et al. (2017) reported the completion rates using the traditional approach for two MOOCs as 6.5% and 5.6%. The completion rates from the perspectives of the MOOC-takers based on their intentions were 59% and 70%, respectively. In this study, the completion rates based on learner intent were 66.06%, 31.03%, 25.54%, and 34.67% for four MOOCs, respectively, and overall, it was 48.13%. These results were parallel with literature where completion rates are higher when learner intent is considered in calculating the completion rates. This also supports that it is more logical to omit the learners whose intention is not to complete the MOOCs in the calculation of completion rates. The summary of the completion rates is presented in Figure 1.
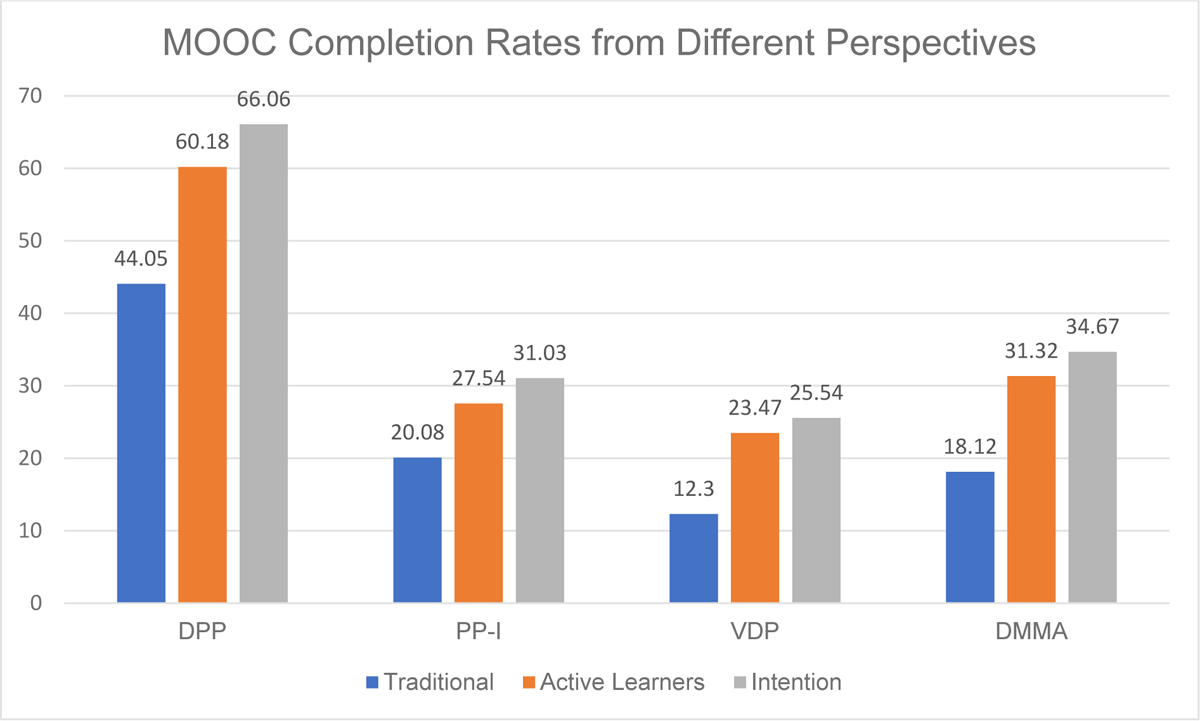
Figure 1
MOOC Completion Rates from Different Perspectives.
Conclusion, Implications and Suggestions
This study showed that when completion rates are calculated considering MOOC learners’ intentions, the rates are the highest compared to traditional completion rates and completion rates based on active learners. Despite the limitations, the most effective measure of MOOC completion rates is to consider learner intent and calculate the completion rates accordingly. This study also showed that low completion rate is a reality in a developing country, regardless of cultural and socio-economic factors as well. This finding supports existing criticisms regarding completion rates. However, it is worth noting that the severity of the issue may not be as pronounced as portrayed by studies based on traditional completion metrics. When viewed from different angles, the completion rates are relatively higher, suggesting a more nuanced understanding of the situation.
This study was limited to four MOOCs provided by Bilgeİş MOOC Portal. This study can be repeated with more courses from different MOOC portals from developing countries. As MOOC portals have begun to appear in developing country contexts, future research studies can focus on comparing developing country and developed country MOOCs with respect to their success rates. Further research should focus on the factors influencing non-start both quantitatively and qualitatively as many of the learners do not log in the courses after registration. Using these data, learners who tend to be non-starters can be located, and they can be supported to start the MOOOCs they registered for. Future research should also focus on whether non-starters start the MOOCs or whether non-completers complete the MOOCs since MOOCs in this study are self-paced, and learners can come back anytime to start or complete the MOOCs. For these self-paced courses, time estimations when non-starters started the MOOCs or when non-completers completed the MOOCs can be calculated. In this way, it can be decided whether to include this learner group into completion rate calculations.
Suggestions for Practice
This study provided suggestions for MOOC designers/developers and MOOC providers. Following suggestions can be made for MOOC designers and developers:
Allow MOOC learners to preview course content without registration to help them decide whether it suits their needs. In this way, they can decide better whether to take the course or not, and dropout rates do not increase.
Customize MOOC presentations based on learners’ preferences. For this reason, learners should be asked why they take the MOOC in the entrance of the course. Based on this information, tailor paths accordingly. For example, a learner might register for a MOOC for auditing the course. For this learner, every resource should be open; however, this learner should not be taken into the calculation of completion rates. A learner might register for learning and be eager to do all course activities. This learner should closely be monitored and supported. A learner might register for learning by watching course video lectures only. This learner should only see the course video lectures, and they should not be required to do course exams or assignments.
As self-paced MOOCs do not have any starting-ending dates, this can be confusing for learners. Therefore, provide novice MOOC learners with introductory materials like videos or infographics via email upon registration to clarify MOOC concepts and processes, promoting smooth enrollment. In this way, MOOC learners cannot have any misconceptions about MOOCs and take MOOCs without any complications.
These suggestions can be made for MOOC providers:
For a robust evaluation of completion rates, rely on completion rates aligned with learner intent or active learners, as traditional rates often include non-participants. When completion rates are calculated using different perspectives, they do not align with the common findings raised in the literature which criticize the low completion rates of MOOCs. Diverse calculations may challenge the prevailing perception of low MOOC completion rates.
Completion rates should be standardized as it is not easy to compare completion rates as a single percentage which are mostly conceptualized differently by other MOOC providers.
Each MOOC provider tends to save data in the way they design the courses. Encourage MOOC providers to establish a common data template for better comparisons across platforms, advancing research on understanding MOOCs’ educational potential.
Promote transparency by openly sharing enrollment and completion data in accordance with ethical guidelines and open learning standards. This transparency fosters comparisons between courses and platforms, enhancing insights into how MOOC field is developing and dispersing the dark clouds over the MOOCs.
Data Accessibility Statement
The datasets used and/or analysed during the current study are available from the corresponding author on reasonable request.
Ethics and Consent
The ethical approval was obtained from Middle East Technical University (METU Applied Ethics Research Center Protocol Number: 2018-EGT-086).
Acknowledgements
This manuscript is based on the first author’s PhD dissertation under the supervision of the second author.
Competing Interests
The authors have no competing interests to declare.
Author Contributions (CRediT)
Berkan Celik: Conceptualization, Investigation, Data curation, Methodology, Formal Analysis, Writing—original draft preparation, Writing – original draft. Kursat Cagiltay: Supervision, Resources, Methodology, Writing—review and editing, Project administration. All authors have read and agreed to the published version of the manuscript.