
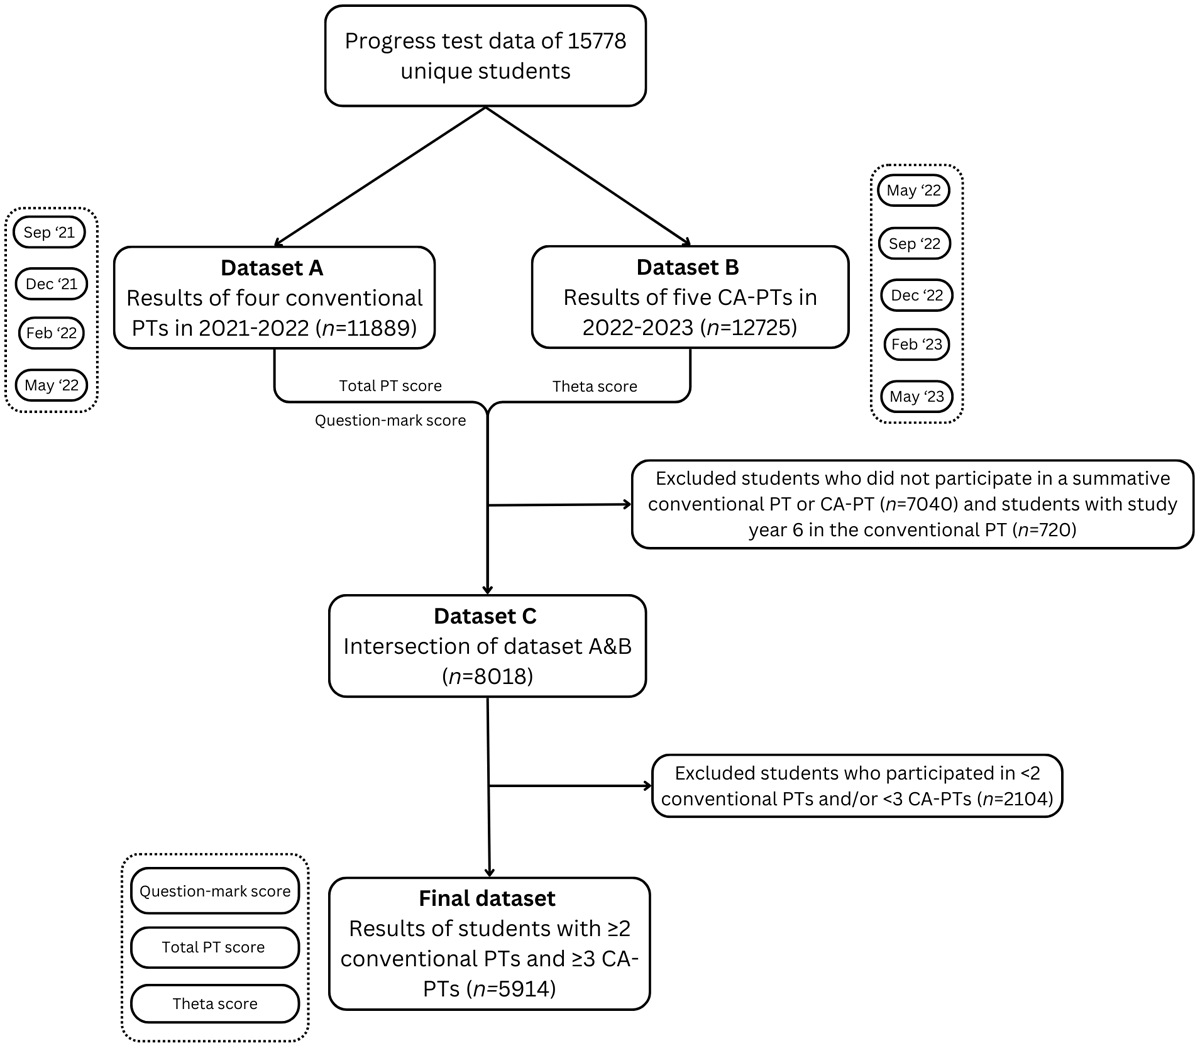
Figure 1
Flowchart of the data collection.

Figure 2
The effect of the question mark score (conventional PT) on the theta score (CA-PT), corrected for the PT score, for each year group. Positive theta scores indicate better-than-average performance, suggesting the individual is performing above the mean level. Negative theta scores suggest below-average performance, indicating the individual is performing below the mean level. The question mark score quantifies how frequently a student uses the “question mark” option. Higher scores indicate more frequent use while lower or negative scores indicate a preference for direct answers.
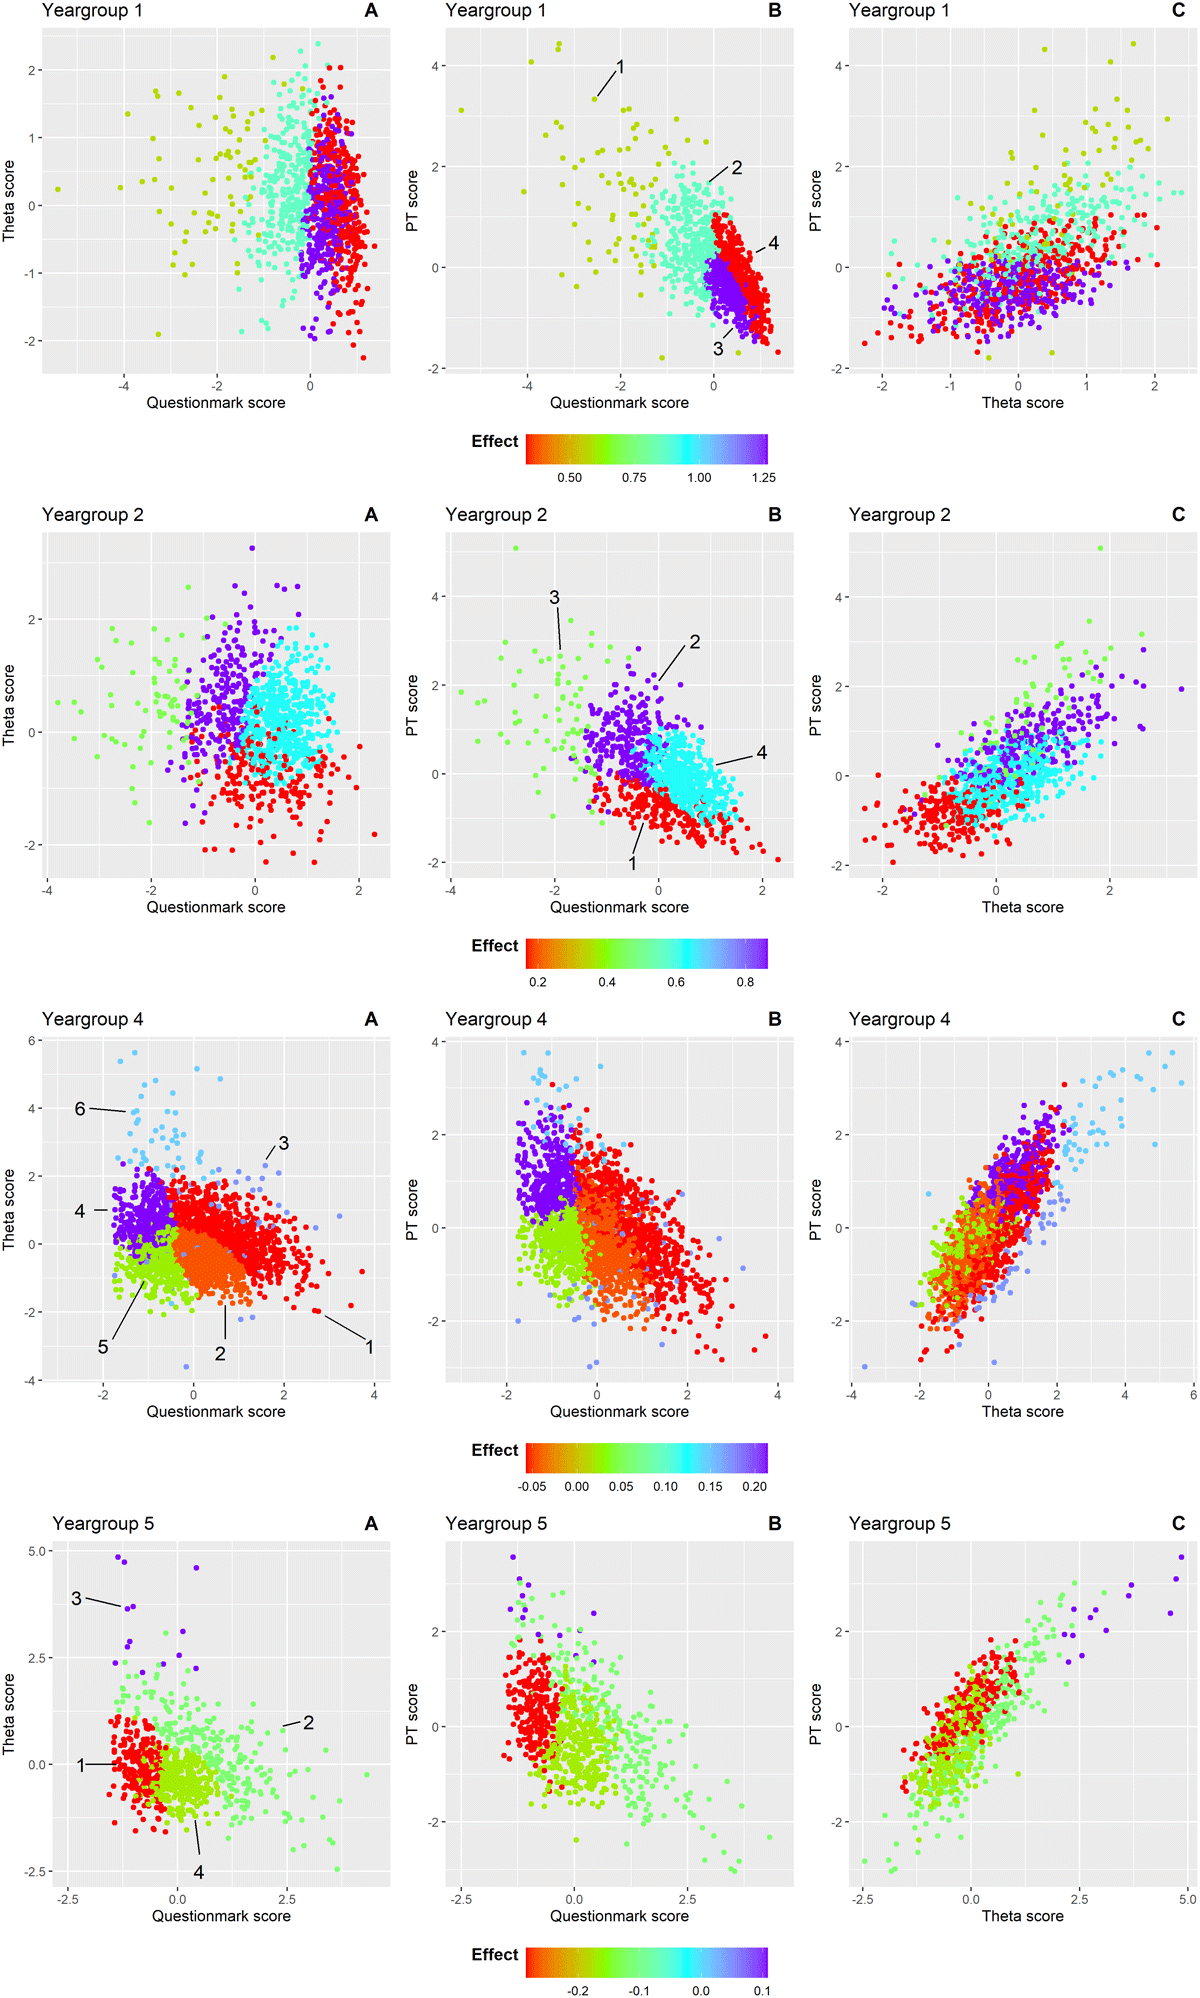
Figure 3
Clusters of students within each year group are shown in scatterplots from three perspectives to illustrate the relationship between question mark use (conventional PT) and theta score (CA-PT), adjusted for overall PT score: A) question mark score versus theta score B) question mark score versus PT score C) theta score versus PT score. The cluster numbers are indicated and encircled in that graph where the clusters are most distinctly separated for each year group. Each point represents an individual student, coloured according to the effect size of the question mark score on the theta score after adjusting for PT score within that cluster. Colours range from red (strong negative effect) to purple (strong positive effect). The color scale is consistent across all graphs within each year group but varies in range across groups to reflect differing effect sizes.
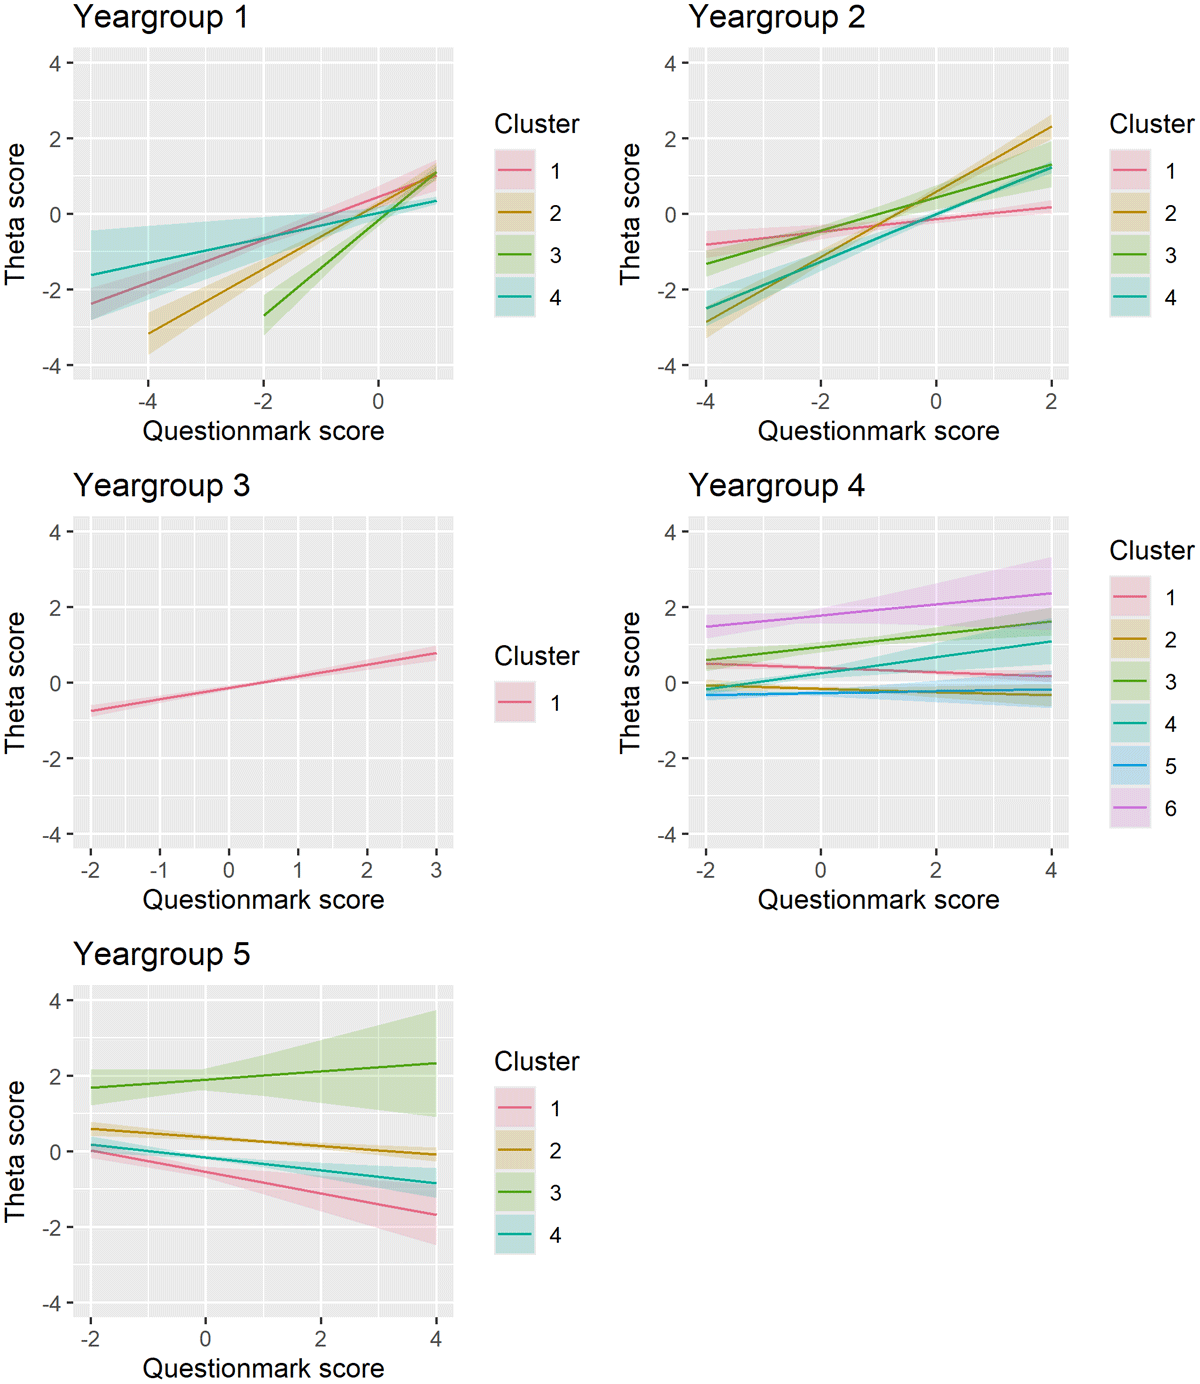
Figure 4
The effect of the question mark score (conventional PT) on the theta score (CA-PT), corrected for the PT score, within each cluster across the five year groups. Each cluster is indicated with a different colour. Optimal clustering solutions were identified using the Bayesian Information Criterion (BIC) and Integrated Complete-data Likelihood (ICL). BIC evaluates the model fit while penalizing complexity, ensuring an appropriate balance between accuracy and simplicity. ICL complements this by emphasizing well-separated and distinct clusters, reducing the risk of overfitting. Together, these criteria provided a framework to determine the number of clusters in each year group.