
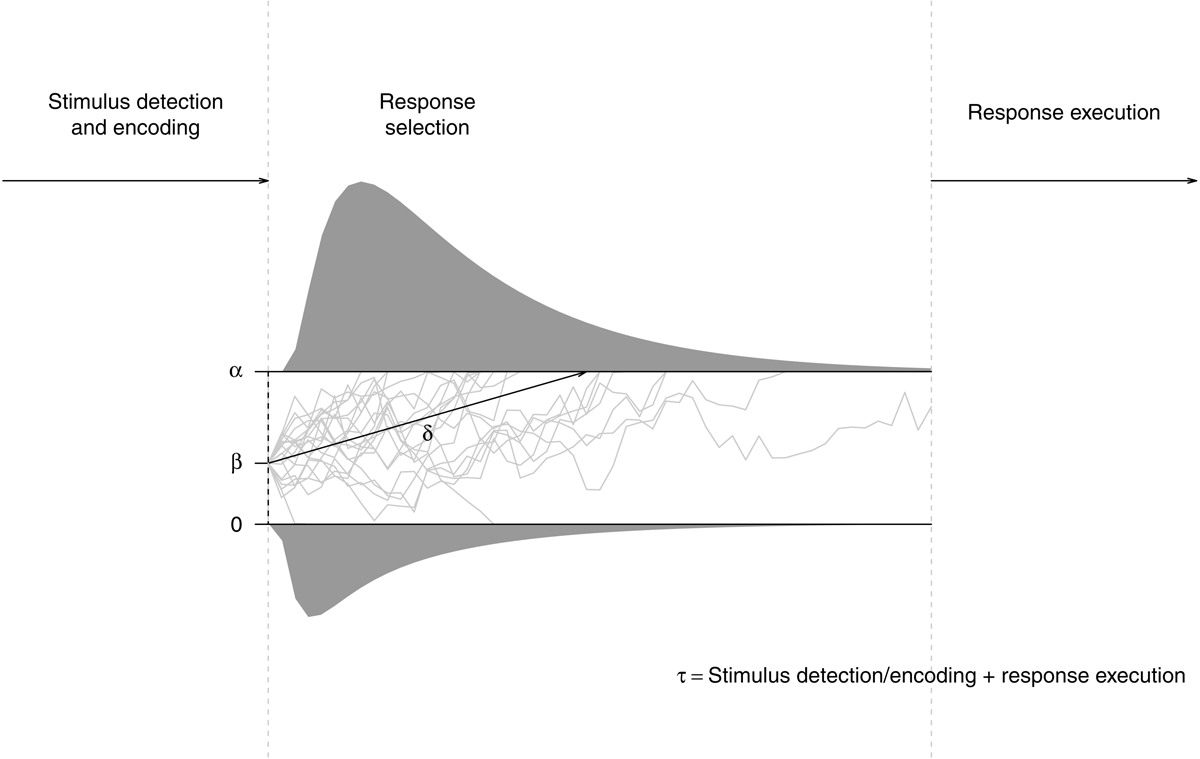
Figure 1
The diffusion model. On each trial, the decision process (depicted as grey lines) begins at a starting point that is determined by parameter β. The spread of the thresholds is determined by parameter α. Evidence is accumulated in a random-walk fashion. When one of the two thresholds is reached, a decision is made. The average rate of evidence accumulation is determined by parameter δ. The decision process is preceded by stimulus encoding and succeeded by response execution, the duration of both processes is captured by nondecision time τ. This basic diffusion model may be extended by response-competition parameter ξ and inter-trial variabilities for the model’s core parameters.
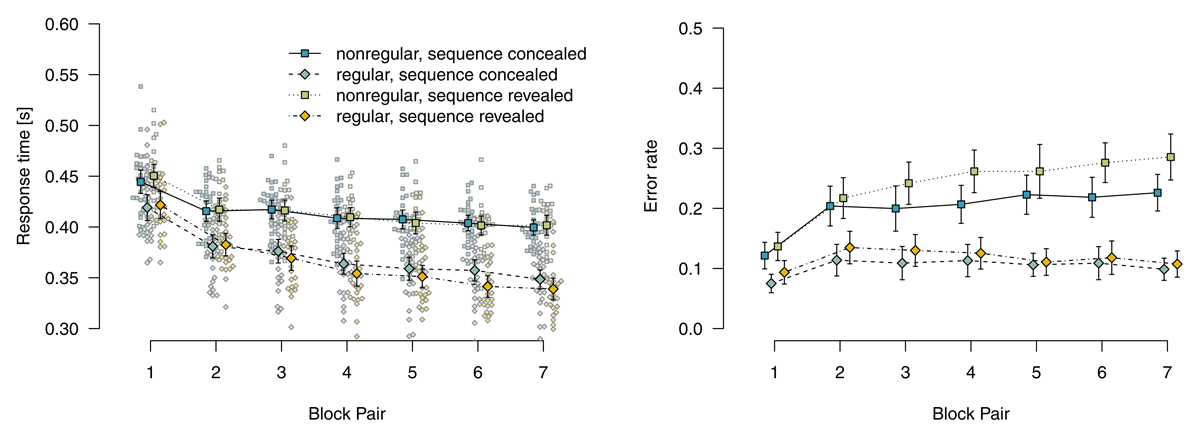
Figure 2
Mean response times for correct responses and error rates in probabilistic materials. Error bars represent 95% (between-subjects) confidence intervals, small points represent individual participants’ means.
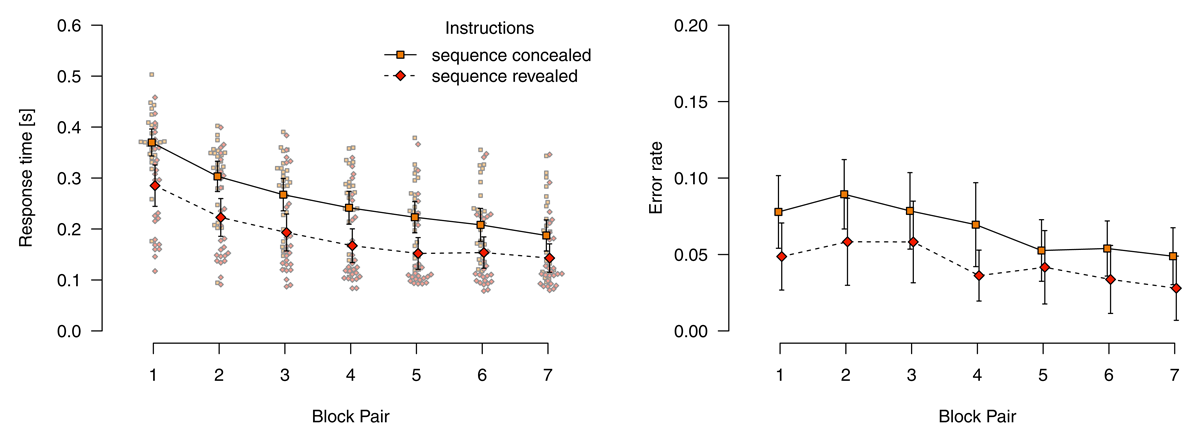
Figure 3
Response times for correct responses and error rates in deterministic blocks. Error bars represent 95% (between-subjects) confidence intervals, small points represent individual participants’ means.
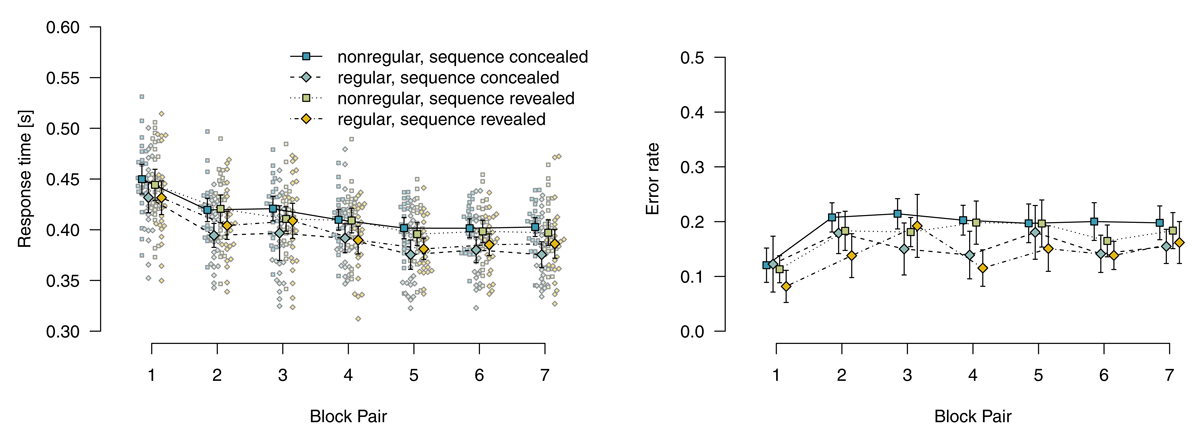
Figure 4
Response times for correct responses and error rates in random blocks. Error bars represent 95% (between-subjects) confidence intervals, small points represent individual participants’ means.
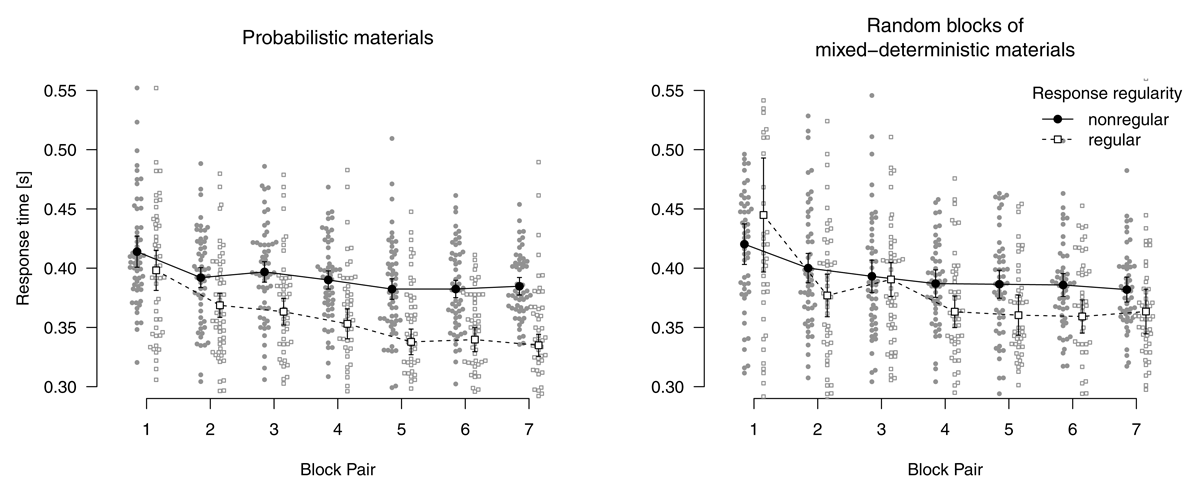
Figure 5
Response times for error responses. Error bars represent 95% within-subjects confidence intervals, small points represent individual participants’ means.
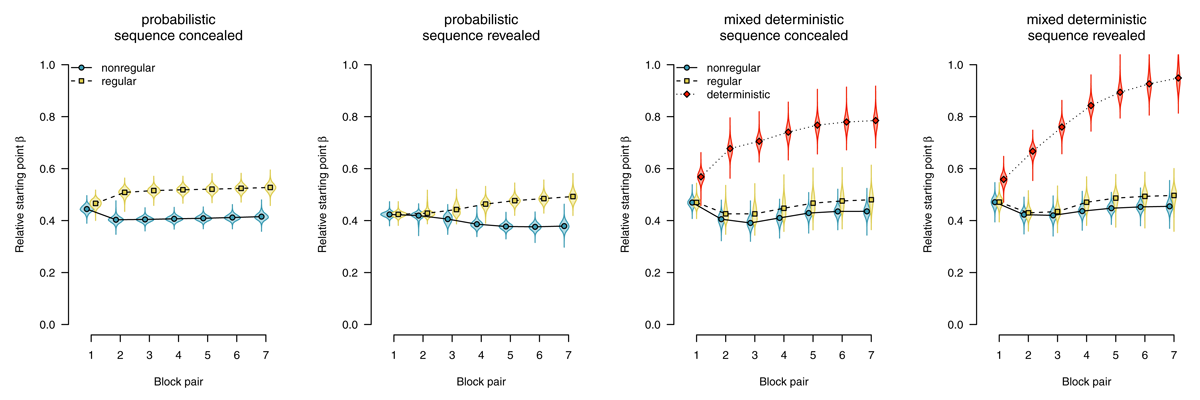
Figure 6
Starting point of the diffusion process. Points represent posterior means of the group-level parameters , violins represent the corresponding posterior densities.
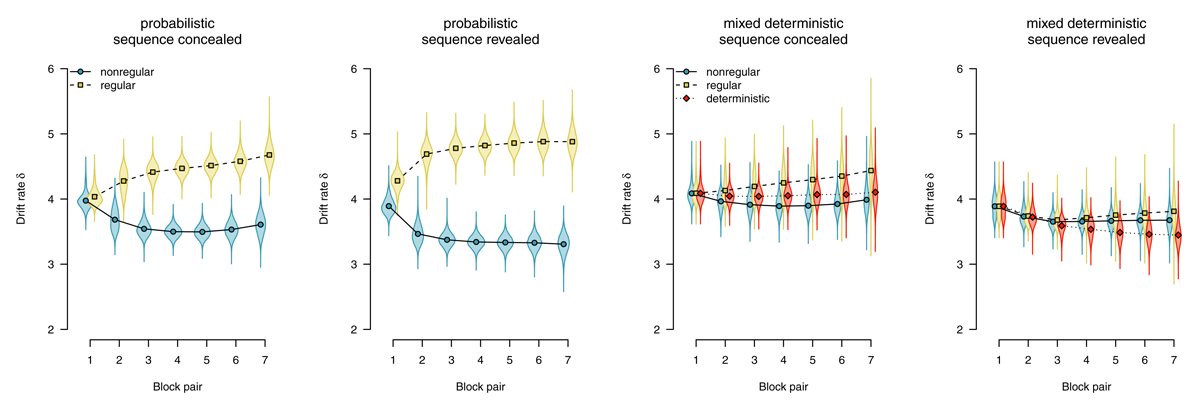
Figure 7
Average evidence accumulation (drift rate). Points represent posterior means of the group-level parameters , violins represent the corresponding posterior densities.
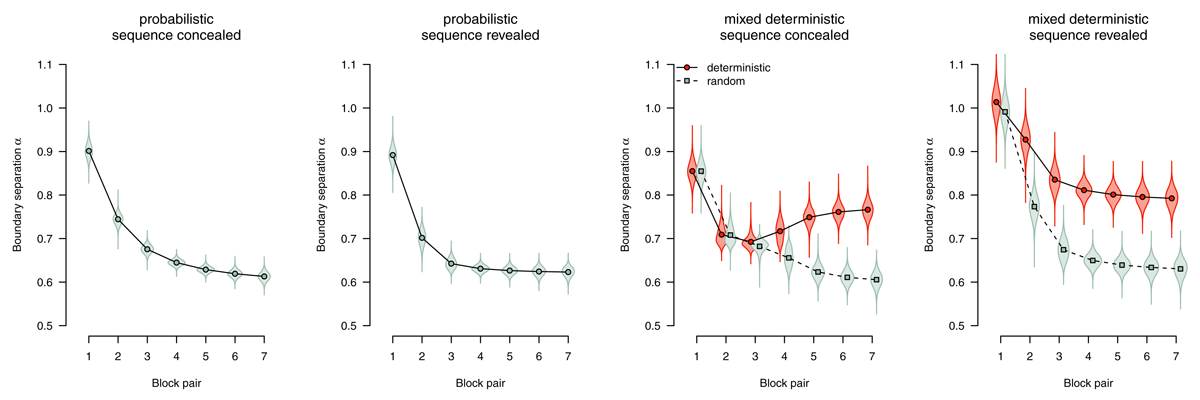
Figure 8
Boundary separation (response caution). Points represent posterior means of the group-level parameters , violins represent the corresponding posterior densities.
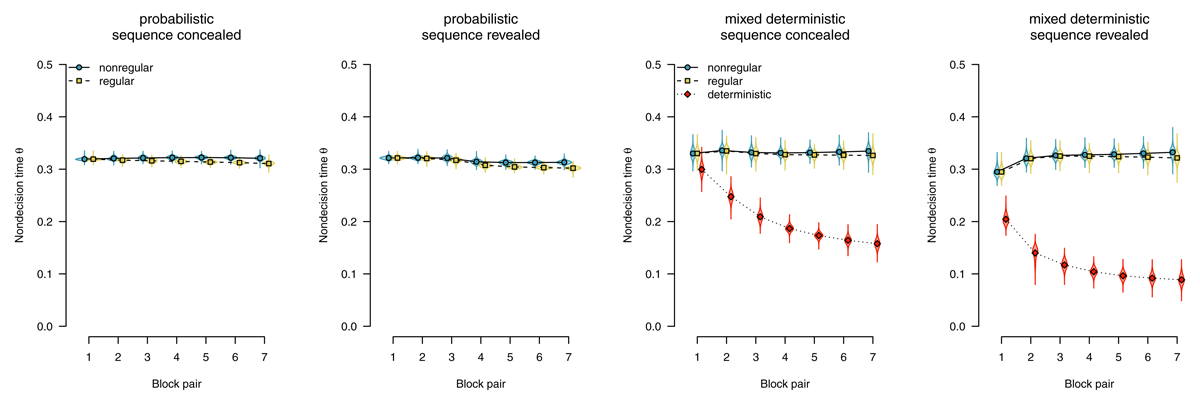
Figure 9
Nondecision times, separated by stimulus-location regularity. Points represent posterior means of the group-level parameters , violins represent the corresponding posterior densities.
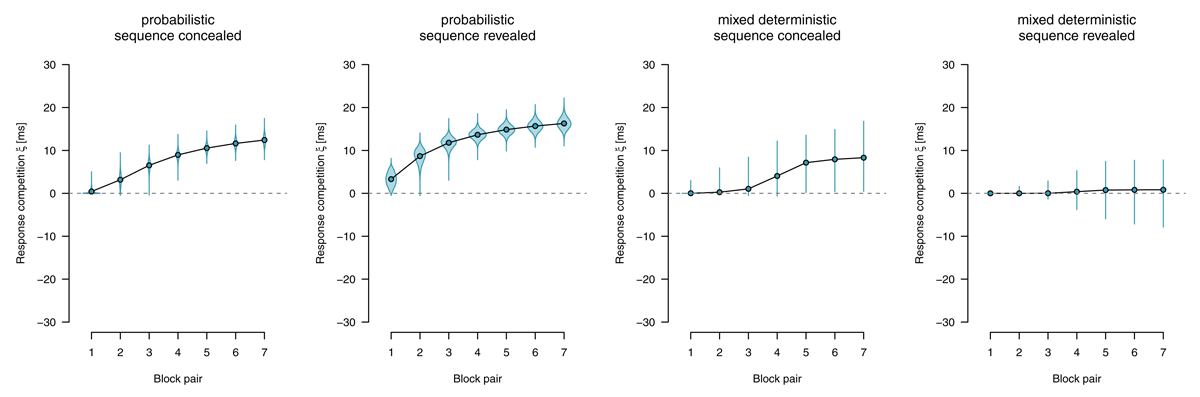
Figure 10
Response-competition parameter ξ, capturing differences in nondecision time between motor-regular and motor-nonregular responses. Positive values imply faster responses for motor-regular responses. Points represent posterior means of the group-level parameters , violins represent the corresponding posterior densities.
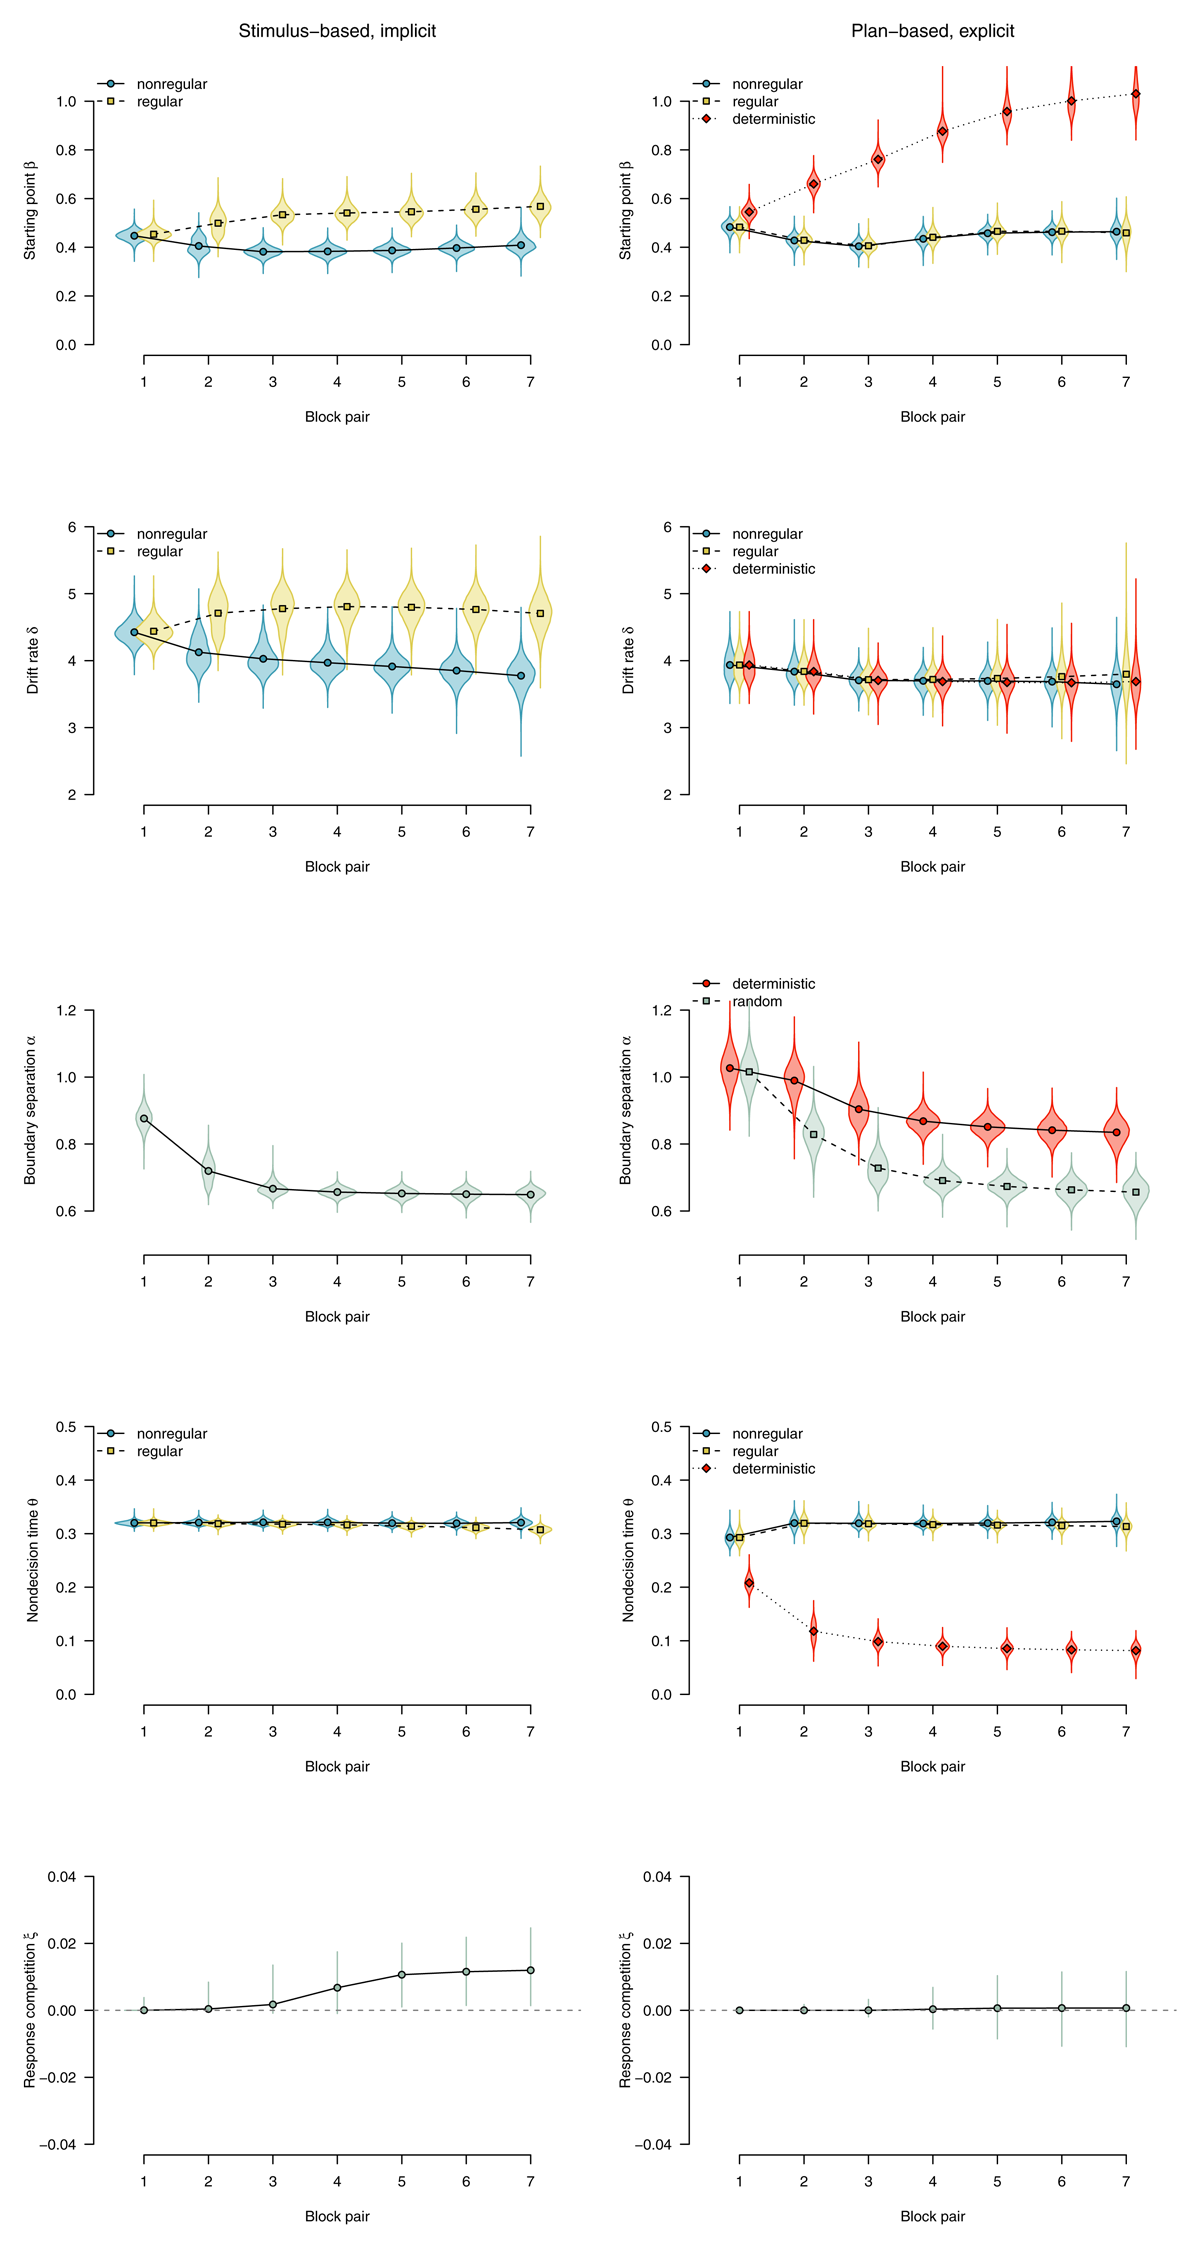
Figure 11
DDM parameters for stimulus-based (on the left) versus plan-based SRTT performance (on the right). Points represent posterior means of the group-level parameters, violins represent the corresponding posterior densities.
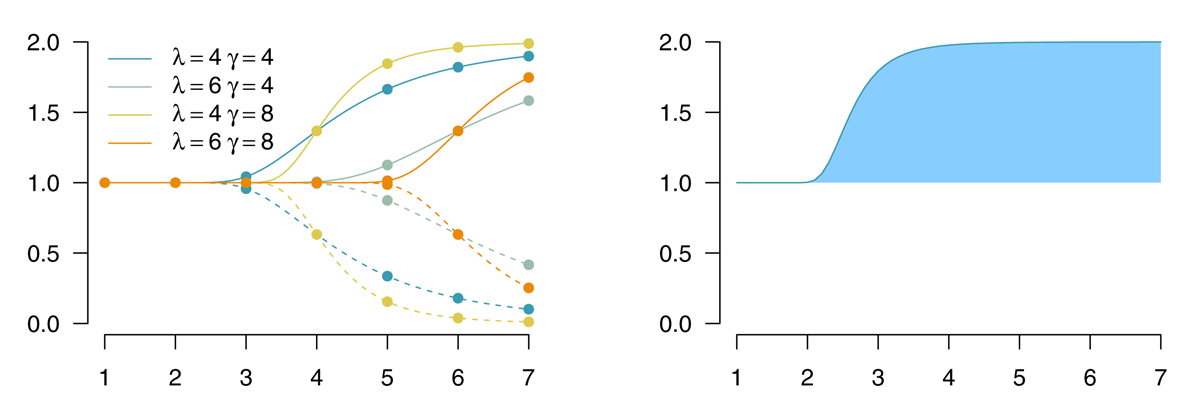
Figure A1
Left panel: Shifted and stretched exponential functions for different values of λ (location) and γ (shape), with υ = 1 and ι ∈ {0,2}. Right panel: The average effect ψ corresponds to the area under the curve (blue) between initial limit and the function’s value f(b).
Table B1
Number of correctly reproduced transitions in free-recall and forced-choice tests. Numbers for only those participants who indicated that they were in a sequenced condition are given in parentheses.
| FREE RECALL | FORCED CHOICE | ||||||
|---|---|---|---|---|---|---|---|
| 0 | 1 | 2 | 3 | 4 | 5 | 6 | |
| probabilistic, sequence concealed | |||||||
| 0 | 8 (1) | 1 (1) | 2 (2) | . | . | . | 1 (0) |
| 1 | 1 (1) | 2 (0) | 2 (2) | 2 (1) | . | . | . |
| 2 | 1 (1) | . | . | . | . | . | . |
| 3 | . | 1 (1) | 1 (1) | . | . | . | . |
| 4 | . | 1 (1) | . | . | . | 1 (1) | . |
| 6 | . | . | . | . | . | 1 (0) | 2 (1) |
| mixed deterministic, sequence concealed | |||||||
| 0 | . | 1 (1) | 1 (0) | 1 (0) | . | . | . |
| 1 | 1 (1) | . | 2 (2) | . | . | . | . |
| 2 | . | 1 (1) | 3 (2) | 1 (1) | . | . | . |
| 3 | . | . | . | . | . | . | . |
| 4 | . | . | . | . | . | . | . |
| 6 | . | . | . | 1 (1) | 1 (1) | 2 (2) | 8 (8) |
| probabilistic, sequence revealed | |||||||
| 0 | 7 (1) | . | 1 (1) | . | . | . | . |
| 1 | . | 2 (2) | 2 (1) | . | 1 (0) | . | . |
| 2 | . | . | . | . | . | . | . |
| 3 | 2 (0) | . | . | 2 (2) | 1 (0) | 1 (1) | . |
| 4 | . | . | 1 (0) | . | . | . | . |
| 6 | . | . | . | 1 (1) | 1 (1) | 1 (0) | 3 (2) |
| mixed deterministic, sequence revealed | |||||||
| 0 | . | 1 (1) | . | . | . | . | . |
| 1 | . | 2 (1) | . | . | . | . | . |
| 2 | . | . | . | . | . | . | . |
| 3 | 1 (1) | 1 (1) | . | . | 1 (1) | . | 1 (1) |
| 4 | . | . | . | . | . | . | 1 (1) |
| 6 | . | . | 1 (1) | . | 2 (2) | . | 15 (15) |