
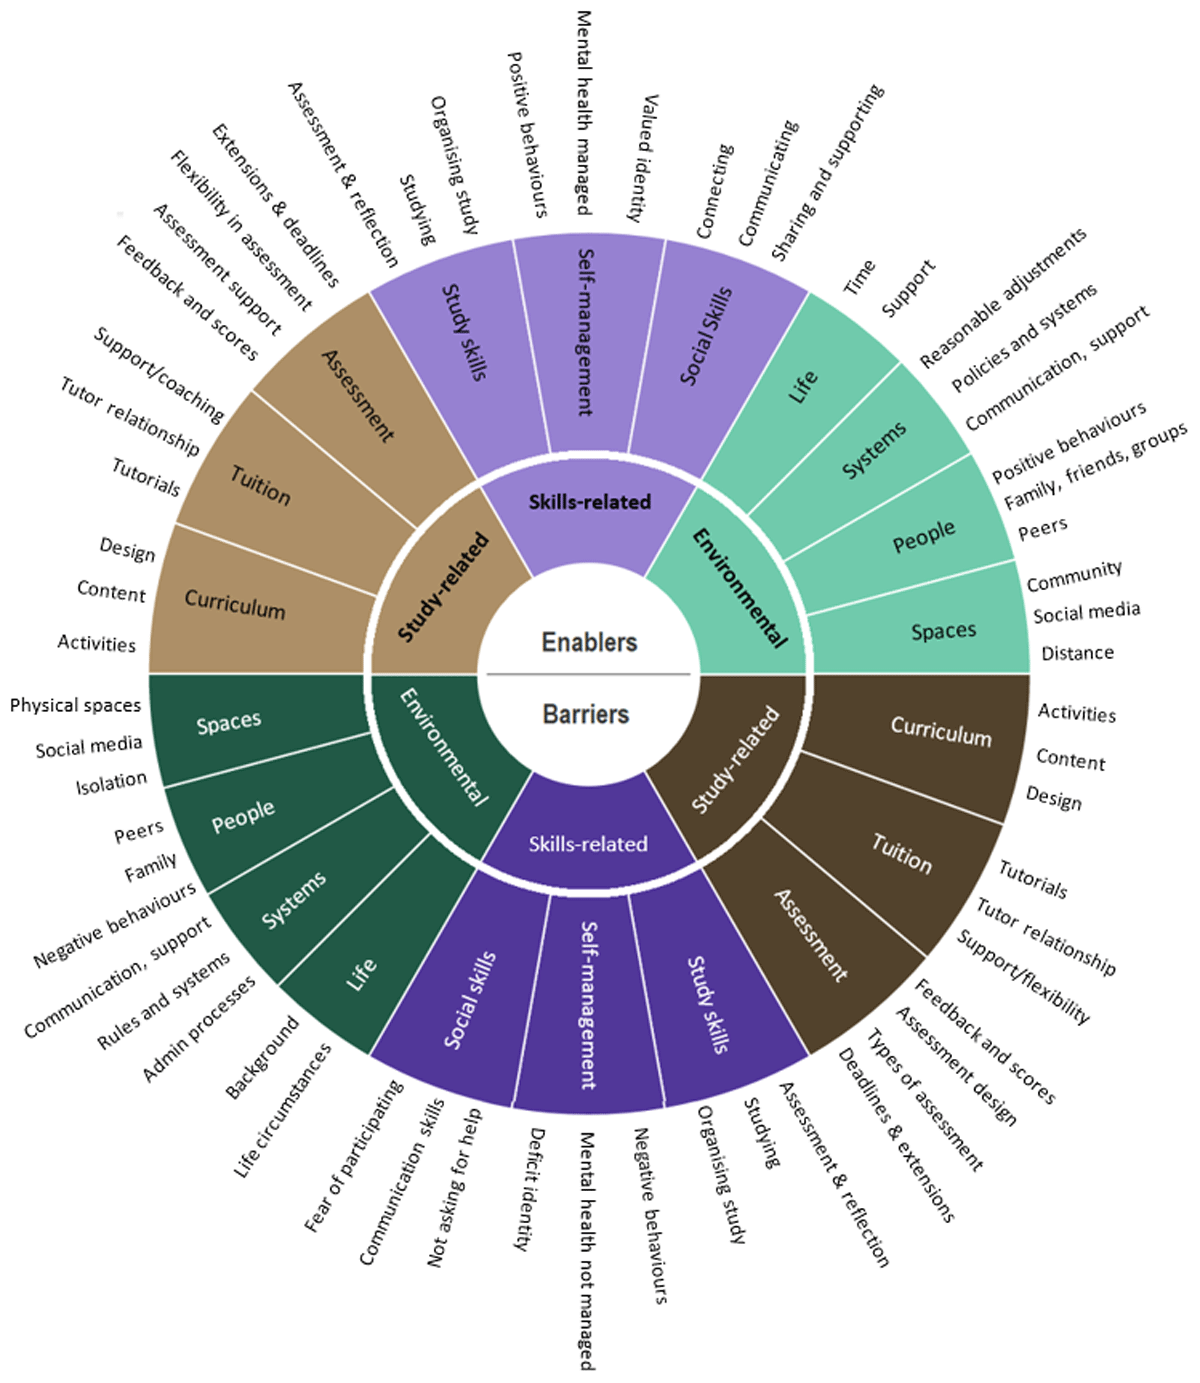
Figure 1
Taxonomy of barriers and enablers to mental wellbeing (Lister, Seale & Douce, 2021).
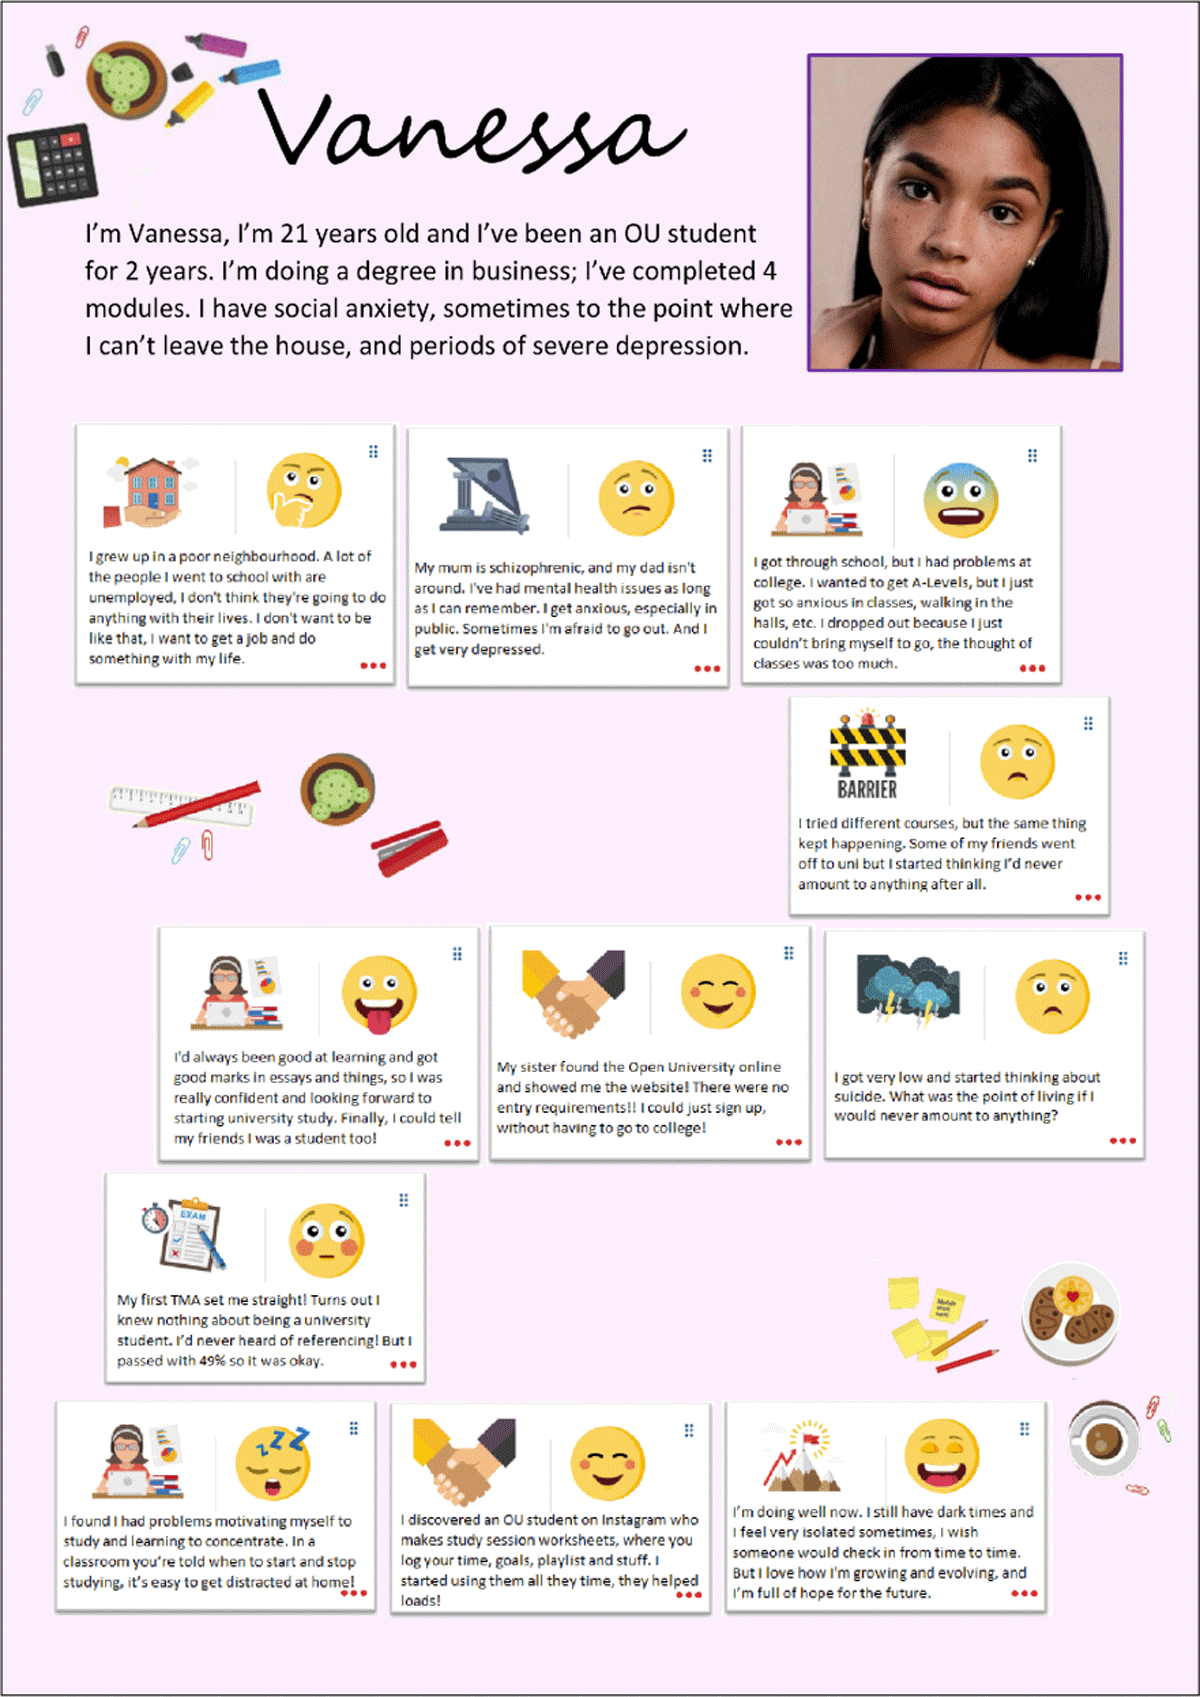
Figure 2
Example of a vignette illustrating challenges in distance learning (Lister & McFarlane, 2021).
Table 1
Student survey respondents’ characteristics.
| PARTICIPANT CHARACTERISTIC | COUNT | % | |
|---|---|---|---|
| Mental health disclosure | No | 244 | 41.7 |
| Yes | 340 | 58.2 | |
| Age | Under 25 | 120 | 20.5 |
| 26–35 | 155 | 26.5 | |
| 36–45 | 115 | 19.7 | |
| 46–55 | 121 | 20.7 | |
| 56 and over | 73 | 12.5 | |
| Gender | Female | 432 | 73.9 |
| Male | 152 | 26.0 | |
| Ethnicity | Asian | 13 | 2.2 |
| Black | 15 | 2.5 | |
| Mixed | 20 | 3.4 | |
| Other/Refused/Unknown | 25 | 4.2 | |
| White | 511 | 87.5 | |
| Disability (other than mental health) | No | 500 | 85.6 |
| Yes | 84 | 14.4 | |
Table 2
Staff survey respondents’ characteristics.
| ROLE | RESPONDENTS | RESPONSE RATE (%) |
|---|---|---|
| Academic/faculty | 196 | 24.5 |
| Tutors | 274 | 34.3 |
| Learning technologists | 54 | 27.0 |
| Student support | 116 | 38.7 |
| Library | 26 | 37.1 |
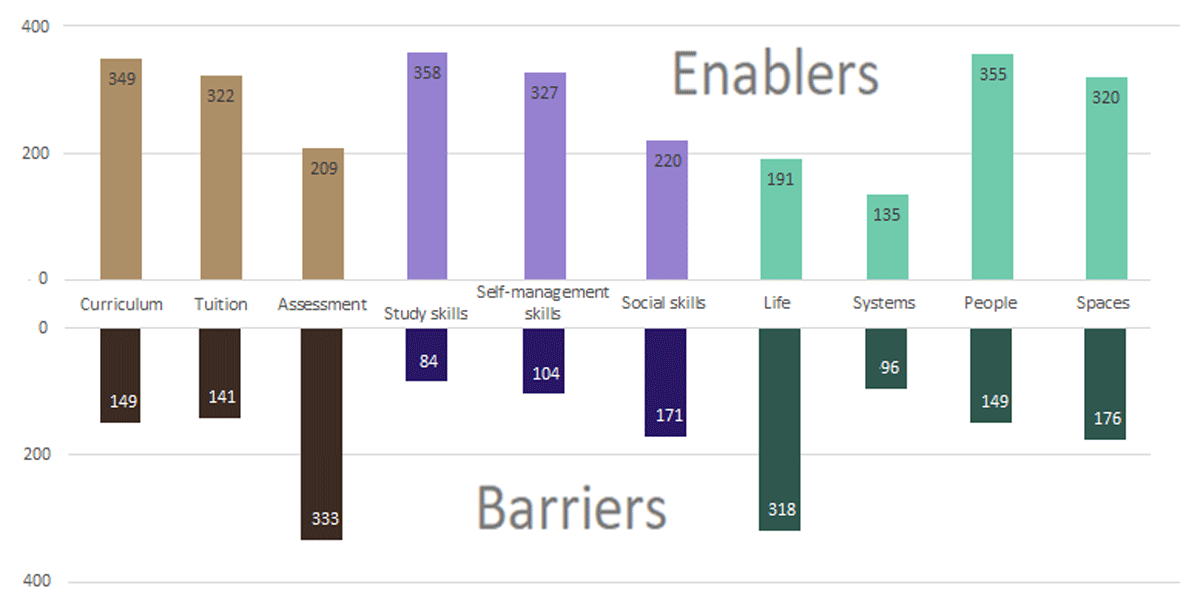
Figure 3
Student perceptions of barriers and enablers to mental wellbeing.
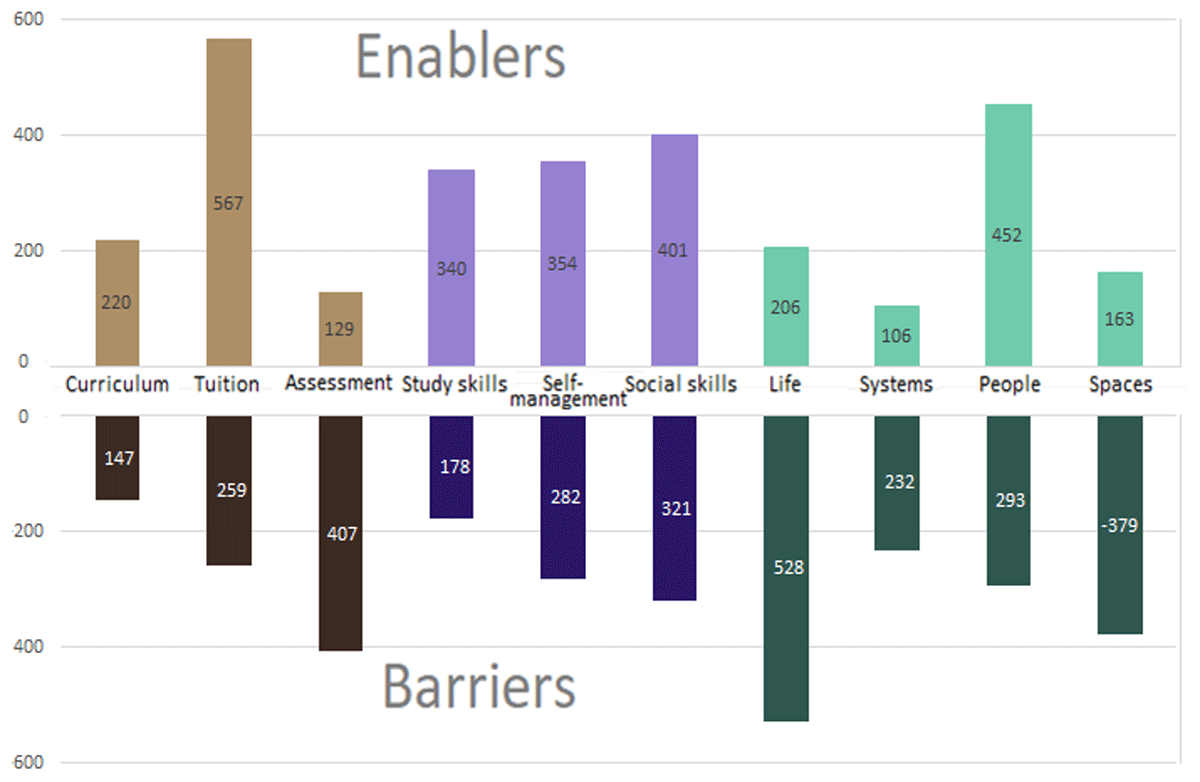
Figure 4
Staff perceptions of barriers and enablers to mental wellbeing.
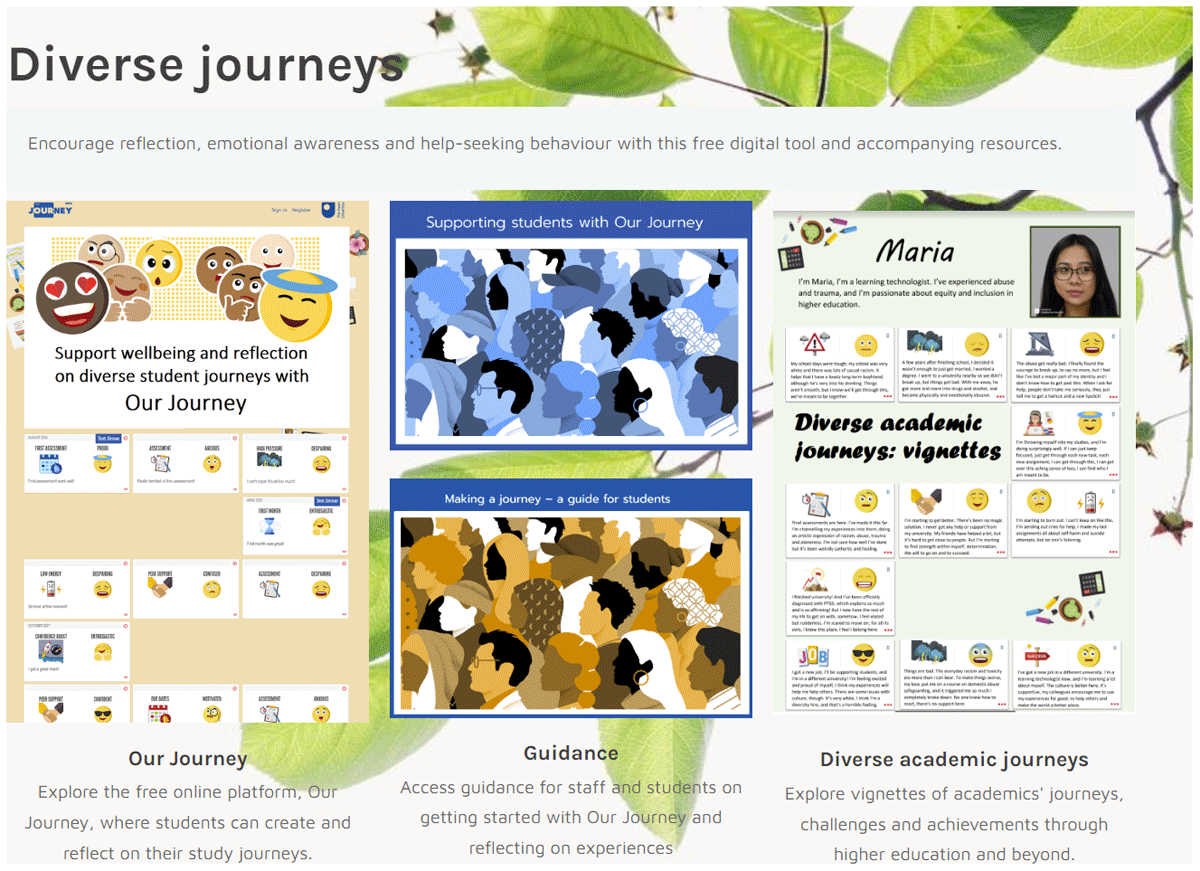
Figure 5
The Diverse Journey resource area.
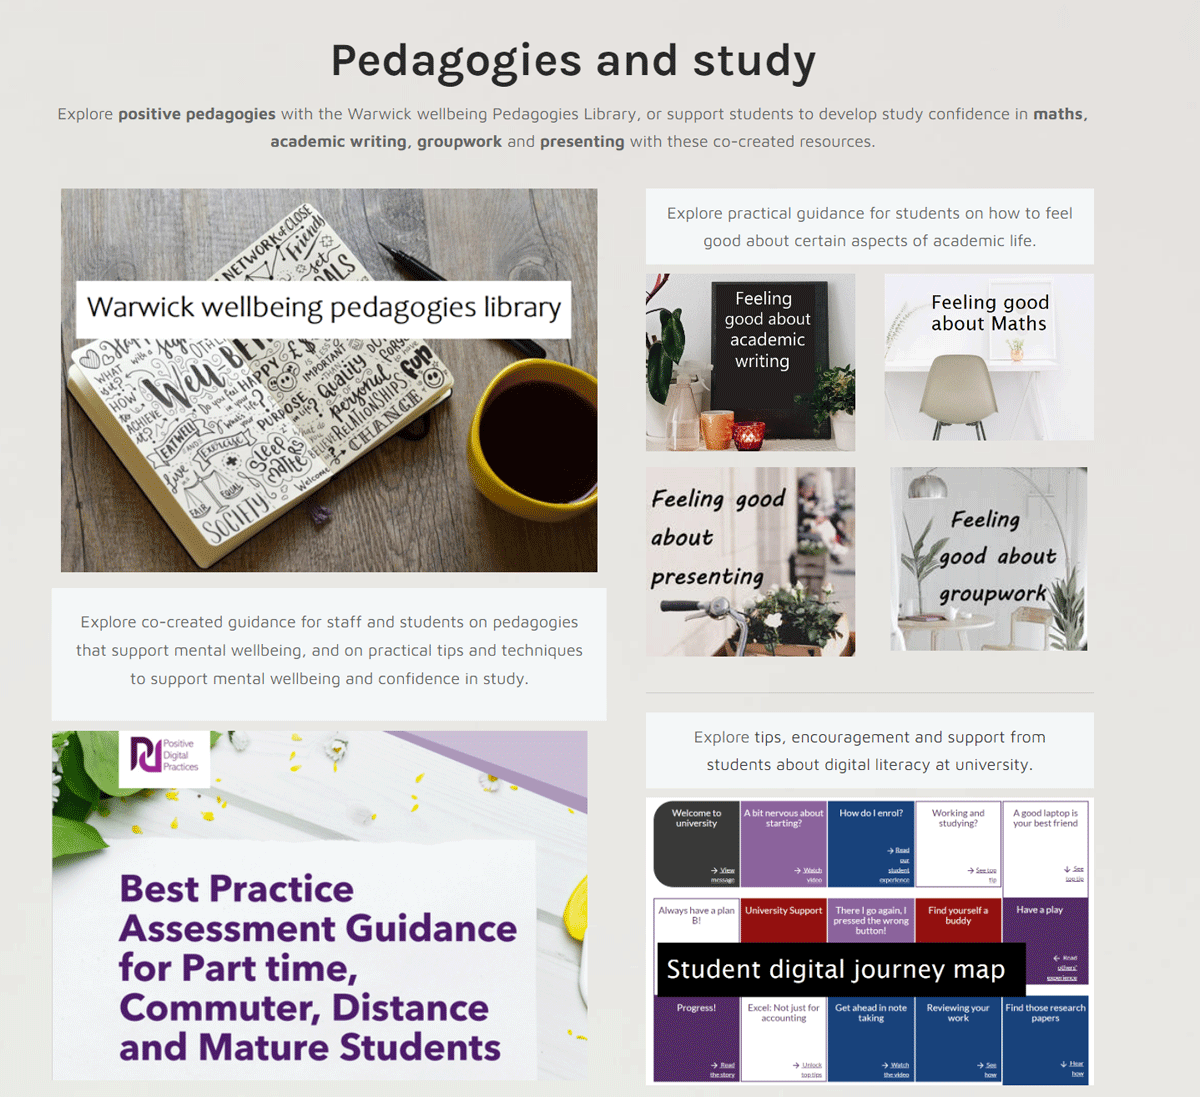
Figure 6
The Pedagogies and Study Hub.
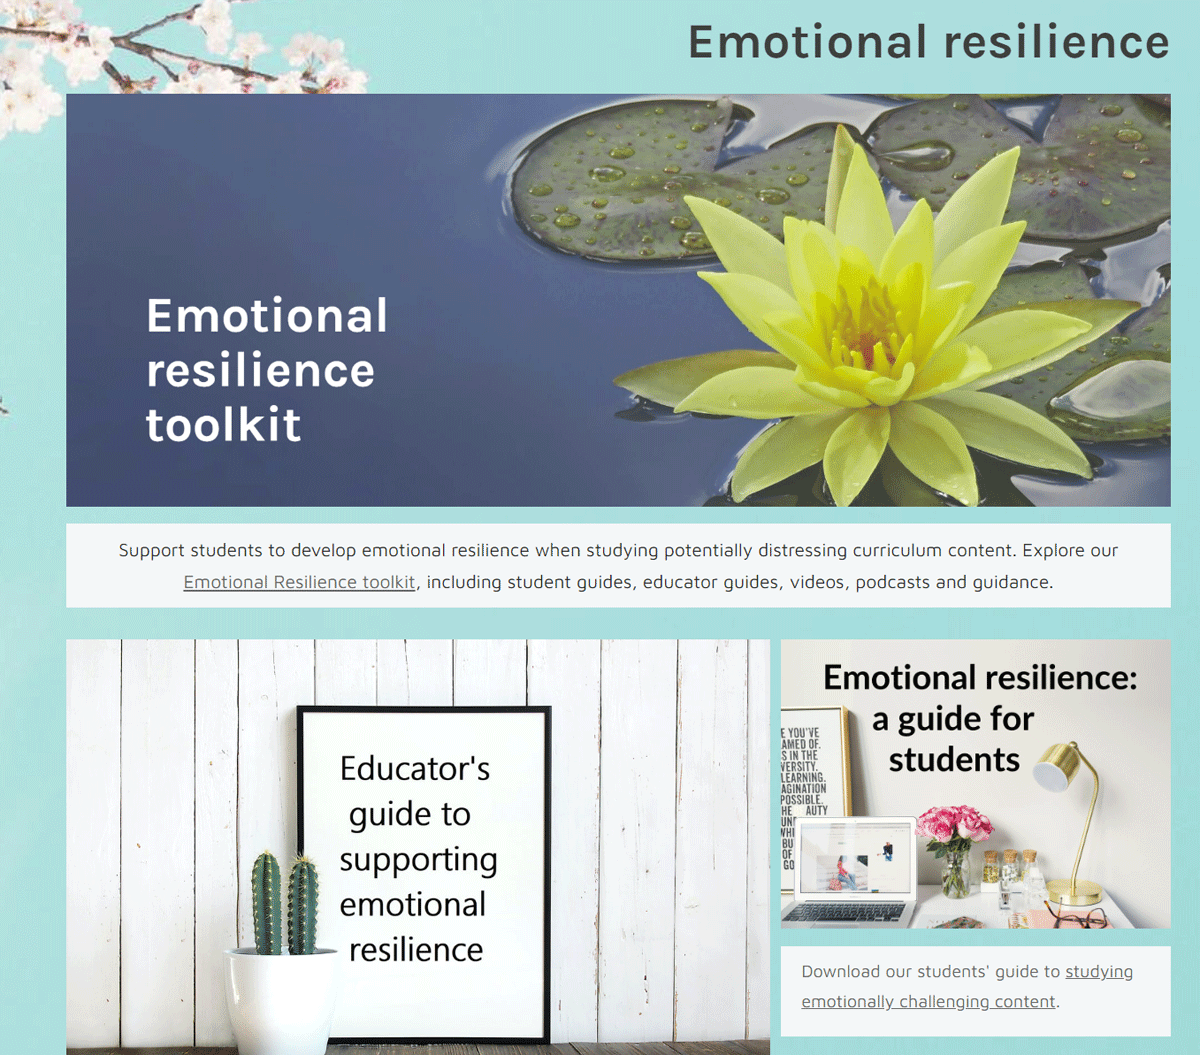
Figure 7
The Emotional Resilience Toolkit.
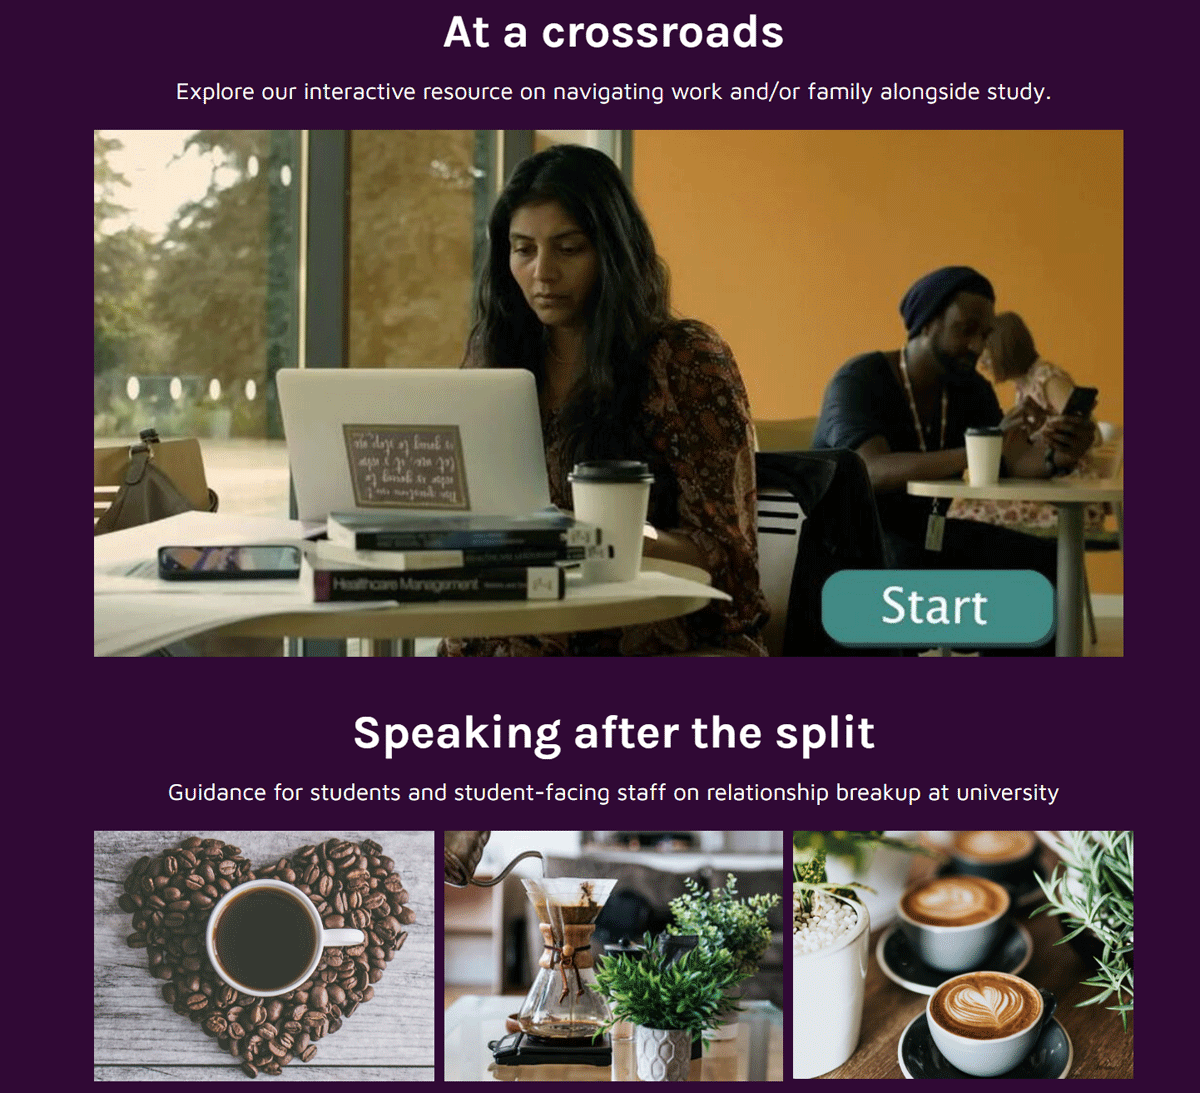
Figure 8
The Tough Times interactive resource area.