
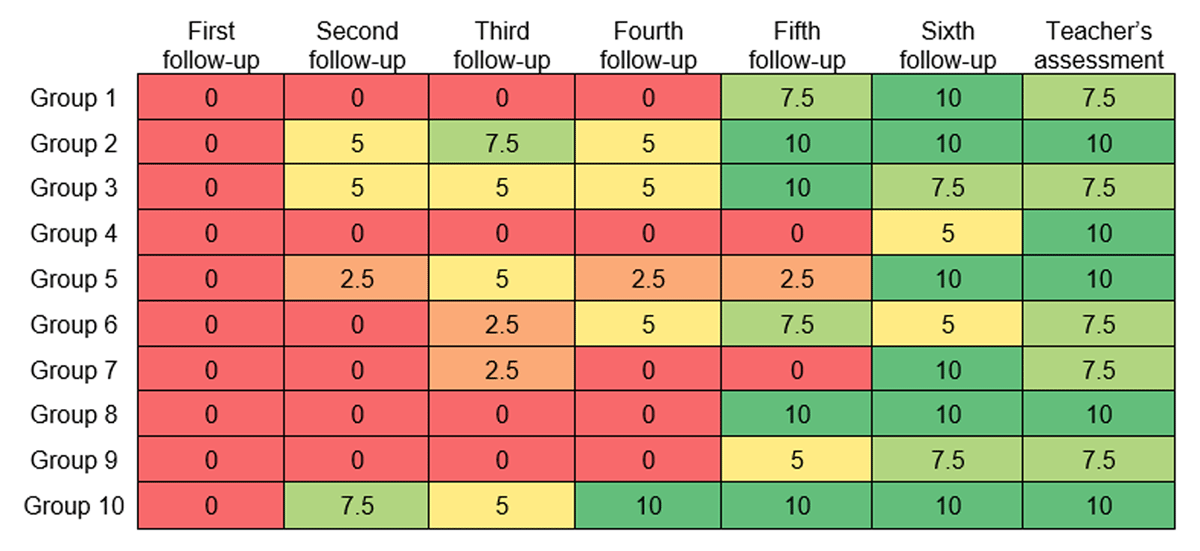
Figure 1
Students’ self-assessments in the weekly follow-ups, and final teacher’s assessments for the criterion “Introduction”. Note: Colours are incorporated to facilitate the visualisation of the progression from red for the lowest score (0) to green for the highest score (10).
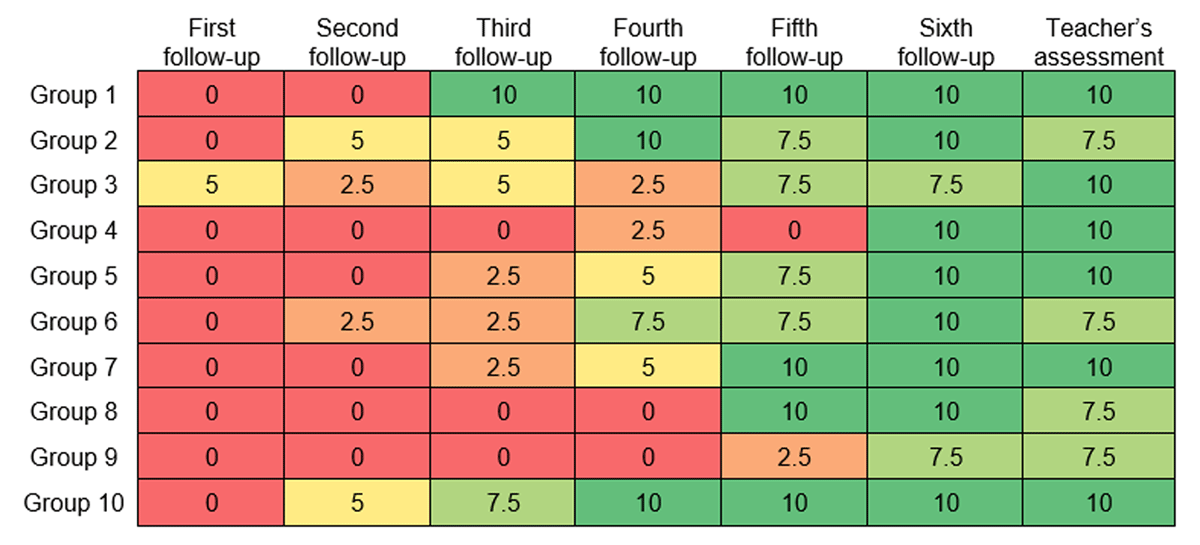
Figure 2
Students’ self-assessments in the weekly follow-ups, and final teacher’s assessments for the criterion “Organisation and content”.
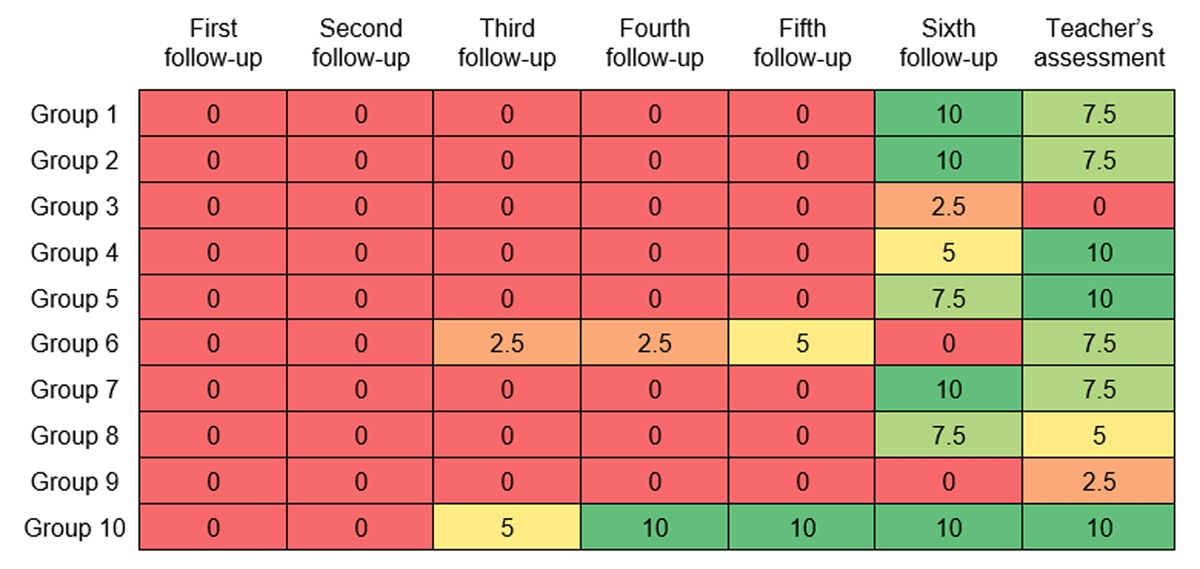
Figure 3
Students’ self-assessments in the weekly follow-ups, and final teacher’s assessments for the criterion “Conclusion”.
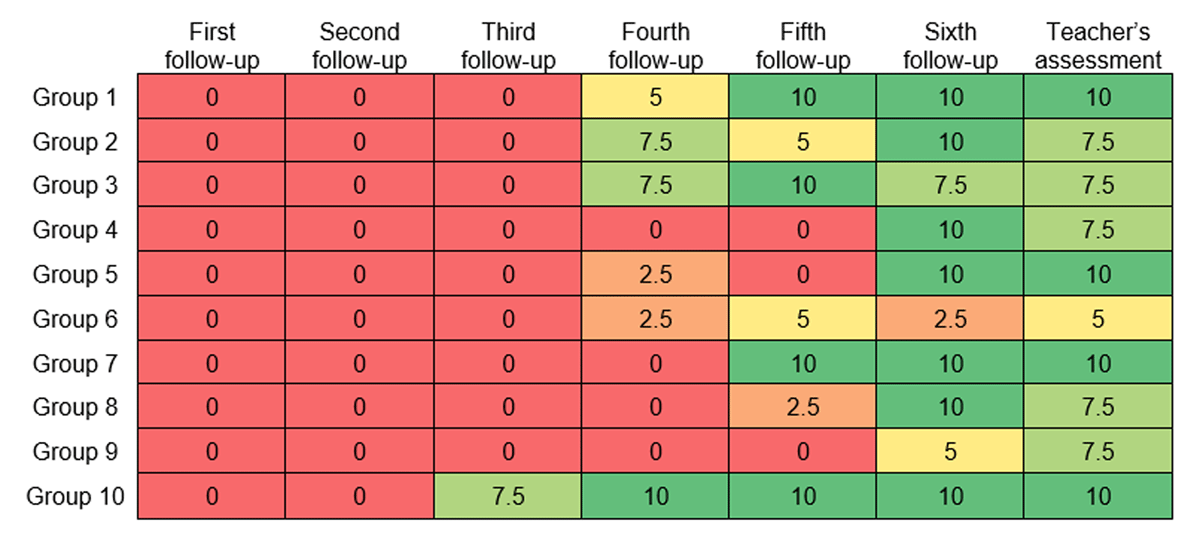
Figure 4
Students’ self-assessments in the weekly follow-ups, and final teacher’s assessments for the criterion “Personal reflection throughout the assignment and the final reflection”.
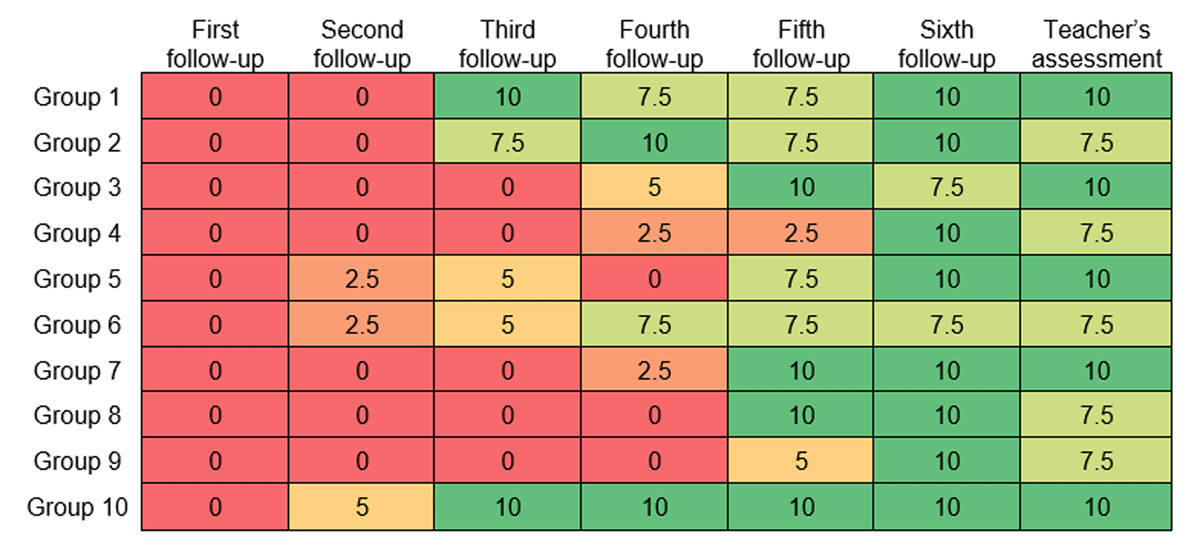
Figure 5
Students’ self-assessments in the weekly follow-ups, and final teacher’s assessments for the criterion “Quality of information.”
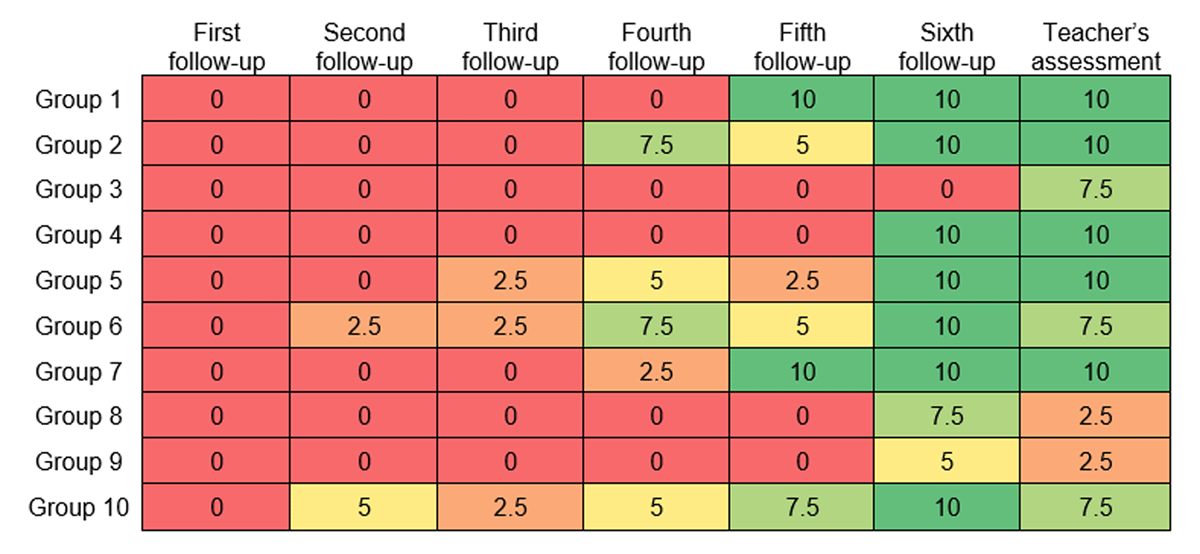
Figure 6
Students’ self-assessments in the weekly follow-ups, and final teacher’s assessments for the criterion “Figures and tables”.
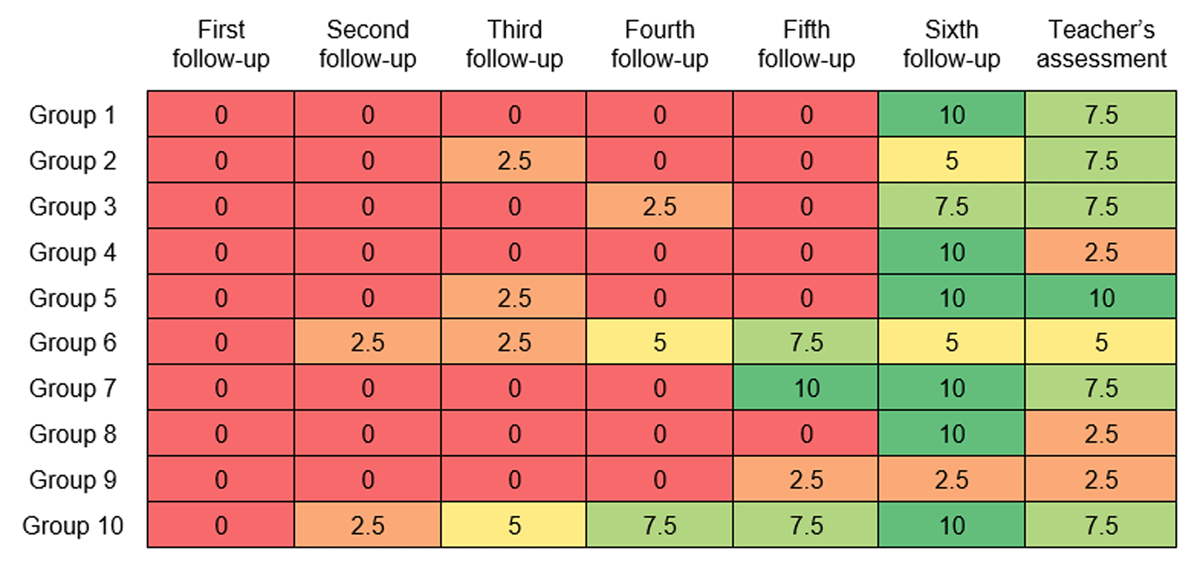
Figure 7
Students’ self-assessments in the weekly follow-ups, and final teacher’s assessments for the criterion “References.”
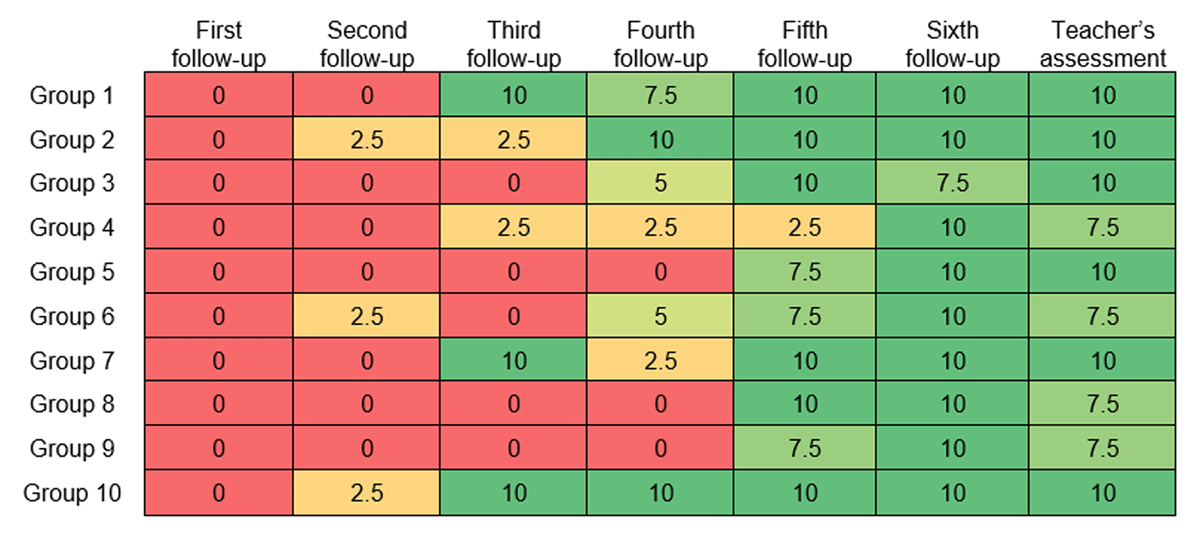
Figure 8
Students’ self-assessments in the weekly follow-ups, and final teacher’s assessment in the criterion “Format”.
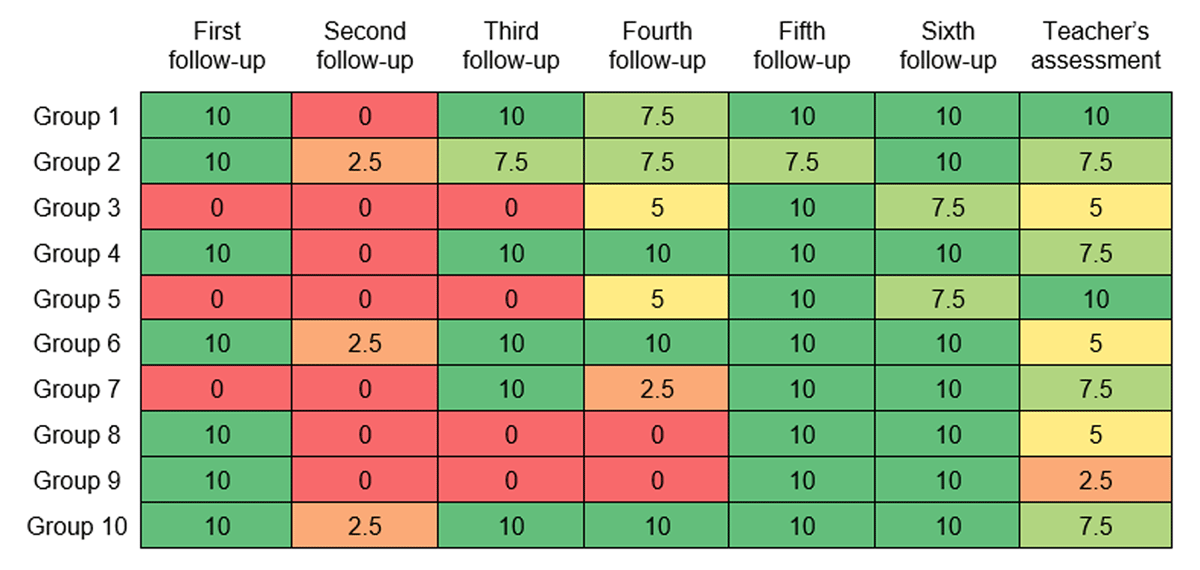
Figure 9
Students’ self-assessments in weekly follow-ups, and final teacher’s assessments for the criterion “Writing”.
Table 1
The total score of each group according to its self-assessment in each weekly follow-up, its final teacher’s assessment, and the difference between the two assessments.
| GROUP 1 | GROUP 2 | GROUP 3 | GROUP 4 | GROUP 5 | GROUP 6 | GROUP 7 | GROUP 8 | GROUP 9 | GROUP 10 | |
|---|---|---|---|---|---|---|---|---|---|---|
| First follow-up | 1.11 | 1.11 | 0.56 | 1.11 | 0 | 1.11 | 0 | 1.11 | 1.11 | 1.11 |
| Second follow-up | 0 | 1.67 | 0.83 | 0 | 0.56 | 1.67 | 0 | 0 | 0 | 3.33 |
| Third follow-up | 4.44 | 3.61 | 1.11 | 1.39 | 1.94 | 3.06 | 2.78 | 0 | 0 | 6.94 |
| Fourth follow-up | 4.17 | 6.39 | 3.61 | 1.94 | 2.22 | 5.83 | 1.67 | 0 | 0 | 9.17 |
| Fifth follow-up | 7.22 | 5.83 | 6.39 | 1.67 | 4.17 | 6.94 | 7.78 | 5.83 | 3.61 | 9.44 |
| Sixth follow-up | 10 | 9.44 | 6.11 | 8.89 | 9.44 | 6.67 | 10 | 9.44 | 6.39 | 10 |
| Teacher’s assessment | 9.17 | 8.33 | 7.22 | 8.06 | 10 | 6.67 | 8.89 | 6.11 | 5.28 | 9.17 |
| Differences | –0.83 | –1.11 | +1.11 | –0.83 | +0.56 | 0.00 | –1.11 | –3.33 | –1.11 | –0.83 |
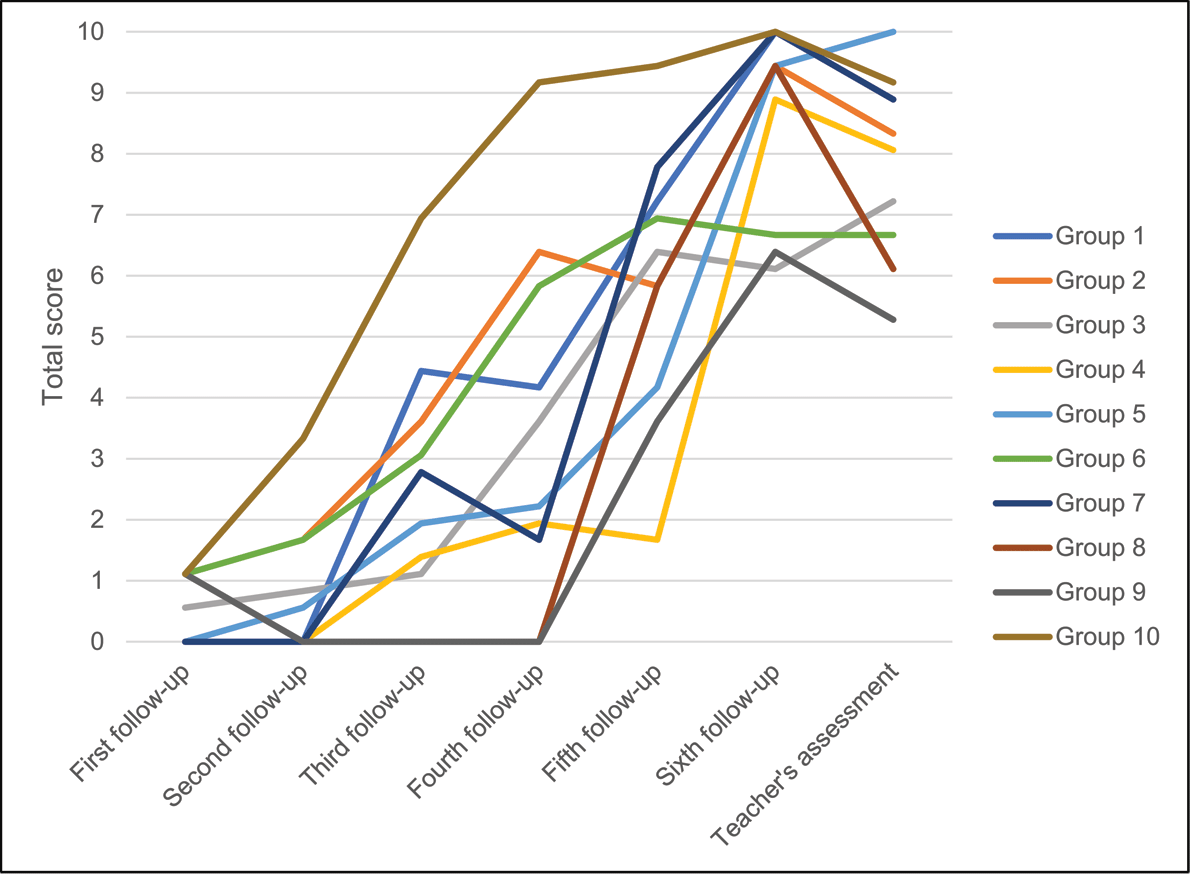
Figure 10
Graphical representation of the total scores of all the groups according to their self-assessments in each weekly follow-up and the final teacher’s assessment.
Table 2
Descriptive statistics of the items related to the students’ perception of the digital follow-up questionnaire.
| N | MIN. | MAX. | MEAN | STANDARD DEVIATION | ASYMMETRY | KURTOSIS | |||
|---|---|---|---|---|---|---|---|---|---|
| STAT. | STANDARD ERROR | STAT. | STANDARD ERROR | ||||||
| Item 1 | 30 | 3.00 | 5.00 | 4.47 | 0.57 | –0.456 | 0.427 | –0.748 | 0.833 |
| Item 2 | 30 | 3.00 | 5.00 | 4.33 | 0.71 | –0.594 | 0.427 | –0.758 | 0.833 |
| Item 3 | 30 | 2.00 | 5.00 | 4.33 | 0.84 | –1.092 | 0.427 | 0.468 | 0.833 |
| Item 4 | 30 | 3.00 | 5.00 | 4.13 | 0.78 | –0.242 | 0.427 | –1.261 | 0.833 |
| Item 5 | 30 | 3.00 | 5.00 | 4.20 | 0.66 | –0.242 | 0.427 | –0.634 | 0.833 |