
Table 1
Sample of the survey (university faculties).
| UNIVERSITY FACULTIES (BACHELOR & MASTER) | n | % |
|---|---|---|
| Faculty of Architecture | 176 | 11.9 |
| Faculty of Computer Science | 389 | 26.4 |
| Faculty of Engineering | 335 | 22.7 |
| Faculty of Social Sciences | 315 | 21.4 |
| Faculty of Business Studies | 260 | 17.6 |
| Total | 1,475 | 100.0 |
Table 2
Sample of the survey (Semester).
| SEMESTER OF STUDIES | n | % |
|---|---|---|
| 1st semester | 155 | 10.5 |
| 2nd semester | 305 | 20.7 |
| 3rd semester | 173 | 11.7 |
| 4th semester | 254 | 17.2 |
| 5th semester | 143 | 9.7 |
| 6th semester | 167 | 11.3 |
| 7th semester | 74 | 5 |
| 8th semester | 43 | 2.9 |
| 9th semester | 26 | 1.8 |
| 10th semester | 18 | 1.2 |
| 11th semester | 7 | 0.5 |
| 12th semester | 19 | 1.3 |
| Semester on leave | 1 | 0.1 |
| Start of studies only in WS2020/2021 | 90 | 6.1 |
| Total | 1,475 | 100 |
Table 3
Pearson correlation between individual barriers.
| BARRIERS | M | SD | (1) | (2) | (3) | (4) | (5) | (6) | (7) |
|---|---|---|---|---|---|---|---|---|---|
| (1) No workplace | 3.7 | 1.4 | . | ||||||
| (2) No technical equipment | 4.3 | 1.2 | .409** | . | |||||
| (3) Internet stability problems | 3.8 | 1.3 | .385** | .424** | . | ||||
| (4) Care for family members | 3.3 | 1.5 | .156** | .138** | .096** | . | |||
| (5) Stressed financial situation | 2.5 | 1.5 | .228** | .247** | .247** | .292** | . | ||
| (6) Purchase of technical equipment | N.A. | N.A. | –.137** | -.176** | –.187** | –.101** | .272** | . | |
| (7) Compatibility of study/work & family | N.A. | N.A. | –.261** | –.153** | –.145** | –.161** | –.246** | .172** | . |
[i] Five-point response scale from 1 = “strongly agree” to 5 = “strongly disagree”.
* The correlation is significant at the .05 level (2-sided).
** The correlation is significant at the .01 level (2-sided).
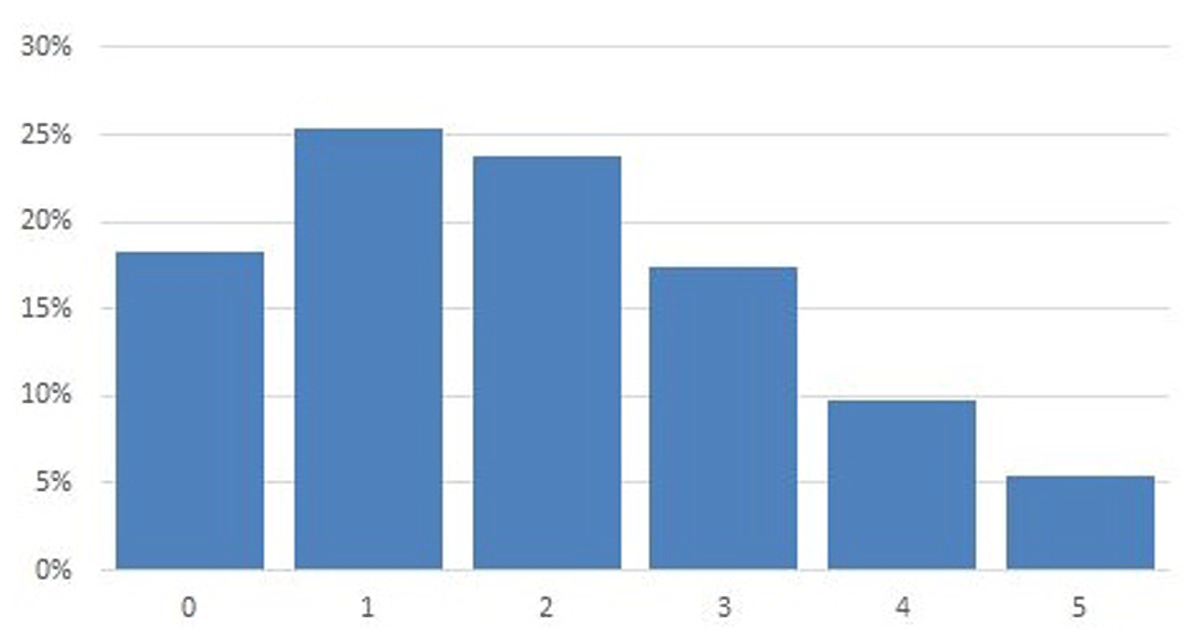
Figure 1
Number of barriers per student in %.