
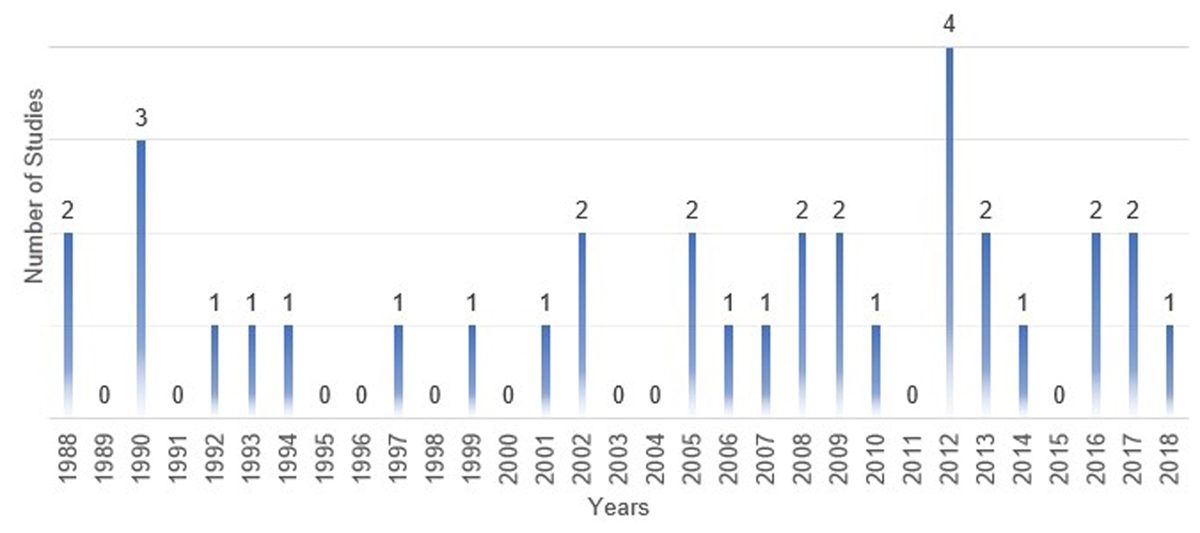
Figure 1
Time series graph (1988–2018).
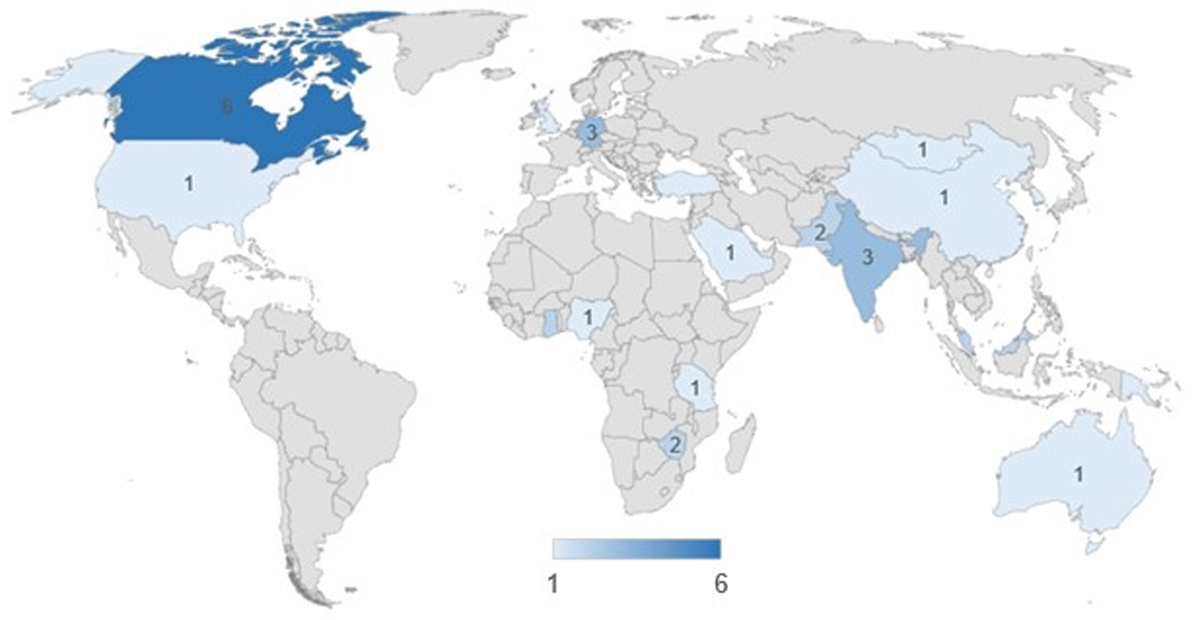
Figure 2
Geographical distribution of study contexts, where applicable (also see Appendix A).
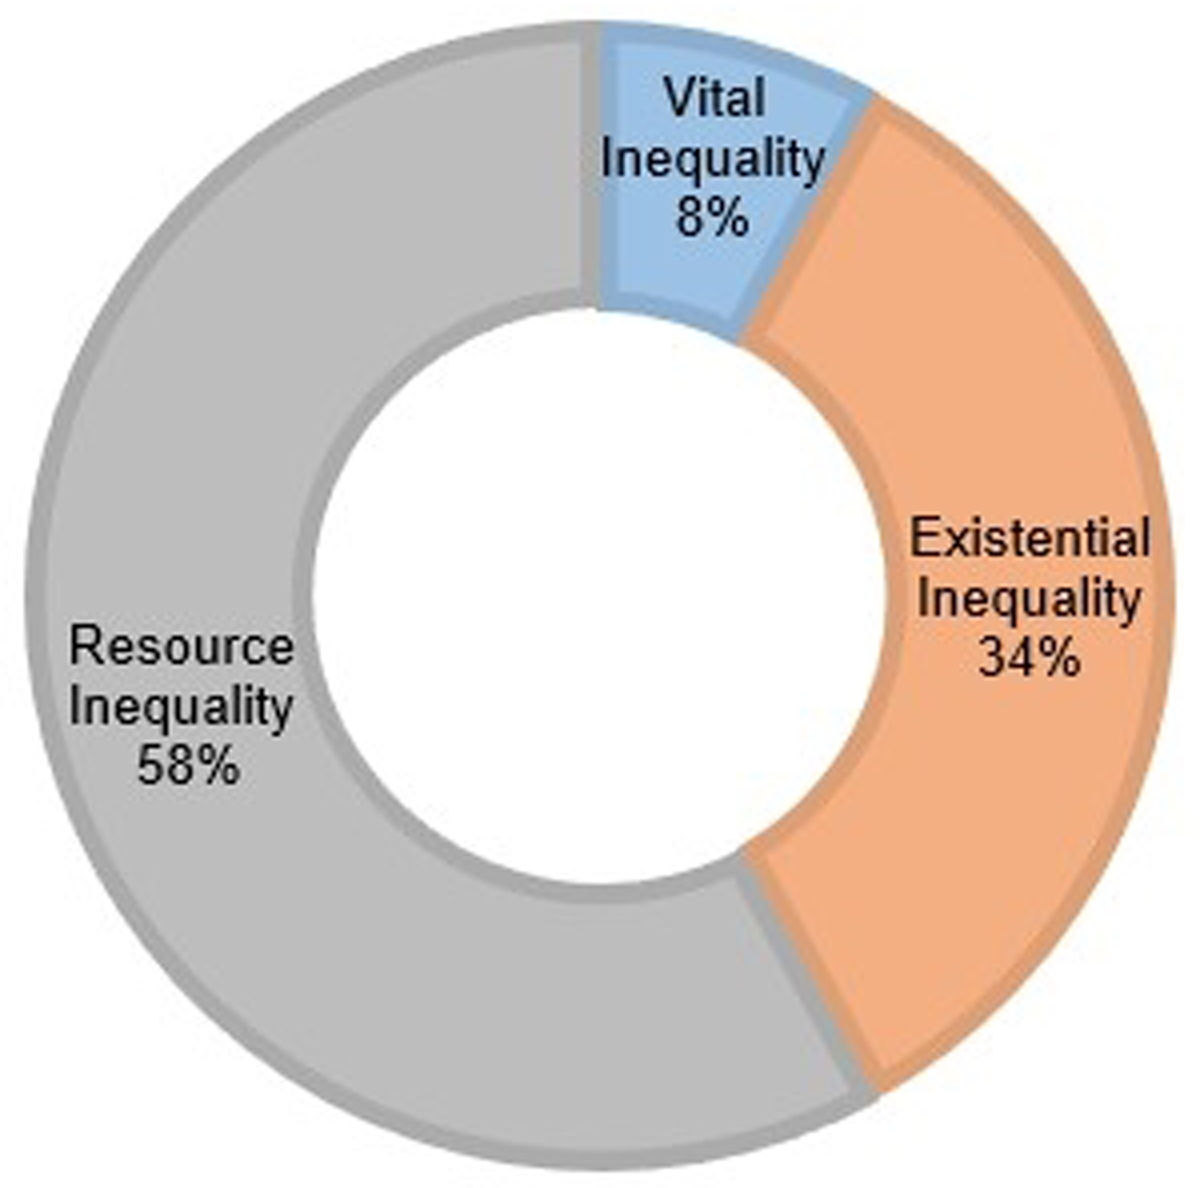
Figure 3
An overview of the types of inequality addressed in the studies: Vital Inequality (8%), Existential Inequality (34%), Resource Inequality (58%).
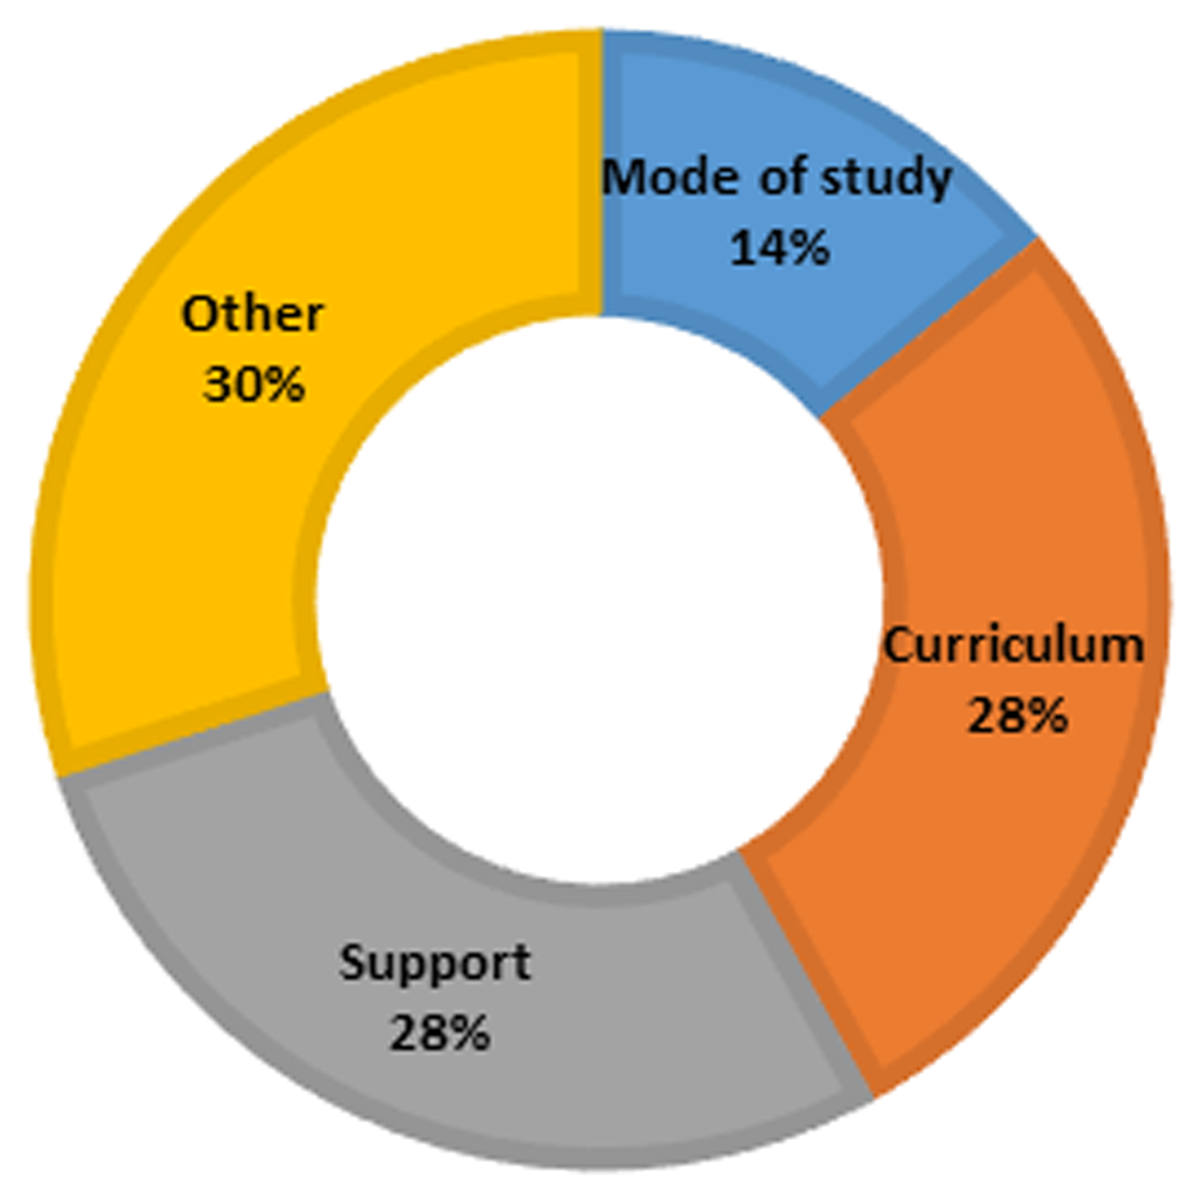
Figure 4
The distribution of educational implications: Mode of study (14%), Curriculum (28%), Support (2%8), Other (30%).
Table 1
Designing for Empowerment and Agency: Some Implications on Curriculum Design.
|
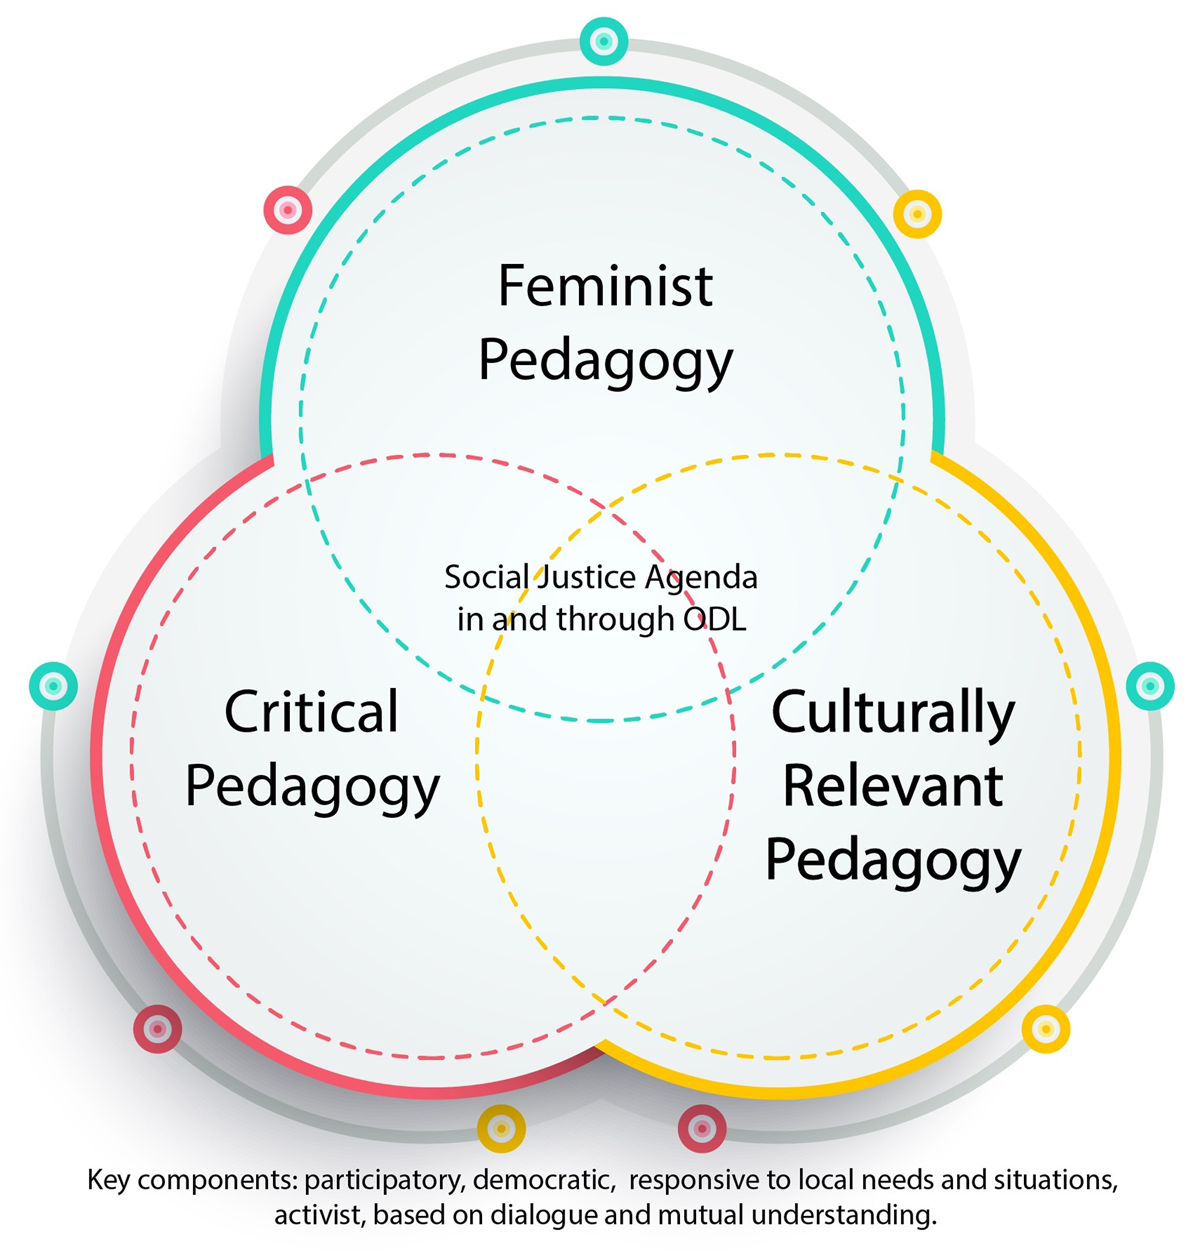
Figure 5
Proposed model for addressing gender inequality in ODL.