
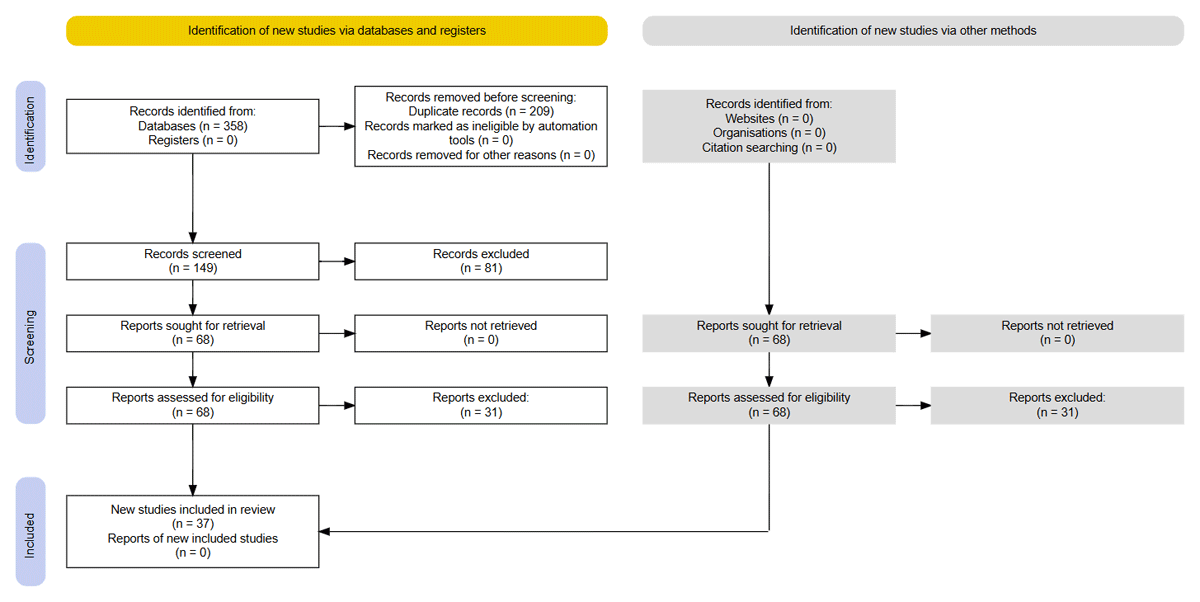
Figure 1
PRISMA methodology (Page et al., 2021).
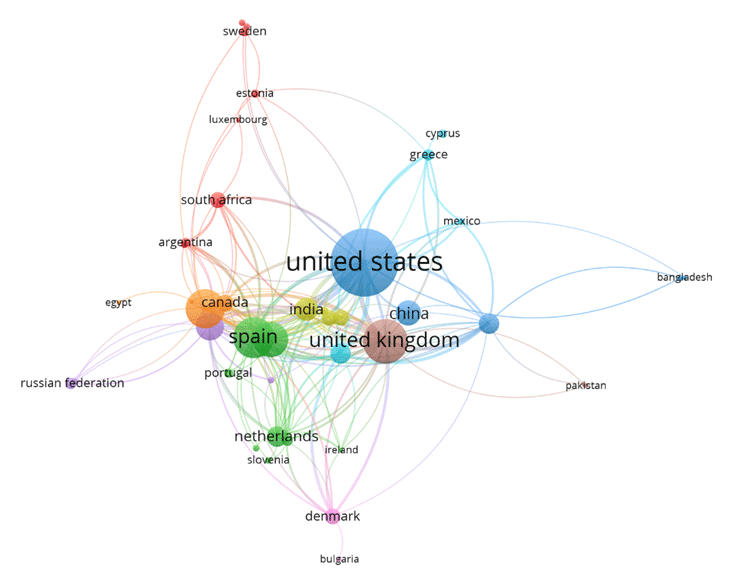
Figure 2
Co-authorship network graph (VOSviewer).
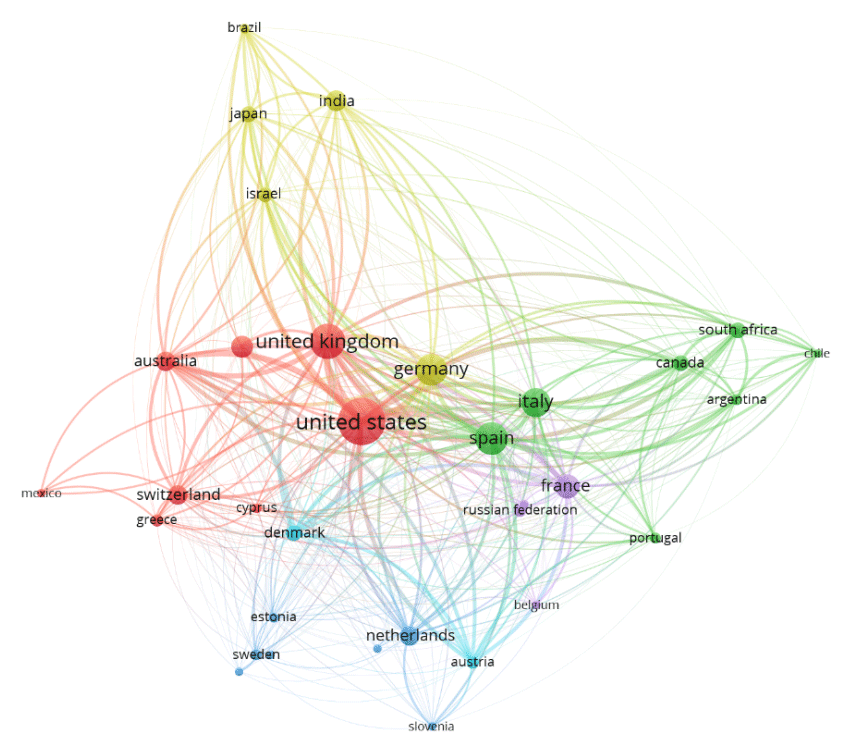
Figure 3
Bibliographic coupling network (from VOSviewer).
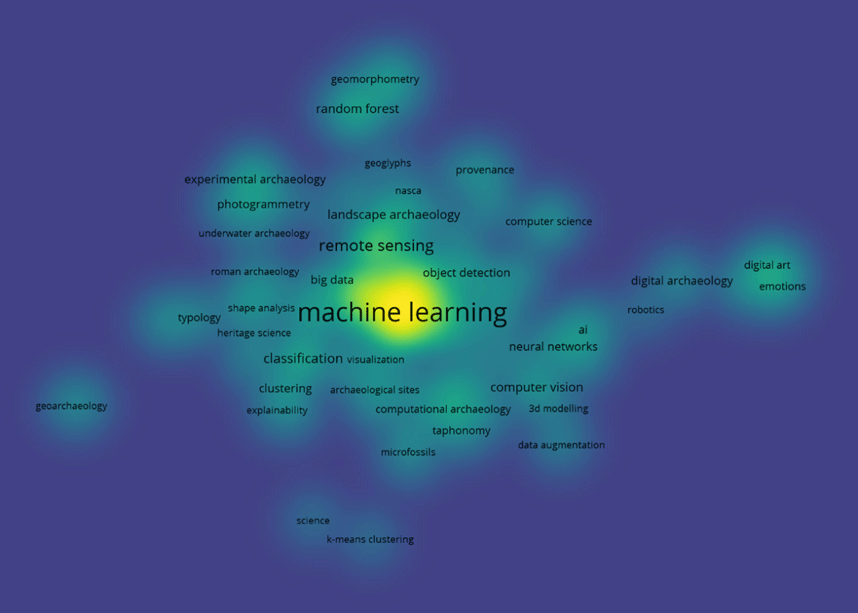
Figure 4
Keyword map (Vos Viewer).

Figure 5
Keyword relation and density (Vos Viewer).
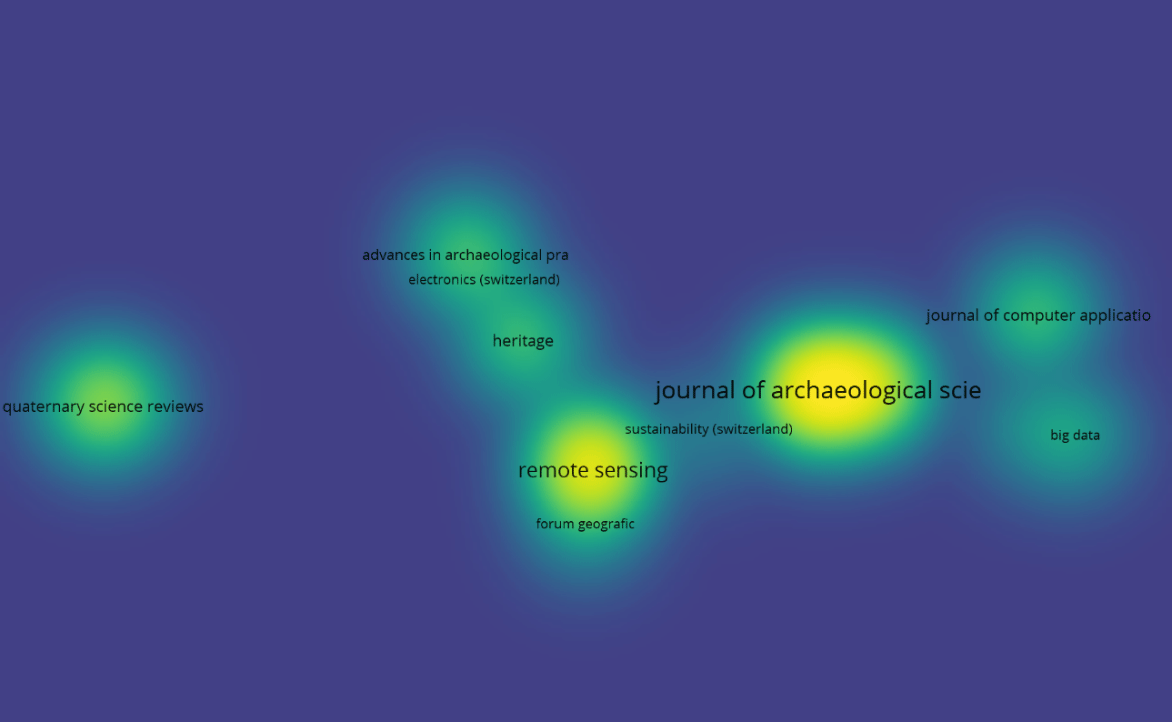
Figure 6
Citation sources density map (VOSviewer).
Table 1
Main publications 2010–2024.
| PERIOD | NUMBER OF PUBLICATIONS | MAIN TECHNOLOGIES | AREAS OF INTEREST |
|---|---|---|---|
| 2010–2014 | 79 | Basic algorithms for geospatial data analysis | Initial identification of sites |
| 2015–2019 | 132 | LIDAR, predictive algorithms, photogrammetry | Mapping and predictive modelling |
| 2020–2024 | 243 | DL, IoT (Internet of Thing) integration, DT (Digital Twin) | Monitoring and conservation |
Table 2
Summary of analyzed works.
| WORK | GOAL | TYPE OF DATA | TECHNIQUE | RESULT |
|---|---|---|---|---|
| (Garrido et al., 2021) | Detection and Mapping of Site | Predictors | MaxEnt | 0.859 AUC |
| (Altaweel, Khelifi and Shana’ah, 2024) | Issues Detection and Mapping of Archaeological Sites | Images: Three Channel | Mask R-CNN Segmentation | 93% A |
| (Tao et al., 2023) | Identification | Images: Three Channel | Classification: VGG16, Detection: Resnet | Class: 90.79% A Detect: 95.61% A |
| (Altaweel et al., 2022) | Identification | Images: Three Channel | Mask R-CNN instance segmentation | Over 0.9 A |
| (Trier, Reksten and Løseth, 2021) | Identification | Images: laser scanning | Faster R-CNN Detection | 87% correct class Less 1 % wrong class 13% not detected |
| (Anttiroiko et al., 2023) | Identification | Images: laser scanning | U-Net based semantic segmentation | 93% A |
| (Richards-Rissetto, Newton and Al Zadjali, 2021) | Identification | 2D Images and 3D data | PointConv Detection | 95% A |
| (Grilli and Remondino, 2020) | Identification | 3D point cloud | Random Forest | 0.70 to 0.99 F1 |
| (Mertel, Ondrejka and Šabatová, 2018) | Identification | Predictors | Graph analysis and comparison using hamming distance | 0.65 AUC |
| (Wachtel et al., 2018) | Identification | Predictors | Max Ent | 0.796 ± 0.02 AUC on control group 14 and 20% test |
| (Yaworsky et al., 2020) | Identification | Predictors | Max Ent | 0.88 AUC |
| (Imen et al., 2024) | Identification | Predictors | Max Ent | 0.860 AUC |
| (Zhang et al., 2022) | Issues Detection | Images: Three Channel | FPN-vgg16 Detection | 84.40% F1-m 73.11% IoU-s |
| (Sizyakin et al., 2020) | Issues Detection | Images: Three Channel | MCNC (CNN) | 0.819 F1 |
| (Valero et al., 2019) | Issues Detection | 3D point cloud | LR Multiclass | About 0.9 R |
| (Mishra, Barman and Ramana, 2022) | Issues Detection | Images: RGB | YoloV5 Detection | 93.7% mAP |
| Casillo et al., 2024 | AI for Decision Making | Predictors | KNN | 92.21% A |
| (Karadag, 2023) | AI for Decision Making | Images: Three Channel | GAN | 0,88-0,95 SSIM |
| (Ribera et al., 2020) | AI for Decision Making | Predictors | Analytic Hierarchy Process (AHP) | Avg 8.14 ROI |