
1 Introduction and previous work
The recent abundance of LiDAR and other remote sensing data sources have led to a “Big Data” problem in Archaeology. It has become evident that identifying archaeological remains at large scales within these data sources is beyond human capacity alone, necessitating some degree of automation (McCoy 2017). Various projects have addressed this issue, primarily leveraging Artificial Intelligence (AI) technologies such as Convolutional Neural Networks (CNNs). Early projects focused on mapping objects with relatively simple geometric shapes, such as charcoal kilns or barrows, often within small study areas at the county or district level. Efforts to detect more complex structures, such as field systems and hollow roads (Verschoof-van der Vaart and Landauer 2021) or hillforts and similar features such as ringforts and enclosures (Cerrillo-Cuenca & Bueno-Ramírez 2019; Freeland et al. 2016; Gallwey et al. 2019; Sevara et al., 2016; Stott, Kristiansen & Sindbæk 2019; Trier, Cowley & Waldeland 2019), have been less frequent, likely due to their high variance in appearance.
Moreover, most projects have focused on relatively small areas, with only recent attempts extending to district or provincial levels. A recent study by Vinci et al. (2024) found that, out of 291 reviewed projects, only eleven had research areas exceeding 10,000 km2, and only five of these utilized AI for automatic detection. These include Berganzo-Besga et al. (2023) in Galicia, Spain (approximately 30,000 km2); Carter, Blackadar and Conner (2021) in Pennsylvania, USA (37,000 km2); Cerrillo-Cuenca and Bueno-Ramírez (2019) on the Iberian Peninsula (30,000 km2); Stott et al. (2019) in Denmark (42,000 km2); and Verschoof-van der Vaart et al. (2023) in Connecticut, USA (12,500 km2).
The study presented here is among the first to analyse three distinct European geographical zones –England, Hesse in Germany and Molise in Italy – using a unified approach, covering a total area of approximately 180,000 km2. The objective of this research is threefold. First, we aim to develop a novel semi-automatic workflow for generating suitable datasets for CNN training. This is based on the hypothesis that a curated list of a few hundred known objects of a given type can be sufficient to identify a large number of previously unknown objects of the same type within a region. Second, we demonstrate that this methodology is effective even with complex and varied object types, using prehistoric hillforts in England as a case study. Third, we explore how to establish an efficient human verification process for AI-generated results over such large areas.
Following this introduction, Section 2 outlines our method and workflow for automated hillfort detection over large areas using LiDAR data. It also explains how this approach can be adapted for use in other regions across Europe. Section 3 presents the results from our case studies conducted in England, Germany, and Italy, including a detailed description of the manual verification process we developed for AI-based detections and its associated productivity metrics. Section 4 provides a discussion of our findings, then summarizes key insights and potential future directions for this research.
2 AI architecture and landscape-wide search
The Artificial Intelligence (AI) based architecture of our method as initially outlined in a previous publication (Landauer and Verschoof-van der Vaart 2021), where readers can find details. However, since then, it has undergone significant enhancements, which are described below.
2.1 Dataset creation
The Atlas of Hillforts of Britain and Ireland (Lock and Ralston 2017) is a comprehensive and up-to-date record of over 4,000 hillforts, and an invaluable database for further research (e.g., Maddison 2022). It provides approximate centre coordinates, but there is no data available for the exact shapes of hillforts. Therefore, we designed a simple yet efficient setup for our AI model. We collected approximately 2,000 LiDAR images of known hillforts in England and Wales by extracting vignettes around their centre coordinates from the Digital Elevation Models (DEM) available online, provided by the UK Government Environment Agency (UK Government, Department for Environment, Food & Rural Affairs, 2023). These vignettes were 768 × 768 m2 (or 3*28 pixels) in size, ensuring that practically all hillforts were fully included within their respective vignettes. As a result, the AI model predicts the likelihood that a given vignette contains hillfort-like features, rather than pinpointing the exact location or shape of the hillfort. Given the average dimensions of hillforts, this method revealed effective for our scopes.
A manual analysis of this initial set revealed that many vignettes had to be discarded due to their present condition, with sites destroyed, ploughed out, disappeared due to urban development, etc. However, 579 hillfort vignettes remained for training. We also collected around 20,000 vignettes of random land across England to serve as negative samples, or “non-hillforts”. This approach is justified by the fact that the “hillfort” class is extremely rare in the landscape – less than 0.05 percent of British land is covered by hillforts –, minimizing the risk of accidentally selecting a hillfort as a negative sample.
Unlike other research, we used the raw DEM data as input for the Neural Network (NN) training, without generating visualizations such as Local Relief Models or hillshades. Instead, for data normalization, we applied Min/Max Normalization (also known as Feature Scaling), which our earlier research (Verschoof-van der Vaart & Landauer 2021) indicated produced better AI training results than using visualizations (but also note that Berganzo-Besga et al. (2021) report contrary results in this regard).
2.2 Neural Network training with semi-supervised quality improvement
Since shapes of hillforts were unavailable, we addressed our problem as a Deep Learning image classification task: We trained a Neural Network (NN) classifier using a ConvNeXt architecture (Liu et al. 2022) for 50 epochs that was pre-trained on ImageNet and implemented in the Fast.ai (Howard & Gugger 2020) and PyTorch (Patzke et al. 2019) programming libraries. Data augmentation techniques such as random horizontal and vertical flipping, as well as resizing and cropping (Takahashi, Matsubara & Uehara 2019), were applied to improve the training results. The loss function used was weighted label smoothing cross-entropy loss (Szegedy et al. 2016). This resulted in a classifier capable of analysing any LiDAR vignette of the same size and assigning a confidence score (0–100%) indicating the likelihood of hillfort-like features being present.
To further enhance detection quality, we applied Pseudo Labelling, a semi-supervised learning technique (Lee 2013), to refine the training dataset. We ran all vignettes through the trained NN and evaluated them according to their confidence scores. Hillforts with a score below 85% and non-hillforts with a score above 5% were considered outliers and removed from the dataset. A second NN was then trained on the reduced dataset (505 hillforts and 15,156 non-hillforts) for another 12 epochs, which led to a 4% increase in accuracy.
2.3 AI quality evaluation across the landscape
The resulting NN classifier can then be applied to large landscape areas of arbitrary size to detect traces of hillforts. To do this, we iterated over LiDAR tiles using a grid-like fashion with a step size of 384 meters, which is half the vignette dimension. We empirically found that overlapping vignettes provided better results. For each grid point, we retrieved the corresponding LiDAR vignette and obtained the NN prediction. Confidence values above 90% (determined empirically) were considered positive detections, indicating that a hillfort was likely present nearby. Figure 1 illustrates an example result, where yellow grid points represent a confidence score of 90% or more, suggesting the presence of a possible hillfort.
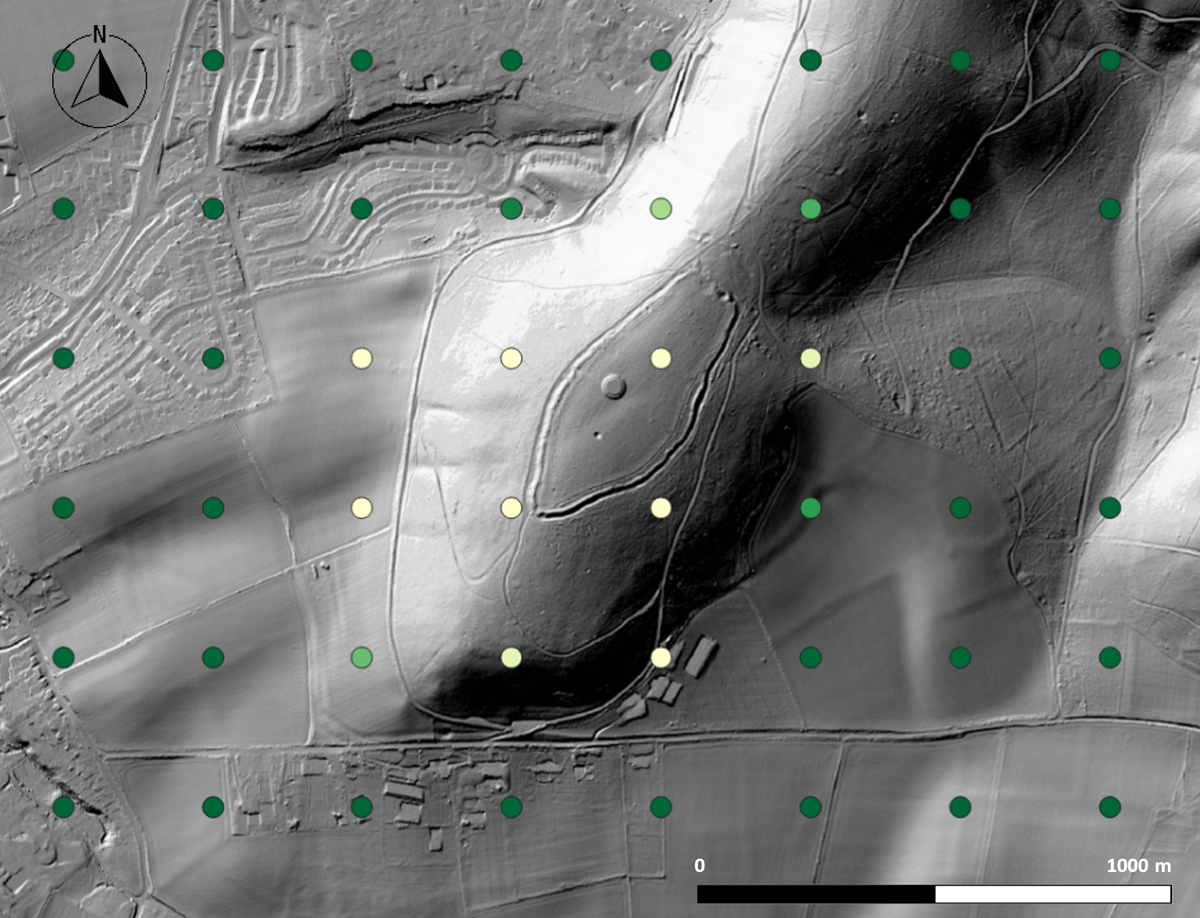
Figure 1
Example prediction result shown on LiDAR background. Grid points with brighter colours indicate higher confidence of a hillfort being nearby (DEM: DEFRA).
To assess the quality of our approach, we conducted an automatic test procedure, comparing AI predictions with hillfort data from the Atlas as ground truth. We selected three test areas, each approximately 2,000 km2, in England. These areas – around Northumberland National Park, northwest of Northampton in the Midlands, and a coastal region west of Taunton in Cornwall – were chosen for their diverse landscape types, with known hillforts excluded from training.
For these areas, we generated a confusion matrix by clustering adjacent yellow grid points into singular possible hillfort detections. Clusters where at least one grid point was within 500 meters of a known hillfort were considered True Positives (TP). Detections without such proximity were False Positives (FP), while undetected hillforts were counted as False Negatives (FN). True Negatives (TN) were not meaningful in this context, as the remaining landscape can essentially be considered TN.
Given that hillforts are rare, accuracy as a quality metric would likely be misleadingly high. Instead, we used the F1 score – the harmonic mean of precision and recall – which is better suited for imbalanced datasets like this.
Table 1 shows the results from the test areas. The F1 score is not uniform across regions, which was expected due to the heterogeneity of key parameters such as hillfort distribution, altitude patterns, and the extent of destruction in urban areas. This variability likely explains the relatively low F1 score and the higher number of False Positives compared to more uniform archaeological datasets, such as mounds or barrows.
Table 1
Result metrics for test regions.
| REGION | KNOWN HILLFORTS | PREDICTED BY AI | TP | FP | FN | TN | PRECISION | RECALL | F1SCORE |
|---|---|---|---|---|---|---|---|---|---|
| Northumberland National Park | 71 | 182 | 49 | 133 | 22 | Not applicable | 0.27 | 0.69 | 39% |
| Northampton | 9 | 15 | 5 | 10 | 4 | 0.33 | 0.56 | 42% | |
| Taunton (Cornwall) | 32 | 108 | 26 | 82 | 6 | 0.24 | 0.81 | 37% | |
| Total | 112 | 305 | 80 | 225 | 32 | 0.26 | 0.71 | 38% |
Note that these figures are only meant to provide an estimate of the overall quality of our approach. In our opinion human experts must subsequently validate the False Positives (as described in Section 3 below) to see if some of them are misclassified and are indeed previously unknown hillforts, that is, True Positives not yet found in the “ground truth” database of the Atlas. However, this already implies a substantial gain in human productivity by using AI: Validating these 305 AI predictions would take only a tiny fraction of the time required to analyse all test regions, totalling 6,000 km2.
2.4 Country-wide hillfort search
As we are interested in applying our workflow to very large land areas, even at a regional or country-wide scale, it became clear that this creates a computational challenge: England, for example, with an area of more than 130,000 km2 has a total of 266 GB of LiDAR data available. In our setup this means that almost one million LiDAR patches need to be processed.
To reduce processing time to just a few hours on a mid-range PC with a 16-core CPU, we implemented several key optimizations. We used Python’s multiprocessing package (Python Software Foundation. 2023) to efficiently load and pre-process LiDAR data in memory and ran neural network predictions on an Nvidia RTX 2060 GPU rather than the CPU. These improvements allowed us to process all of England’s data in under five hours. The full-scale search across England achieved an F1 score of 36%, consistent with the results from the test regions.
2.5 Moving on to other regions: Dealing with the Model Drift problem
Initial attempts to apply the neural network classifier trained on English hillforts to foreign landscapes produced poor detection results. This aligns with a well-documented issue known as the “Model Drift Problem”. Neural networks often perform poorly when applied to data (in this case, LiDAR tiles) that differ from the original training data. In our case, this issue likely stems from differences in LiDAR scanning equipment and techniques, varying landscape patterns, and the stochastic distribution of elevation values across different regions. While several approaches to address the Model Drift Problem have been proposed (see Xu et al. 2023 for a recent overview), we found that a relatively simple solution yielded good results: we fine-tuned the model trained on English data by retraining it for a few iterations (12 epochs) using only a small sample of data from the new region of interest. This fine-tuning process helps the neural network adapt to the unfamiliar landscape by adjusting its parameters accordingly. Table 2 illustrates this for Hesse and Molise (see the evaluation sections below). By fine-tuning the model with 3,000 randomly selected LiDAR patches from the local landscape and a very small sample of 22 or 32 known hillforts, respectively, the F1 score increased to around 34–38%. These evaluations excluded the known hillforts from the final calculations.
3 Case studies and the human verification process
Current AI systems used in landscape archaeology, including the one presented here, are often not yet advanced enough to deliver meaningful and reliable results without significant verification by human experts. This is frequently due to issues with the reliability of training data, which can become particularly challenging when working with very large areas, as human resources for validation are often limited. Therefore, we sought to investigate how to carry out this validation process efficiently and consistently across large areas, potentially spanning several thousand square kilometres. In the case studies reported below, we not only detail how the method was applied to three distinct landscape types across Europe and the results obtained, but we also focus on evaluating the manual process of verifying AI-generated results and the amount of human effort required. The input for the analysis was standardized for each human validator: a CSV file containing grid point coordinates within the region, the predicted scores for each point, and a set of GeoTIFF files visualizing the locations (with visualizations chosen by the archaeologist) of the top 2,000 highest-scoring landscape vignettes from the neural network. For the human verification process, we intentionally allowed for some variability in order to assess which workflow was more efficient or consumed less time per find. This flexibility accounted for personal preferences, such as the choice of different LiDAR visualization methods, as well as regional differences that necessitated varying approaches. These included the availability of maps, databases, and other documentation for recorded sites in each region. As a result, the following three sections provide both a description of the results and details of the individual analysis process selected by each researcher.
3.1 Chilterns Hills and Northern England
Two regions of England were selected for evaluation. The Chiltern Hills, located to the northwest of London, have been the focus of a recent Citizen Science project and have undergone detailed analysis over several years, resulting in a thorough and comprehensive examination (Chilterns AONB 2023). This region served as the initial case for developing the methodology, achieving notable success, as discussed below. In contrast, Northern England was chosen as an area with relatively few known hillforts and was analysed as a self-contained study, building on the earlier experience. Metrics of effort and time were recorded for this second analysis and are described below.
3.1.1 Verification method
For the Northern England analysis, each of the top 1,500 sample vignettes was manually inspected for potential features of interest in the first pass. Vignettes deemed of interest were flagged in a control spreadsheet. In the second pass, these flagged vignettes were examined using an online map (Streetmap EU Ltd. 2009) to check for correspondence with recorded features. If a vignette remained of interest, a search was conducted on the Historic Environment Record (HER) for England using the relevant coordinates (Heritage Gateway 2012). The HER is a statutory database containing records of the archaeology and historic built environment of a given area. Items identified from the HER search were further cross-referenced using resources such as OS Maps (Ordnance Survey 2025) and Google Earth (Google 2025), although the latter was typically not very useful. Detailed results, including time stamps for the start and completion of each work tranche, were recorded in the control spreadsheet. This process is illustrated in Figure 2.
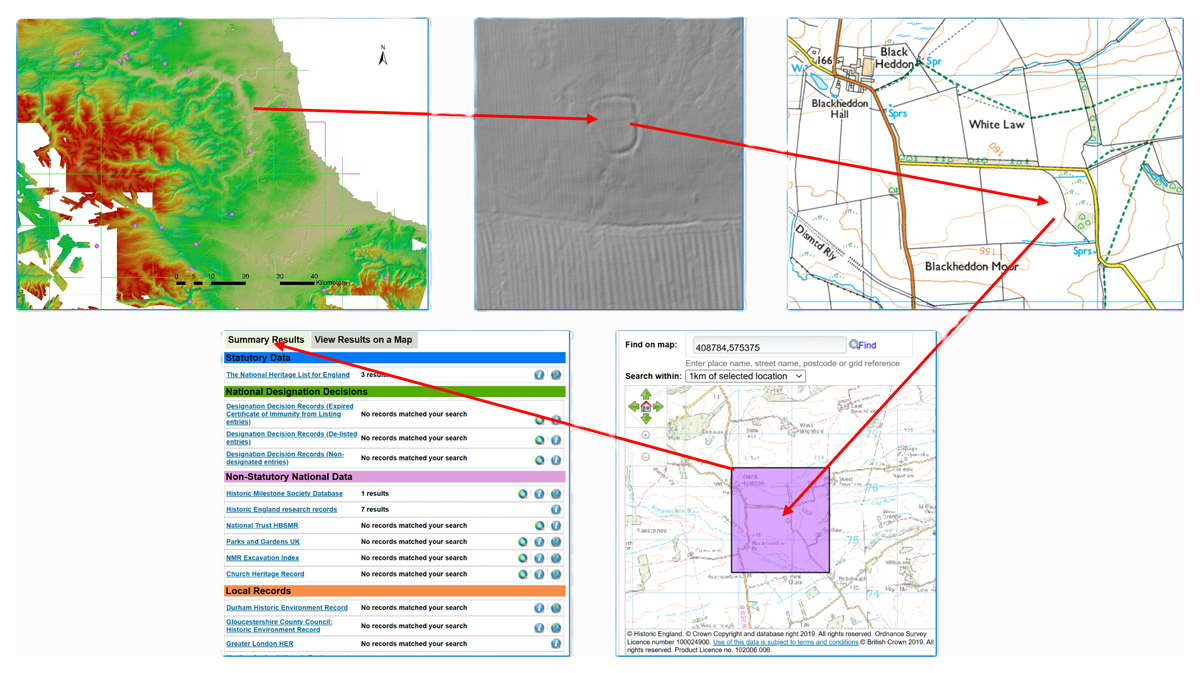
Figure 2
Illustration of the procedure for processing the AI output.
3.1.2 Results
For this analysis, the sample vignettes were broken down into manageable work packages, starting with the highest priority sites. The total time taken for the first stage inspection of 1,500 samples was 01:41 hours, averaging 4 seconds per site. This initial review identified 95 candidates for more detailed investigation. The second stage of the process, which involved more in-depth analysis of these candidates, took a total of 4 hours and 52 minutes, averaging 3 minutes and 3 seconds per site, though some sites required as much as 11 minutes. Notably, these times improved throughout the process as efficiency increased with streamlining and experience (see Table 3). The total recorded time for the analysis was 6 hours and 32 minutes, with an additional 2 hours spent on setup activities, resulting in a grand total of approximately 8 hours and 30 minutes. The ratio of candidates to samples decreased as the AI’s confidence thresholds declined, but it is noteworthy that a candidate was still identified even at probabilities as low as 66–70%.
Table 3
Timing breakdown for the North of England analysis.
| STAGE 1 | STAGE 2 | |||||
|---|---|---|---|---|---|---|
| AI CONFIDENCE SCORE | # SAMPLES | TOTAL TIME (HRS) | # SAMPLES | SAMPLE RATIO | TOTAL TIME (HRS) | RESULTS |
| 90–100% | 89 | 00:17 | 24 | 27% | 01:37 | No candidates |
| 85–90% | 168 | 00:31 | 29 | 17% | 01:27 | Two candidate enclosures, each from one sample |
| 80–85% | 235 | 00:18 | 11 | 5% | 00:23 | no candidates |
| 75–80% | 285 | 00:07 | 8 | 3% | 00:05 | One candidate enclosure |
| 70–75% | 377 | 00:13 | 14 | 4% | 00:49 | Two candidate enclosures, one from two samples. This latter is auxiliary to a recorded medieval site |
| 66–70% | 346 | 00:15 | 9 | 3% | 00:30 | One candidate enclosure from a single sample |
| TOTALS | 1500 | 01:41 | 95 | 04:51 | ||
| Average | 0:04 min | 3:03 min | ||||
As mentioned above, the Chilterns area in southern England was the focus of a Citizen Science archaeology project, which made high-resolution LiDAR data available through an interactive website (Chilterns AONB 2023). Most notably, the project led to the discovery of a previously unrecognized hillfort, shown in Figure 3. The exact location of this site remains confidential. We were able to independently identify this hillfort, and our findings were confirmed by the Chilterns project team (pers. comm.).
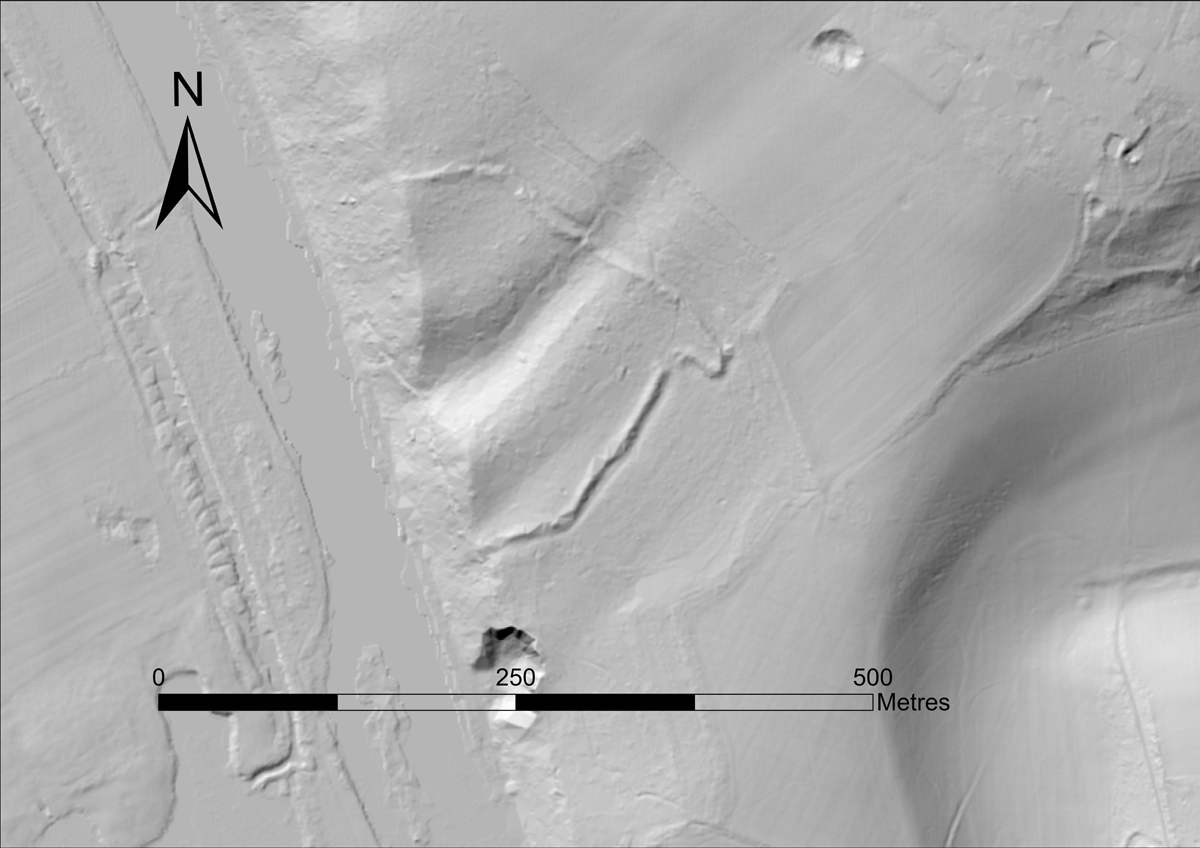
Figure 3
Previously unrecognized English hillfort in the Chilterns region, independently identified by the project (DEM: DEFRA).
In the course of our analysis of Northern England, several enclosures were identified (three of which are shown in Figure 4). While these enclosures were not listed in the Atlas, they are recorded as enclosures in the HER. Their identification suggests that they could be considered candidates for classification as hillforts as part of an ongoing review of the Atlas data. By way of comparison, Figure 5 presents examples of false positives – landscape features that were mistakenly flagged as hillforts. These include various formations resulting from mining activities, medieval structures, and the effects of ploughing around woodland copses. Even to the human eye, some of these features could be misinterpreted as prehistoric earthworks.
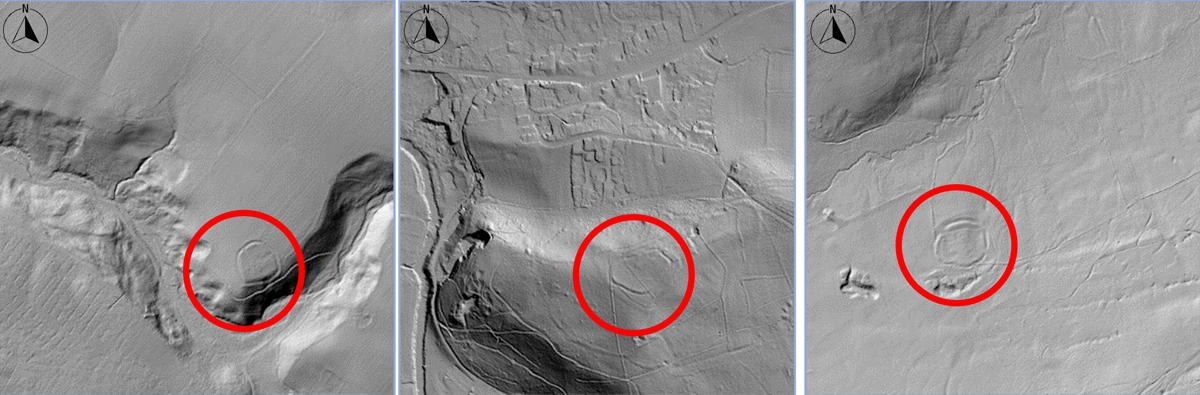
Figure 4
Possible hillforts in Northern England found by AI, not in the Atlas but documented in the HER (DEM: DEFRA, vignette size 768 m ×768 m).
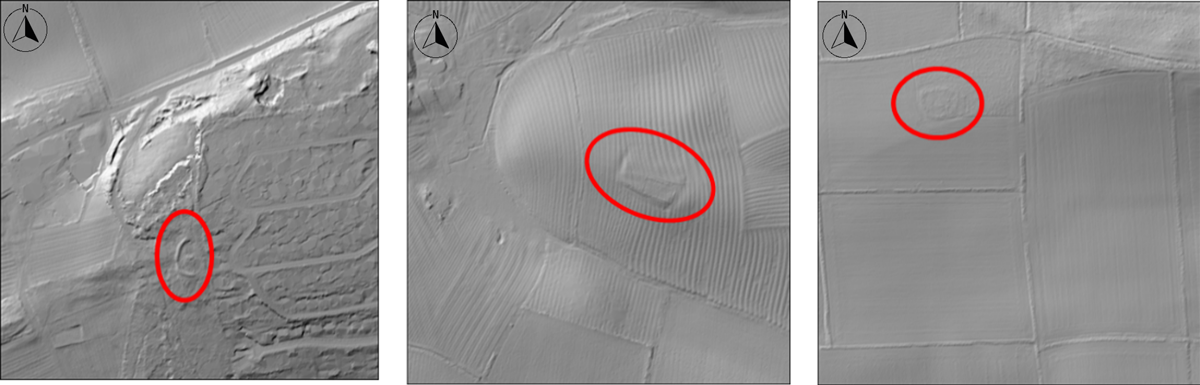
Figure 5
Examples of False Positives (DEM: DEFRA, vignette size 768 m ×768 m).
3.2 Hesse, Germany
Hesse, a state in central German, covers approximately 21,000 km2 (Figure 6). Its diverse landscape includes the Rhine flood plains, fertile regions such as the Wetterau, and mountainous areas like the Taunus and Vogelsberg. Forests make up 42.3% of the land area. Since many known hillforts have been preserved beneath forest canopies, Hesse’s varied landscapes — despite their heterogeneity — present good opportunities for discovering three-dimensional archaeological remnants, such as burial mounds, ditches, and the ramparts of prehistoric hillforts (Figure 7) in LiDAR (available from Hessische Verwaltung für Bodenmanagement und Geoinformation Digitale Geländemodelle 2025).
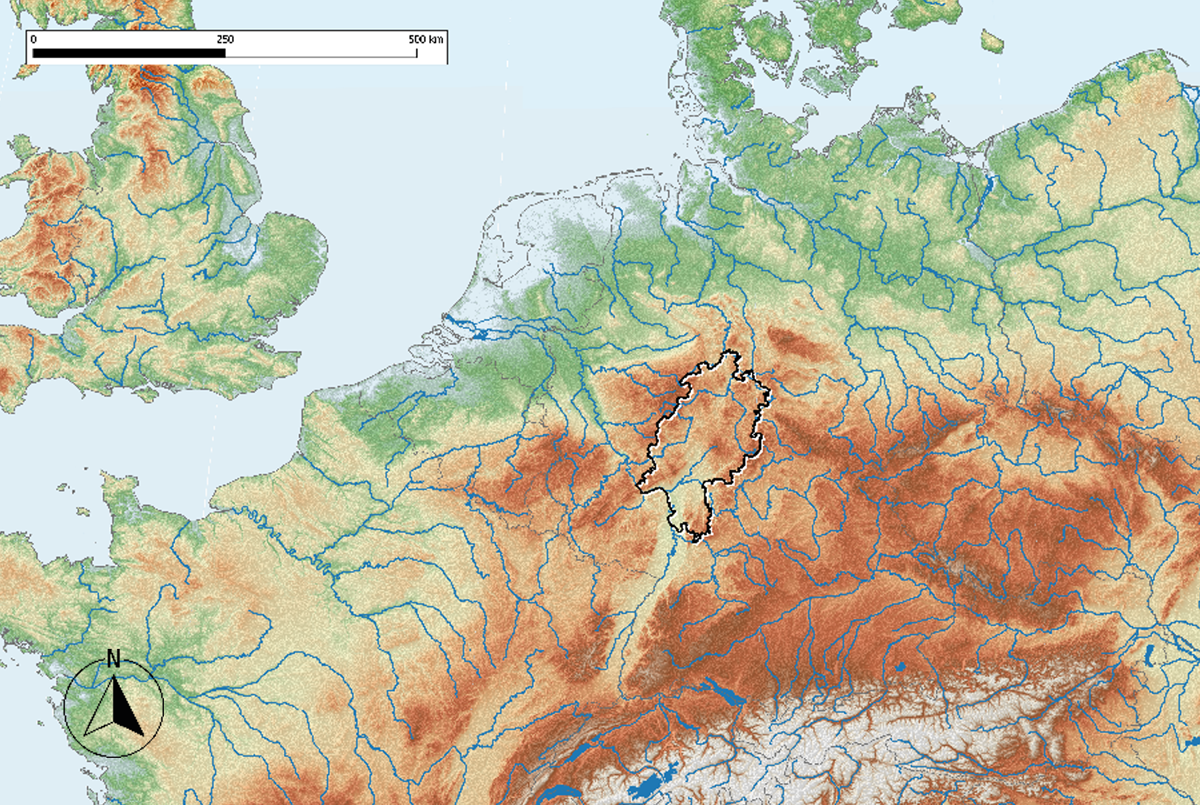
Figure 6
The German state of Hesse in Europe (SRTM USGS-authored or produced data and information are in the public domain).
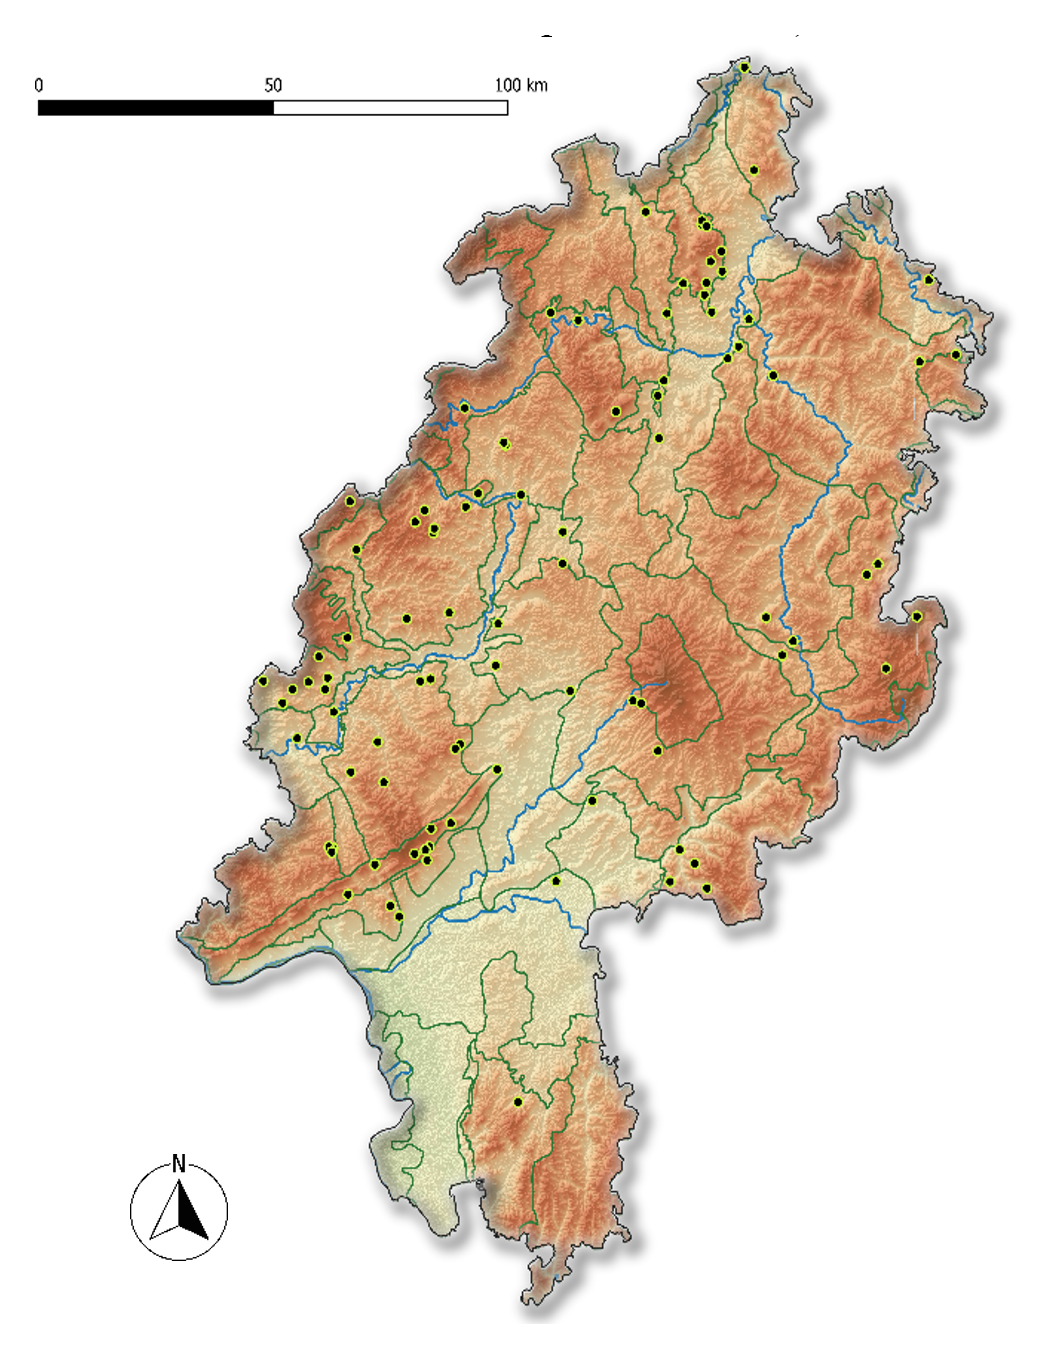
Figure 7
Known hillforts in the state of Hesse (SRTM USGS-authored or produced data and information are in the public domain; natural regions BFN; forests GDS Hessen).
3.2.1 Verification method
Possible hillfort locations identified by AI (as described above) with a confidence score above 90% were imported into QGIS as vignettes of hillshade terrain models (Figure 9) and subsequently classified based on their likelihood of containing a (prehistoric) hillfort. The classification also considered the potential factors that led to these areas being identified as hillforts. The manual evaluation was supported by additional LiDAR DEM visualizations, including the Simple Local Relief Model and hillshade (Kokalj & Hesse 2017), along with digital orthophotos of the state of Hesse, OpenStreetMap, and Wikipedia (mainly used to assess potential castle or chateau sites).
3.2.2 Results
The AI prediction process described above identified 169 possible hillfort locations with a confidence score above 90% (Figure 8). These were classified based on their likelihood of containing a (prehistoric) hillfort with the results shown in Table 4. The 169 candidates were evaluated and classified within approximately two hours.
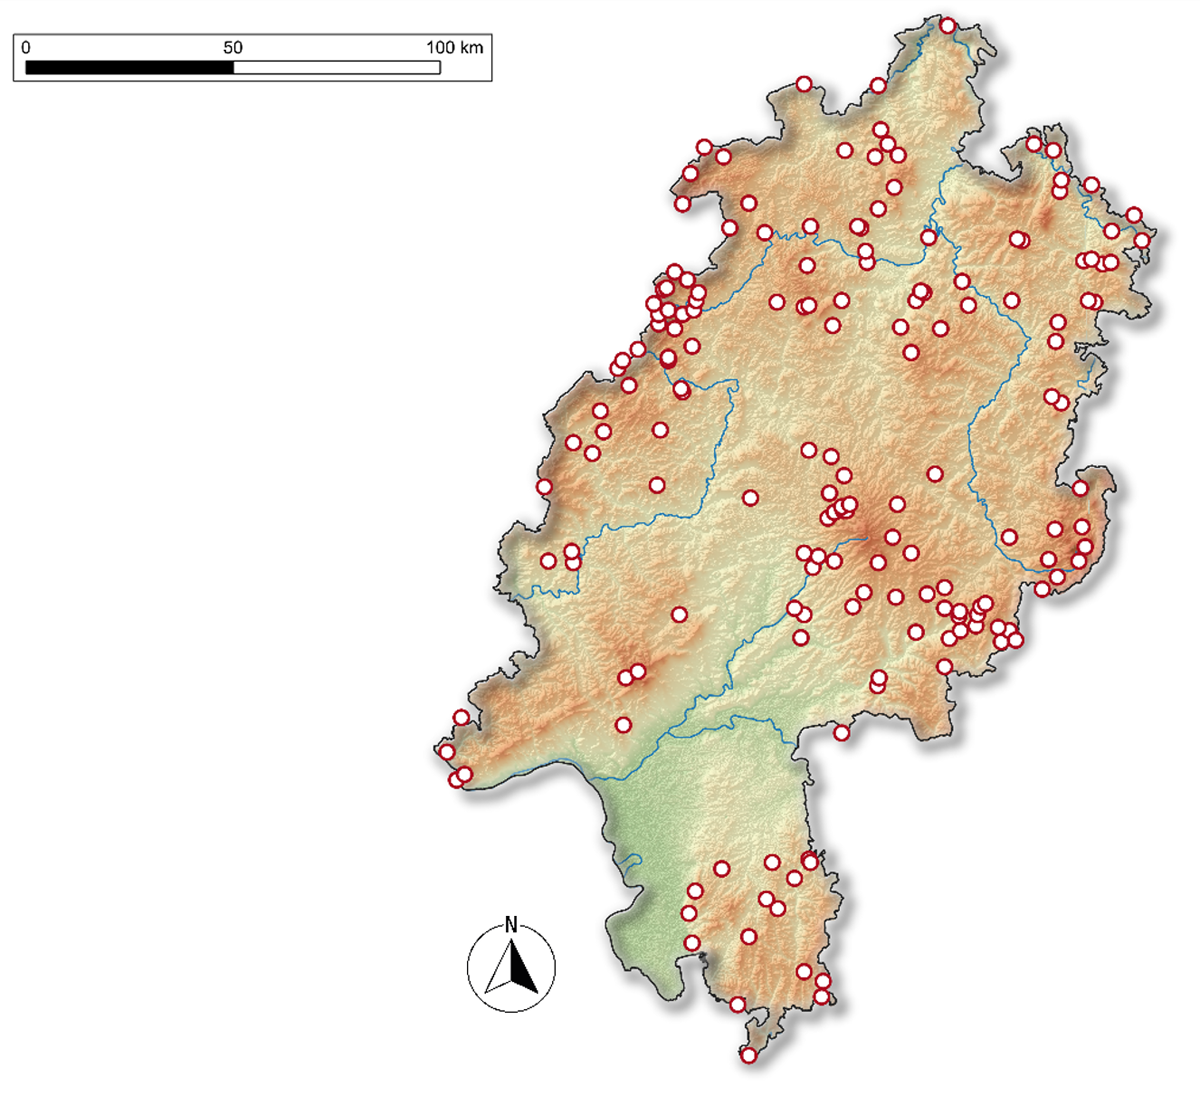
Figure 8
Potential hillforts sites with a confidence value of >90% in the state of Hesse. (SRTM USGS-authored or produced data and information are in the public domain).
Table 4
Classification of the potential hillfort likeliness of findings with a confidence value >90%.
| EVALUATION | # SITES |
|---|---|
| Obvious false positives | 148 |
| Hillfort site (known), often medieval castle or ringwall | 12 |
| Maybe hillfort | 4 |
| Road | 2 |
| Waste disposal site | 2 |
| Geological formation (other) | 1 |
| Total | 169 |
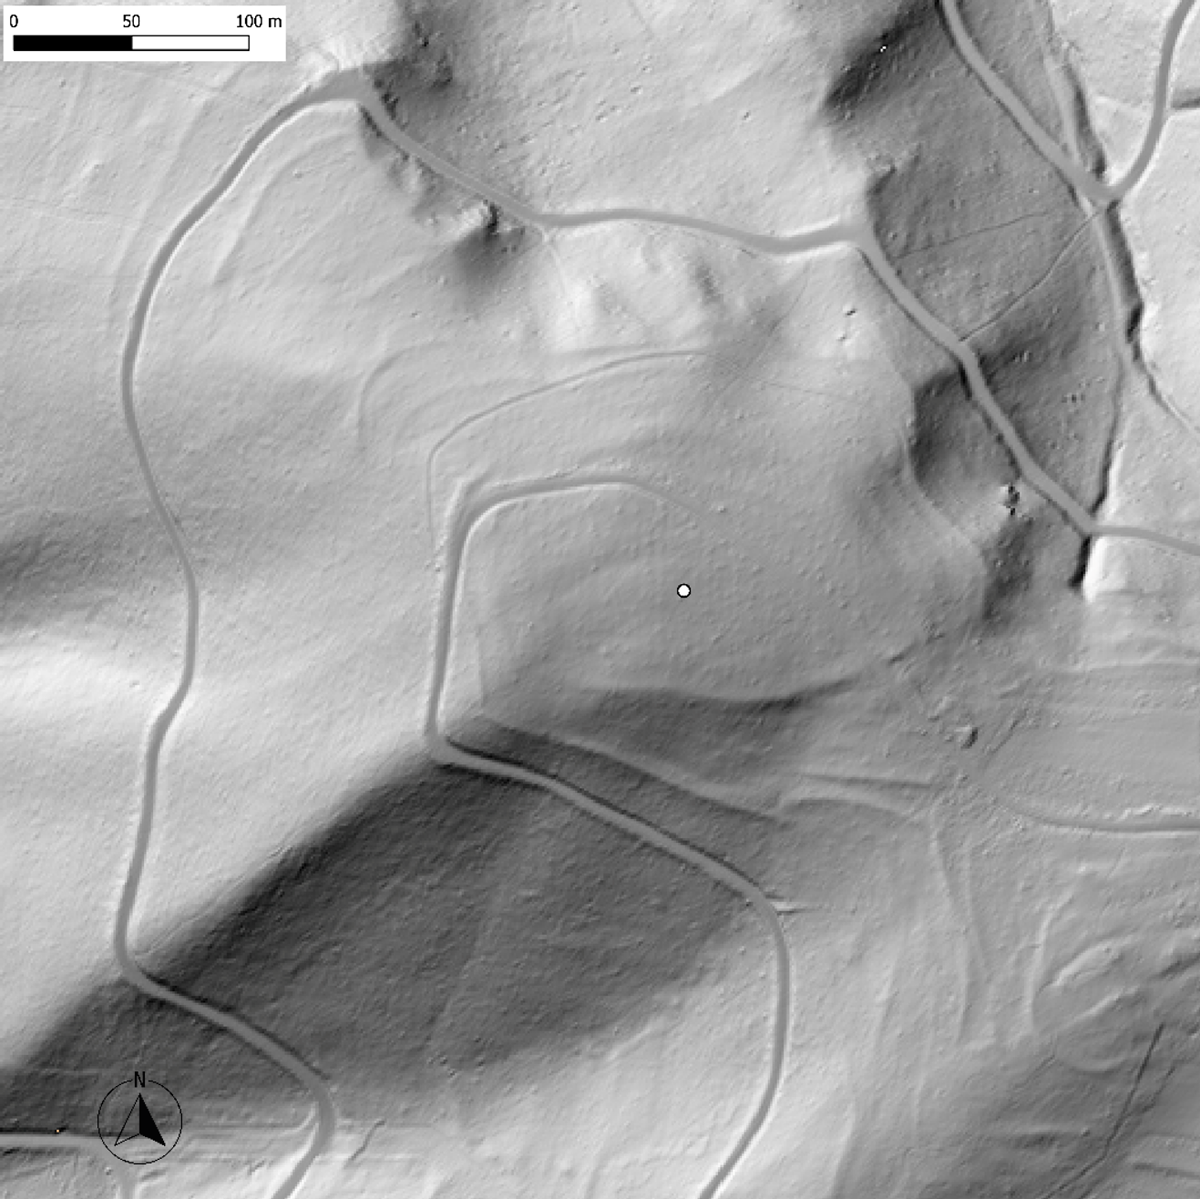
Figure 9
Hillshade DEM vignette of a potential hillfort site (DEM: HVBG).
The majority of the AI detections – 148 in total – were false positives (see below for analysis) and were identified relatively quickly. However, 12 hillfort sites were discovered that had been mistakenly omitted from the training data. Additionally, four sites were classified as “possible hillforts” (Figure 10), meaning that further investigation, such as ground surveys or other archaeological methods, is required to confirm their classification. These four sites highlight the challenges of detecting hillforts and other archaeological features using LiDAR data. Some features appear to be potential hillforts, but the evidence is not clear enough for definitive identification. This issue is not unique to LiDAR interpretation; it is also encountered during ‘ground truthing’ efforts, where fieldwalking and even excavations may not always provide conclusive results.
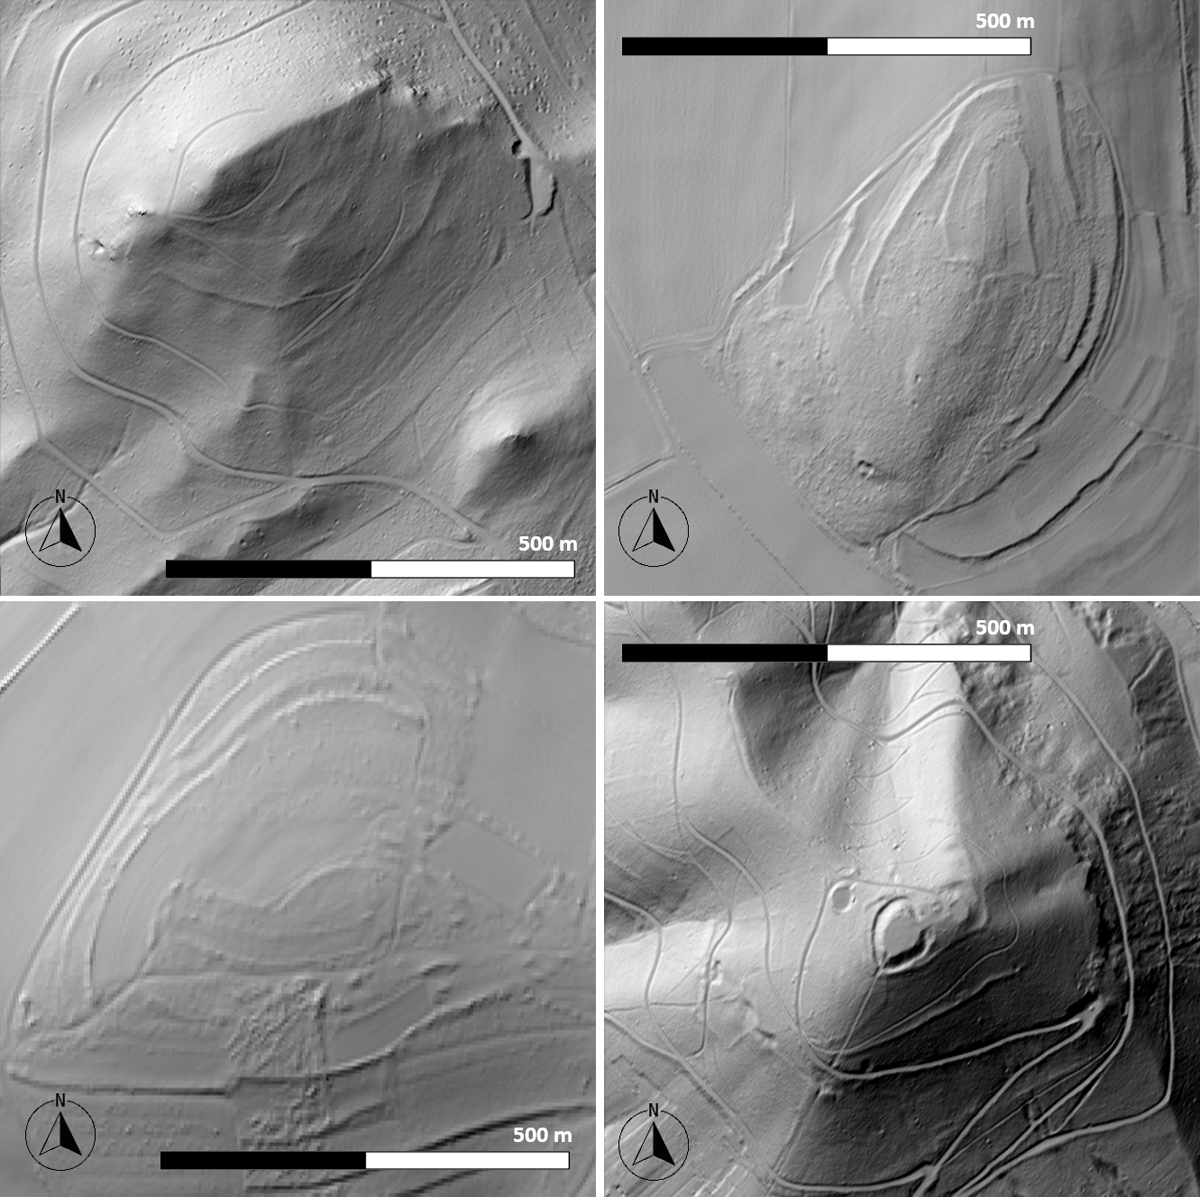
Figure 10
Examples of possible hillforts (as classified by AI).
The AI also identified castles and chateaux, which, once their building structures are removed from the Digital Surface Model (DSM), leaving only the Digital Terrain Model (DTM) data, resemble prehistoric hillforts in the LiDAR data. This result demonstrates the capability of the AI algorithm for the intended purpose.
One reason for the large number of false positives is the presence of other features, mainly forest paths and terrain characteristics. These often appear as circular formations around hills, making them visually similar to hillfort ditch and rampart systems, which typically follow contour lines around hills or plateaus (Figure 11). Additionally, field boundaries, quarries, or modern features were sometimes misidentified as hillforts.
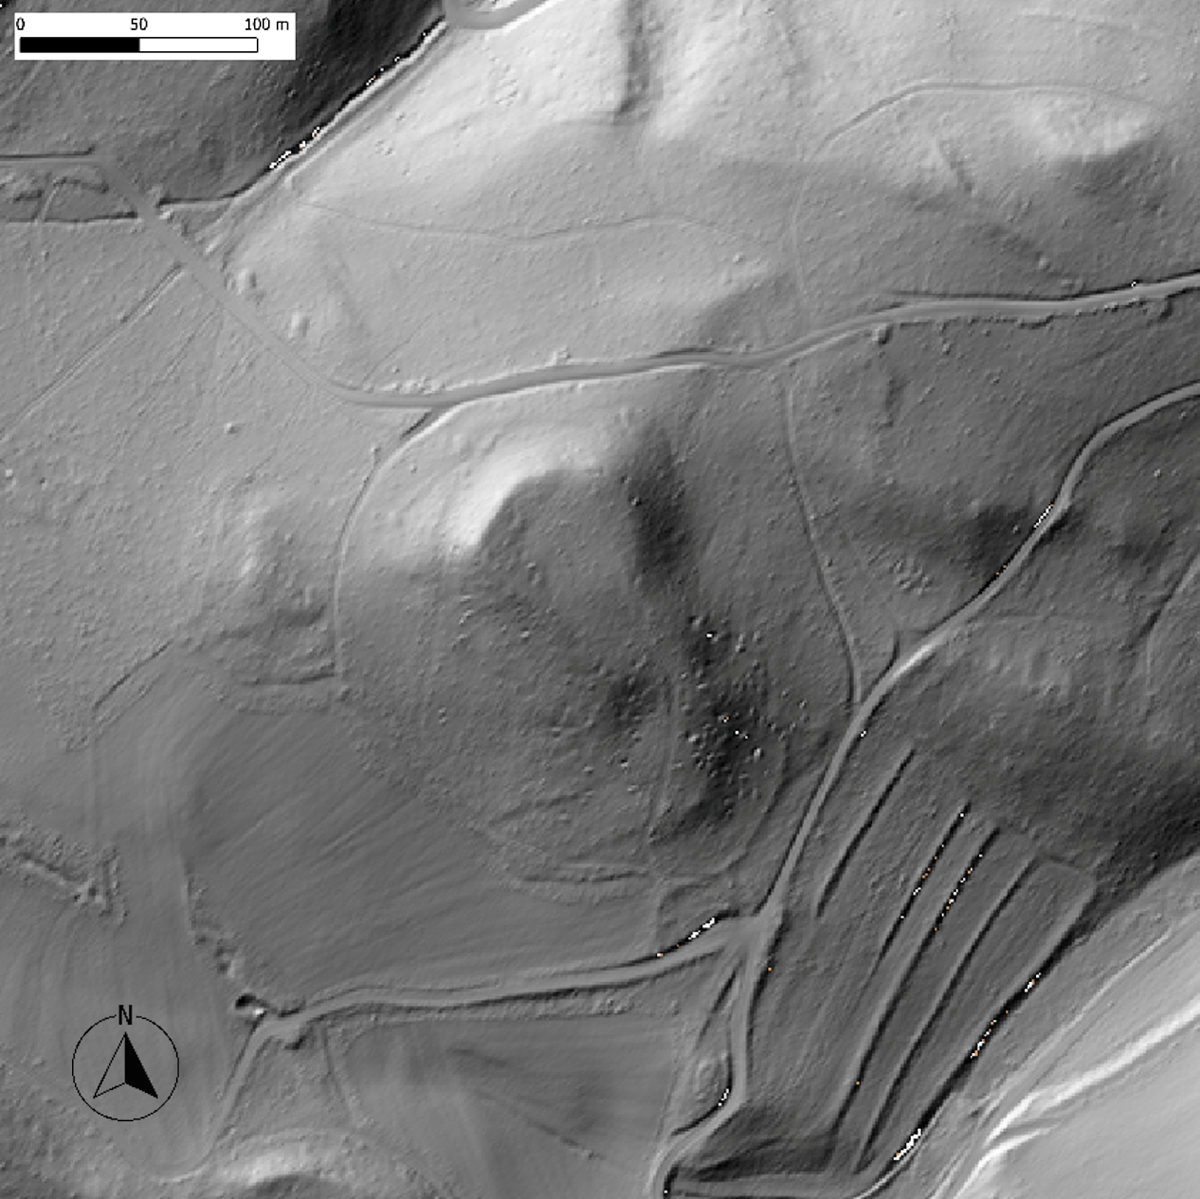
Figure 11
Example of a false positive candidate, most likely wrongly classified due to existing forest paths and terrain structures (DEM: HVBG).
Another factor contributing to the false classifications is the diversity and heterogeneity of hillforts in terms of their shapes, sizes, and placements within the landscape (Figure 12). This variability makes it challenging to establish consistent patterns for classifying large features as hillforts (Posluschny 2017; Posluschny 2022). Increasing the number of training sites could help address this issue, though in some regions, such as Hesse, this might not be feasible if the training dataset already includes (potentially) all known hillforts, and the number of yet-undiscovered hillforts is close to zero.

Figure 12
Differing shapes and sizes of prehistoric hillforts in Hesse (same scale, all north oriented).
3.3 Molise, central Italy
The region of Molise, in central Italy, constitutes an interesting case study for testing the transferability of the AI classifier in a Mediterranean context. The region covers a transect of the Italian territory, running from the Adriatic coast to the central Apennine Mountain range. The landscape varies, starting from the gentle hilly terrain of the coastal area and transitioning to the rugged mountainous regions of the Apennines. Consequentially, the vegetation also significantly changes, ranging from broad-leaved deciduous plants in the mountains to evergreen and deciduous species, shrublands, and Mediterranean maquis in the plains.
During the pre-Roman and Medieval periods, the region witnessed settlements in hillfort sites that varied significantly in size, typology, and location. The Ancient Hillforts Survey (AHS) recently conducted an analysis of the entire territory using LiDAR data provided by the Italian Ministry of the Environment (Ministero dell’ambiente e della tutela del territorio e del mare), leading to the identification of several hundred potential hillforts, out of which more than one hundred were subsequently validated in the field (Fontana 2022; Fontana 2024).
This new dataset represents an excellent opportunity to test the effectiveness of the AI classifier in detecting hillfort sites and compare it with traditional methods of visual interpretation. Furthermore, the field data provides a reliable means to verify whether the AI-detected anomalies correspond to actual archaeological features.
3.3.1 Verification method
The Neural Network analysis was conducted on the in-house generated DEM generated and subsequently used for interpretation by the by the AHS. The top 100 which had a confidence value above 0.94 were manually validated through a combination of AHS data and remote sensing images.
First, the vignettes were compared to the database of the AHS project. This database was created through visual interpretation of the entire area, along with the collection of legacy data from various sources, such as regional archaeological catalogues (e.g., Conta Haller 1978) and fieldwork on 145 sites (Fontana 2022; 2024). This allowed us to identify if the samples corresponded to known sites. In cases where the samples were present in the database, AHS lidar data visualized through a modified VAT visualization (Kokalj & Somrak, 2019; Fontana, 2022) were used, along with aerial and satellite imagery available on Google Earth (Google 2025) and Microsoft Bing Maps (Microsoft Bing 2025).
3.3.2 Results
Table 5 presents the classification of the top 100 detections. Fifteen of these correspond to confirmed hillforts, while the remaining 85 are categorized as different types of false positives. Figure 13 illustrates how the AI classifier successfully detected various hillfort typologies, including sites with varying sizes, numbers of fortification vallations, and locations in the landscape, such as contour or promontory hillforts.
Table 5
Classification of the top 100 detections corresponding to confidence value above 0.94.
| DETECTIONS | |
|---|---|
| True positives | 15 |
| False positives | 85 |
| DETECTIONS BY TYPE | |
| Hillforts | 15 |
| Villages | 10 |
| Field systems | 10 |
| Terrain features | 65 |
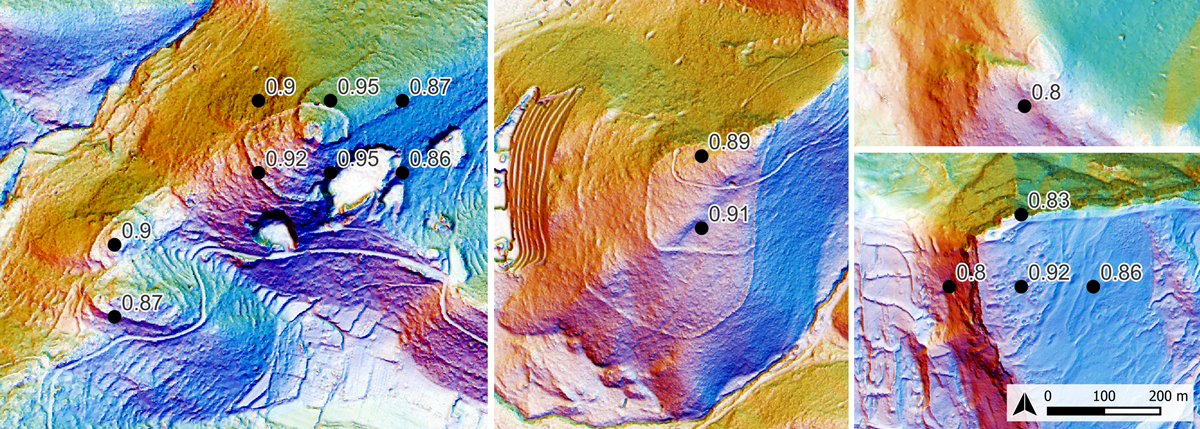
Figure 13
Examples of hillforts correctly detected by the AI classifier.
Among the false positives, ten modern villages were identified as hillforts. These villages are actually medieval sites situated on hilltops that have continued to be inhabited up to modern times. Today, they are characterized by a modern road that surrounds the summit just outside the remains of ancient fortifications. As for the cases of the false positives identified in Hesse, these detections appear as approximately circular features encircling a hill, resembling the ditch and rampart system typical of hillfort sites. A similar appearance is observed in ten other false positives, which are actually field systems. These field systems often appear as terrace walls following the contour lines around a hill, enclosing it. Terrain features were the most common among the false positives identified, likely due to the extensive mountainous areas in the Molise region. These features typically include spurs or hill summits with steep cliffs, where the steepness of the cliff demarcates the summit areas in a manner comparable to the anthropogenic features described above. These observations confirm the patterns identified in Hesse, emphasizing the importance of training the AI classifier with non-site examples that resemble these distinctive yet common natural features.
Looking at the false negatives, we can identify two main reasons why these sites were not detected, both related to the characteristic landscapes of the Mediterranean regions. First, hillforts in the region are often integrated into intricate terrace systems, which are typical features of Italian and Mediterranean areas. The density of these terraces, constructed along the orientation of pre-existing circuits, poses a challenge even for human interpreters in identifying these sites. Therefore, it is not surprising that the AI classifier encounters limitations in these areas (see Figure 14, left).
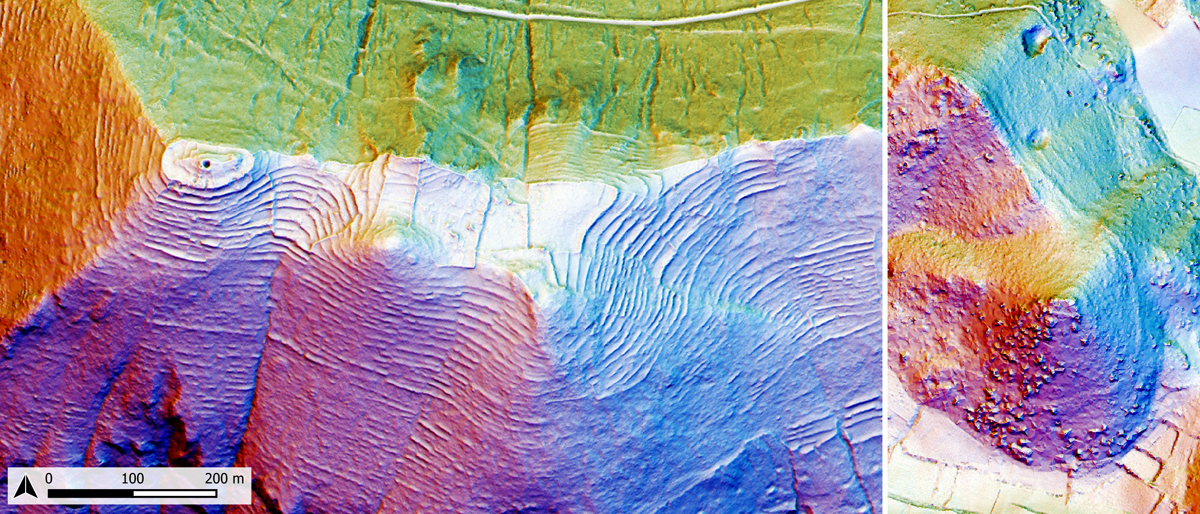
Figure 14
Examples of false negatives related to the characteristics terraced (left) and maquis landscapes of the Mediterranean (right). The black triangles indicate the fortification circuits of the hillforts.
Secondly, many areas in the Mediterranean are covered by dense maquis vegetation, which is a distinct characteristic. This vegetation can be extremely dense, making the effectiveness of standard LiDAR flights significantly lower in creating accurate models, compared to LiDAR acquisitions in temperate Europe and the British Isles. Consequently, hillfort sites often become masked by noise in the LiDAR data, complicating their interpretation (see Figure 14, right).
These two observations highlight the need to implement new training areas in the AI classifier to account for these specific landscapes that differ the most from the ones the classifier was originally trained on. Furthermore, it also underscores an intrinsic limitation of LiDAR data. While we can anticipate that the ever-increasing quality of available LiDAR data will compensate for areas with dense vegetation, such as in the case of Mediterranean maquis, the presence of hillforts and other sites in terraced landscapes remains an open issue that has yet to be extensively addressed in archaeological research (see Fontana 2024).
4 Discussion and outlook
This research contributes to automating the detection of previously unknown archaeological sites in several important ways. First, we demonstrated that AI-based workflows can be successfully applied to detect complex and irregular structures such as hillforts. Despite their varied and often intricate shapes, the AI was able to identify potential new sites with relatively good success rates, proving that even non-standard archaeological features can be detected using AI methodologies.
Second, we applied this AI workflow to three geographically and topographically diverse regions across Europe, covering a total of 180,000 km2. To our knowledge, this is the largest study area in which automatic detection has been employed in an archaeological context. In developing the software for this study, we significantly reduced the processing time required for such large-scale detection efforts, bringing it down to a few hours per region. Our case studies demonstrated that, while human verification of AI results remains necessary, high levels of automation in the post-processing phase can reduce the overall manual workload to a manageable level, even when working at a countrywide scale. By presenting domain experts with only the highest confidence AI predictions, we ensured efficient use of their expertise. In England, this led to the confirmation of one new hillfort and several additional candidates for further investigation. Similarly, Hesse yielded four promising candidates, and in Molise, AI successfully identified new sites recently discovered through visual interpretation by the AHS project, further illustrating the workflow’s potential.
Third, we demonstrated that AI models developed for one region can be effectively transferred to other landscapes. Despite significant differences between regions such as Britain, Italy, and Germany, the AI model remained capable of delivering reasonable results when transfer learning techniques were applied to address the Model Drift problem. This success highlights the flexibility of AI in archaeological research, offering the possibility of broader applications across diverse geographical areas.
However, several areas require further research and improvement. Even modest enhancements in detection quality, as reflected in metrics such as the F1 score, could lead to substantial gains in productivity during the human verification process. This would also contribute to the wider acceptance of AI-based detection methods within the archaeological community. The challenge lies in detecting rare subtypes of hillforts, such as coastal promontory forts, which are underrepresented in the training datasets. Incorporating more samples from different European regions could address this issue by enriching the AI’s ability to recognize less common features.
Additionally, optimizing the human verification step remains a priority. While the current process significantly reduces the time needed for expert validation, further improvements could increase both the speed and accuracy of confirming unknown sites. We are currently exploring several methods to enhance this stage, aiming to streamline the workflow while maintaining the high standards necessary for archaeological research.
Finally, the techniques developed for hillfort detection could be extended to other types of archaeological features. The findings from this and other automated detection projects have the potential to form the foundation of a future quality benchmark for the automated identification of archaeological sites using remote sensing data. As we continue to refine these methods and expand their application, such benchmarks could standardize the use of AI across multiple regions and feature types, paving the way for more widespread adoption of automation in archaeological discovery.
Data Accessibility Statement
The underlying LiDAR data of the three regions analysed here is available via their public LiDAR repositories. Details are given in Table 6 below. For Molise, the raw point clouds provided by the government were reprocessed for archaeological prospections following the approach explained in Fontana 2022. All DEMs used across the three regions have a 1-meter resolution.
Table 6
LiDAR data details.
| REGION | SPATIAL RESOLUTION | VERTICAL ACCURACY | INTERPOLATION | COVERAGE | DATA FORMAT | ACQUISITION PERIOD | PROVIDER | URL |
|---|---|---|---|---|---|---|---|---|
| England (UK) | 1 m | +/–15cm RMSE | bilinear | 99% | GEOTiff | 2000–2022 | Department for Environment Food & Rural Affairs (DEFRA) | https://environment.data.gov.uk/survey |
| Hesse (Germany) | 1 m | +/–10 cm | undisclosed | 100% | GEOTiff or XYZ | undisclosed | Hessische Verwaltung für Bodenmanagement und Geoinformation | https://hvbg.hessen.de/landesvermessung/geotopographie/3d-daten/digitale-gelaendemodelle |
| Molise (Italy) | 1 m | +/–15cm | undisclosed | 66% | XYZ | 2008–2015 | Ministero dell’Ambiente e della Tutela del Territorio e del Mare (MATTM) | https://gn.mase.gov.it/portale/home |
The site locations used for training in England are available to the public at https://hillforts.arch.ox.ac.uk/. The source code and the training data for Hesse and Molise may be available for research purposes upon request to the authors.
Competing Interests
The authors have no competing interests to declare.