
Table 1
Coding of Medical Severity and Help Need.
| Help Severity | Self-assessment | Medical Decision Coding | Description of Decision Criteria |
|---|---|---|---|
| Severe help needed | 7–8 | 4 | Suspicion about severe and acute event, such as a cardiac arrest. The closest emergency vehicle is sent to the scene with “blue lights”. |
| Moderate help needed | 5–6 | 3 | Suspicion about an acute event, without immediate life threatening symptoms. The closest available ambulance is assigned, but without “blue lights”. |
| Minor help needed | 3–4 | 2 | The health condition of the patient is still prioritized, but the case is not considered acute. An ambulance is sent to the scene, but with an expected delay. No “blue lights”. |
| Limited or no help needed | 1–2 | 1 | The patient may be transported to health care by other means than an ambulance (such as taxi or public transportation). No monitoring of the patient is needed during transport. |
Table 2
Descriptive Data of Emotional Clarity and Intensity Across Help Need Levels.
| Emotional Expression/Intensity | Help Need1–4 | N | Mean | SD | Lower Bound | Upper Bound | Min | Max |
|---|---|---|---|---|---|---|---|---|
| Anger | 1 | 35 | 2.60 | 3.28 | 1.47 | 3.73 | 0 | 10 |
| 2 | 25 | 1.52 | 2.63 | 0.43 | 2.61 | 0 | 7 | |
| 3 | 26 | 1.38 | 2.71 | 0.29 | 2.48 | 0 | 9 | |
| 4 | 60 | 1.72 | 2.92 | 0.96 | 2.47 | 0 | 9 | |
| Total: | 146 | 1.84 | 2.94 | 1.36 | 2.32 | 0 | 10 | |
| Sadness | 1 | 35 | 3.00 | 2.60 | 2.11 | 3.89 | 0 | 8 |
| 2 | 25 | 2.12 | 2.83 | 0.95 | 3.29 | 0 | 8 | |
| 3 | 26 | 3.00 | 3.27 | 1.68 | 4.32 | 0 | 9 | |
| 4 | 60 | 2.82 | 3.15 | 2.00 | 3.63 | 0 | 10 | |
| Total: | 146 | 2.77 | 2.98 | 2.29 | 3.26 | 0 | 10 | |
| Fear | 1 | 35 | 4.09 | 3.41 | 2.92 | 5.26 | 0 | 10 |
| 2 | 25 | 3.84 | 3.34 | 2.46 | 5.22 | 0 | 10 | |
| 3 | 26 | 3.69 | 3.08 | 2.45 | 4.94 | 0 | 9 | |
| 4 | 60 | 4.85 | 3.90 | 3.84 | 5.86 | 0 | 10 | |
| Total: | 146 | 4.29 | 3.56 | 3.71 | 4.87 | 0 | 10 | |
| Intensity | 1 | 35 | 3.94 | 2.81 | 2.98 | 4.91 | 0 | 10 |
| 2 | 25 | 4.24 | 2.47 | 3.22 | 5.26 | 0 | 9 | |
| 3 | 26 | 4.23 | 2.37 | 3.27 | 5.19 | 0 | 8 | |
| 4 | 60 | 6.60 | 2.88 | 5.86 | 7.34 | 0 | 10 | |
| Total: | 146 | 5.14 | 2.95 | 4.65 | 5.62 | 0 | 10 |
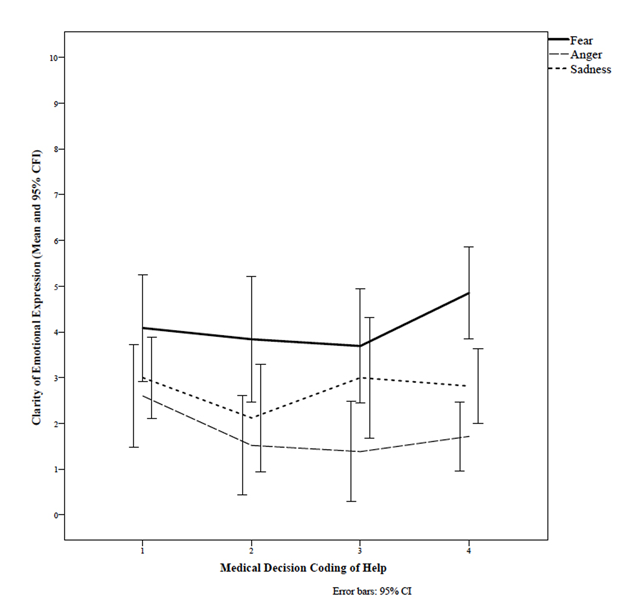
Figure 1
Clarity of Emotional Expression in Medical Decisions.
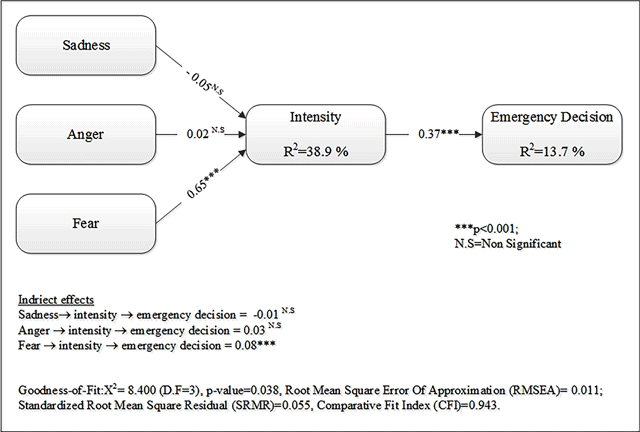
Figure 2
The Influence of Emotional Expressions and Intensity of Expression on Emergency Decisions.