
Table 1
Study periods.
| PERIOD | TIMEFRAME |
|---|---|
| Pre-Troika | January 1991–April 2011 |
| Troika | May 2011–May 2014 |
| Post-Troika/Pre-COVID | June 2014–March 2020 |
| COVID | April 2020–September 2022 |
| Post-COVID | October 2022–December 2024 |
[i] Source: Prepared by the authors.
Table 2
Description of variables.
| VARIABLES | DESCRIPTION | SOURCE |
|---|---|---|
| Period | The period is divided into five phases: pre-Troika, Troika intervention, post-Troika and pre-COVID-19, COVID-19 pandemic, and post-COVID-19. | (Correia and Pereira 2022) |
| Incoming cases (IC) | A newly filed action entering the system. | (CEPEJ 2024; Correia and Videira 2015, 2016; Correia et al. 2019; Correia et al. 2018; DGPJ 2016) |
| Resolved cases (RC) | Any action where a final decision has been defined, whether in the form of a judgment, sentence, or order, regardless of whether it has become legally binding. | |
| Pending cases (PC) | Actions that have entered the system but do not yet have a final decision. These cases are waiting for actions by the court, the parties, or others. | |
| Procedural balance | The difference between IC and RC. A positive balance means pending cases are increasing. A negative balance means pending cases are decreasing. Formula: | (CEPEJ 2024; Correia and Videira 2015, 2016; Correia et al. 2019; Correia et al. 2018; DGPJ 2016) |
| Clearance rate | The ratio of total RC to total IC. When equal to 100 percent, the number of IC equals RC, so there is no change in pending cases. When above 100 percent, the system is reducing backlog. The higher this indicator, the more backlog is being cleared. When below 100 percent, more cases are entering than being concluded, creating backlog for the following year. Formula: | |
| Disposition time | Measures, in days, how long it would take to conclude all pending cases at the end of a period, based on the work pace during that same period (the number of cases resolved). Formula: |
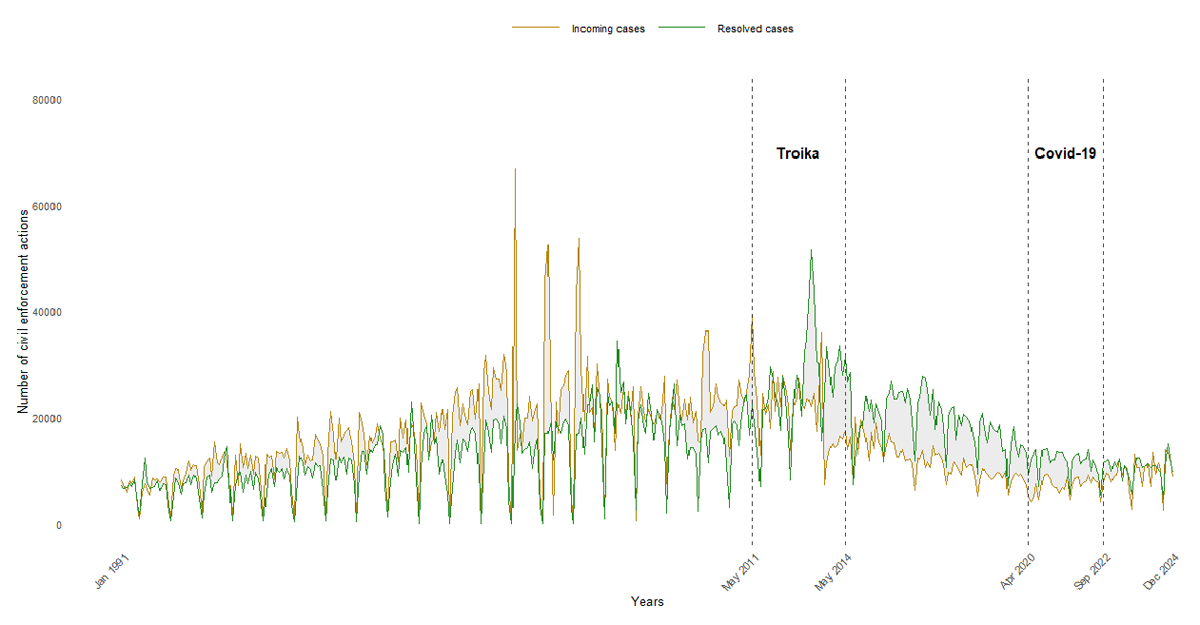
Figure 1
Incoming and resolved civil enforcement actions (1991–2024).
Source: Prepared by the authors.
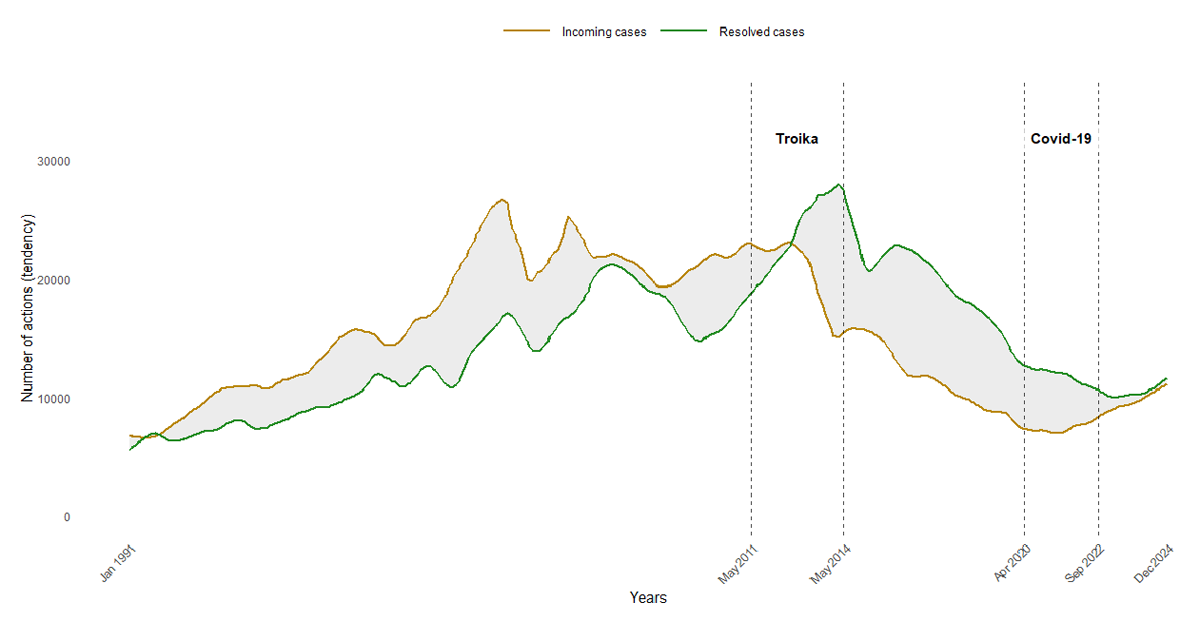
Figure 2
Incoming and resolved civil enforcement actions, adjusted according to seasonality (1991–2024).
Source: Prepared by the authors.
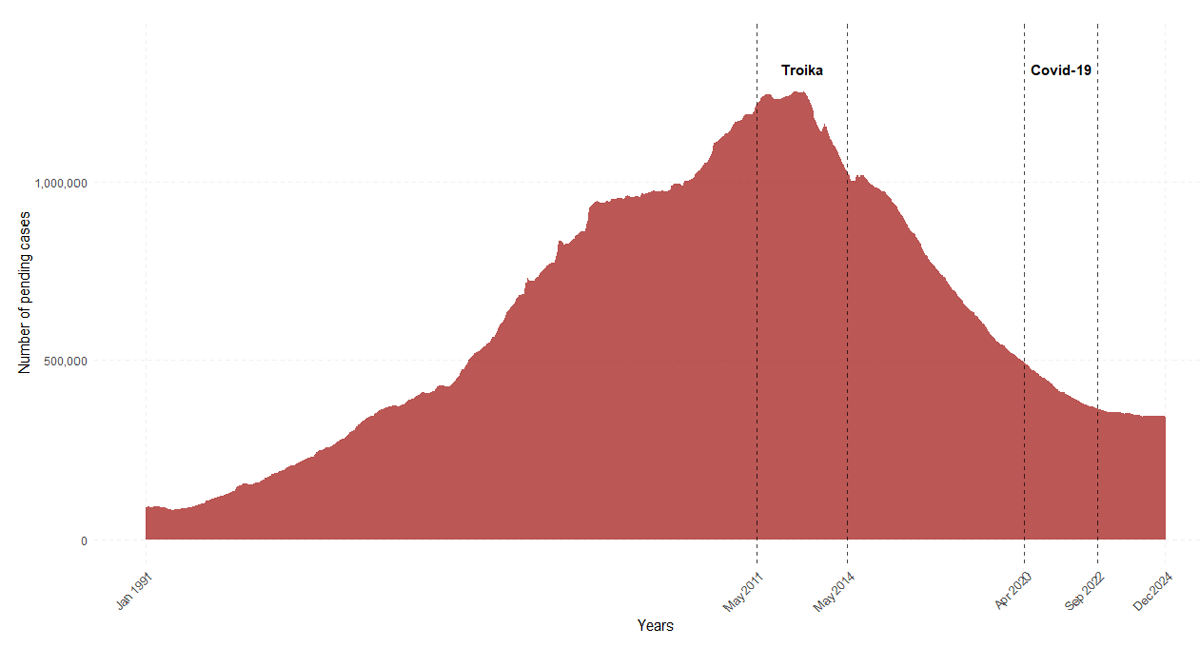
Figure 3
Pending civil enforcement actions (1991–2024).
Source: Prepared by the authors.
Table 3
Results for the Kruskal-Wallis test.
| VARIABLES | INCOMING | RESOLVED | PENDING | PROCEDURAL BALANCE | CLEARANCE RATE | DISPOSITION TIME |
|---|---|---|---|---|---|---|
| Kruskal-Wallis | 160 | 190 | 138 | 285 | 295 | 52 |
| p-value | 0,000 | 0,000 | 0,000 | 0,000 | 0,000 | 0,000 |
[i] Source: Prepared by the authors.
Table 4
Statistical similarity of medians.
| Periods | Incoming | ||
| Group 1 | Group 2 | Group 3 | |
| Pre-Troika | 17,687 | – | – |
| Troika | – | 22,382 | – |
| Post-Troika/pre-COVID-19 | – | – | 11,551 |
| COVID-19 | – | – | 7,194 |
| Post-COVID-19 | – | – | 9,520 |
| Periods | Resolved | ||
| Group 1 | Group 2 | ||
| Pre-Troika | 11,943.5 | – | |
| Troika | – | 24,386 | |
| Post-Troika/pre-COVID-19 | – | 20,655 | |
| COVID-19 | 12,007 | – | |
| Post-COVID-19 | 10,222 | – | |
| Periods | Pending | ||
| Group 1 | Group 2 | Group 3 | |
| Pre-Troika | – | – | 432,072 |
| Troika | 1,230,961 | – | – |
| Post-Troika/pre-COVID-19 | – | 758,701 | – |
| COVID-19 | – | – | 413,094 |
| Post-COVID-19 | – | – | 349,248 |
| Periods | Procedural balance | ||
| Group 1 | Group 2 | ||
| Pre-Troika | 3831 | – | |
| Troika | – | –1,737 | |
| Post-Troika/pre-COVID-19 | – | –8,214 | |
| COVID-19 | – | –5,063 | |
| Post-COVID-19 | – | –697 | |
| Periods | Clearance rate | ||
| Group 1 | Group 2 | ||
| Pre-Troika | 72 | – | |
| Troika | – | 108 | |
| Post-Troika/pre-COVID-19 | – | 180 | |
| COVID-19 | – | 172 | |
| Post-COVID-19 | – | 107 | |
| Periods | Disposition time | ||
| Group 1 | Group 2 | ||
| Pre-Troika | – | 1,107 | |
| Troika | 1,538 | – | |
| Post-Troika/pre-COVID-19 | – | 1,116 | |
| COVID-19 | – | 1,035 | |
| Post-COVID-19 | – | 1,025 | |
[i] Source: Prepared by the authors.
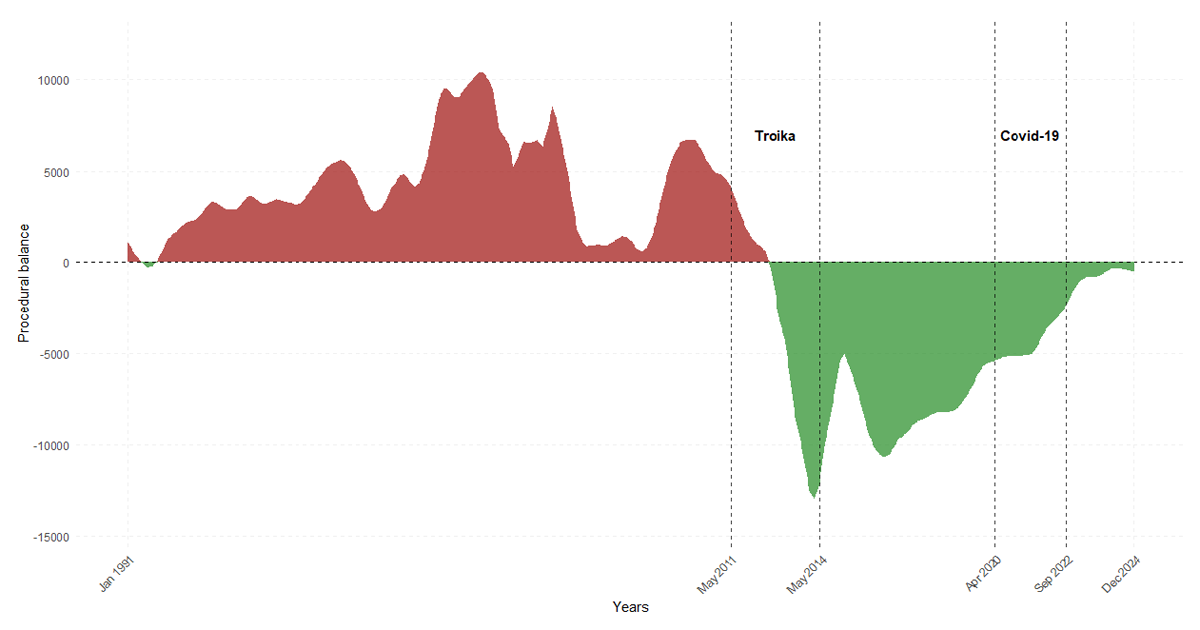
Figure 4
Procedural balance for the civil enforcement actions (1991–2024).
Source: Prepared by the authors. The negative values of procedural balance are represented in green, and the positive values of procedural balance are represented in red.
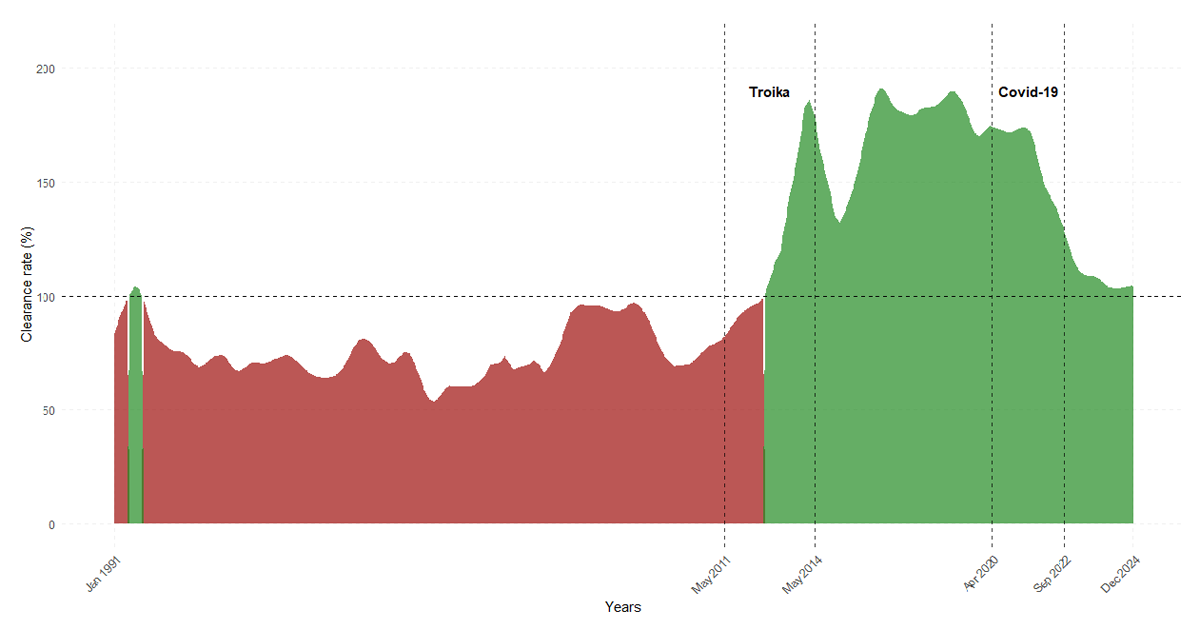
Figure 5
Civil enforcement actions clearance rate (1991–2024).
Source: Prepared by the authors. Green shading indicates a favorable clearance rate above 100%. Red shading indicates an unfavorable clearance rate below 100%.
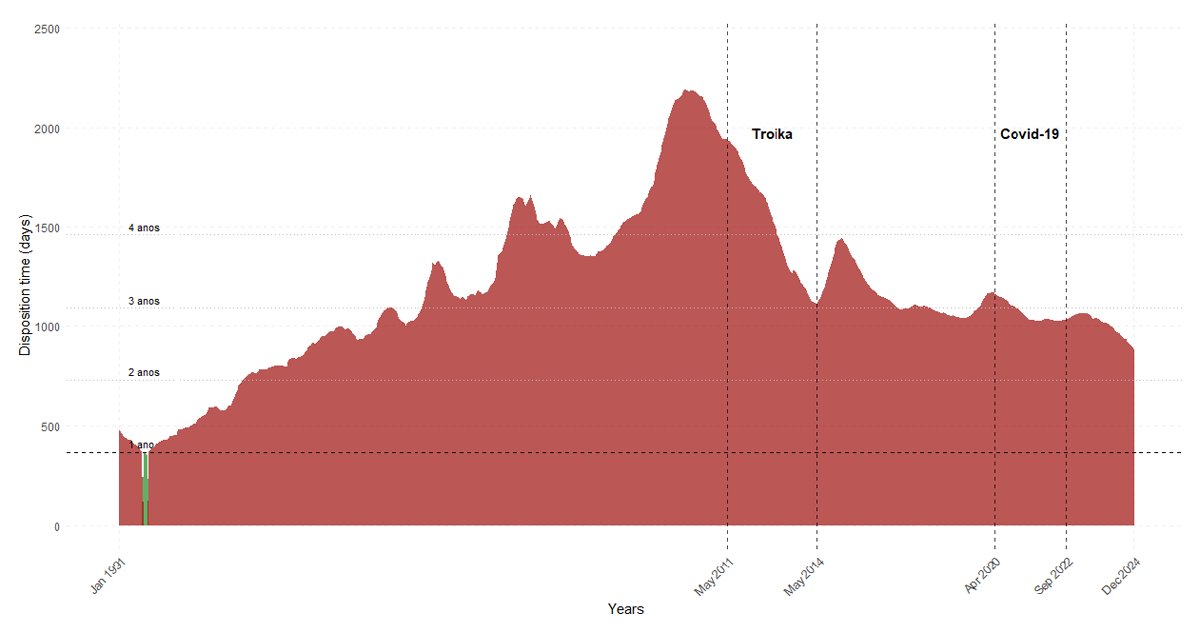
Figure 6
Civil enforcement actions disposition time (1991–2024).
Source: Prepared by the authors. Red shading indicates disposition times exceeding one year.