
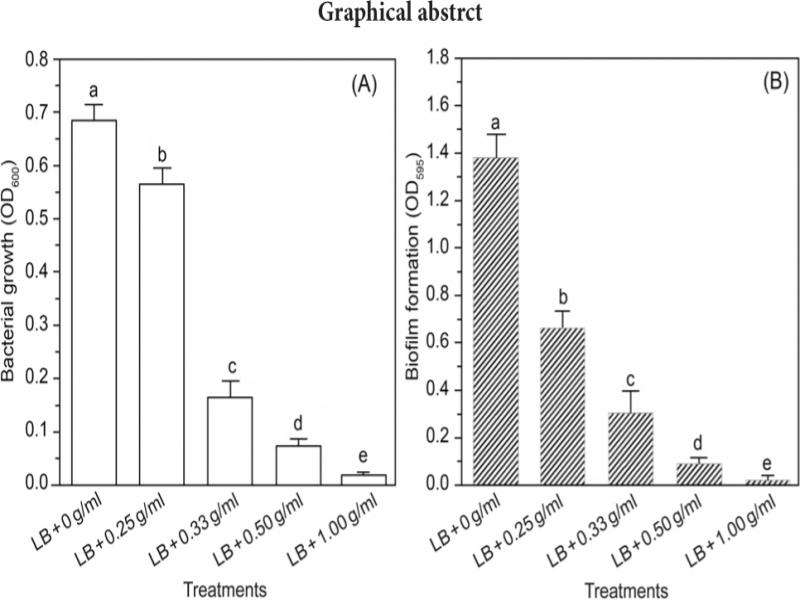
The planktonic growth (A) and biofilm formation (B) of Staphylococcus aureus can be inhibited by aqueous extracts of Melia azedarach fruits in a dose-dependent manner
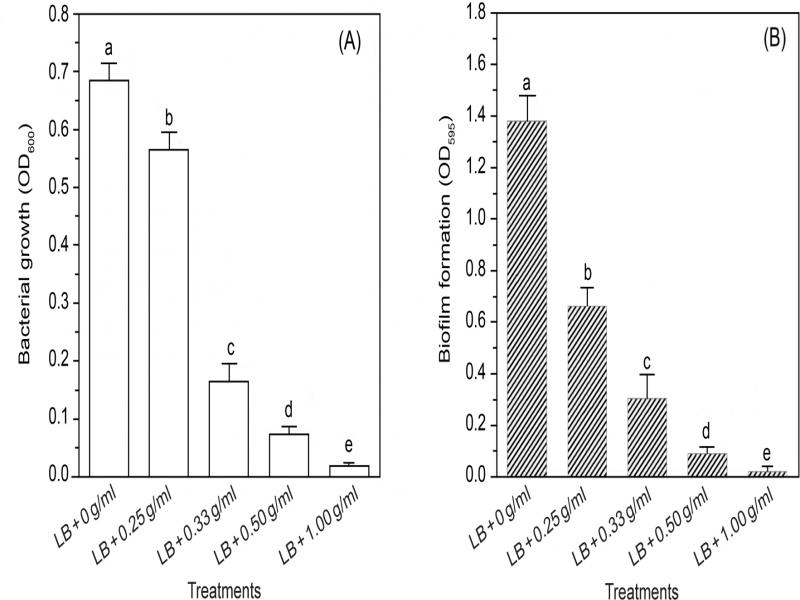
Fig. 1.
Effect of aqueous extracts of Melia azedarach fruits on planktonic growth (A) and biofilm formation (B) of Staphylococcus aureus ATCC 6538. S. aureus ATCC 6538 was cultured on LB media supplemented with different concentrations of aqueous extracts of chinaberry fruits at 37°C for 48 h. The S. aureus planktonic cells and biofilms stained with crystal violet were measured at OD600 and OD590, respectively, using a Multiskan GO plate reader.
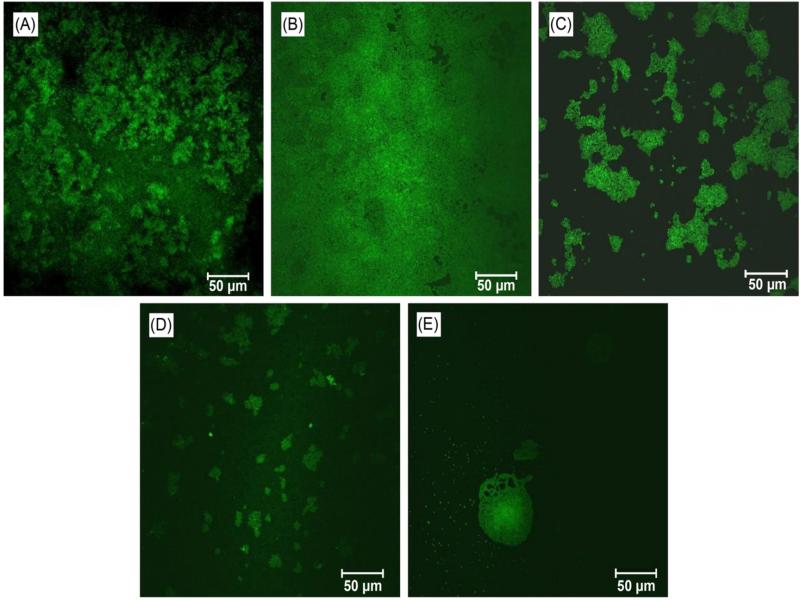
Fig. 2.
Representative CLSM images of Staphylococcus aureus ATCC 6538 biofilms grown in the presence of different concentrations of aqueous extracts of Melia azedarach fruits and stained with SYTO9. The biofilms were cultivated on the surface of glass coverslips for 48 h at 37°C. The constructed biofilms were stained with the fluorescent dye SYTO9 and then observed under a Zeiss LSM 710 CLSM. Scale bar = 50 μm. CLSM, confocal laser scanning microscopy.
Table I
Quantification of biofilm topologies in the presence of different concentrations of aqueous extracts of Melia azedarach fruits.
| Parameters | Control | 0.25 g/ml | 0.33 g/ml | 0.50 g/ml | 1.00 g/ml |
|---|---|---|---|---|---|
| Maximum thickness (μm) | 10 ± 0.00a | 10 ± 0.00a | 10 ± 0.00a | 10 ± 0.00a | 10 ± 0.00a |
| Average thickness (μm) | 7.75 ± 0.10a | 6.68 ± 0.36b | 3.37 ± 0.17c | 2.11 ± 0.19d | 1.11 ± 0.03e |
| Total biomass (μm3/μm2) | 9.81 ± 1.78a | 6.97 ± 0.08b | 2.98 ± 0.25c | 1.40 ± 0.24cd | 0.22 ± 0.02d |
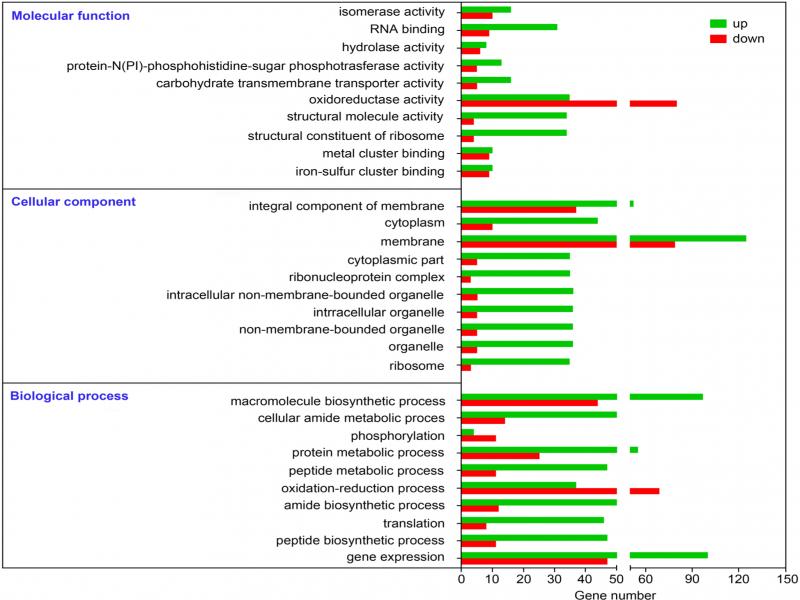
Fig. 3.
Histogram depiction of enriched Gene Ontology classification of the DEGs of Staphylococcus aureus ATCC 6538 treated with 0.25 g/ml aqueous extracts of Melia azedarach fruits. The results were categorized into three main categories of biological process, molecular function, and cellular component. The x-axis indicates the gene numbers in each subcategory. The top 10 subcategories in each main category are shown here.
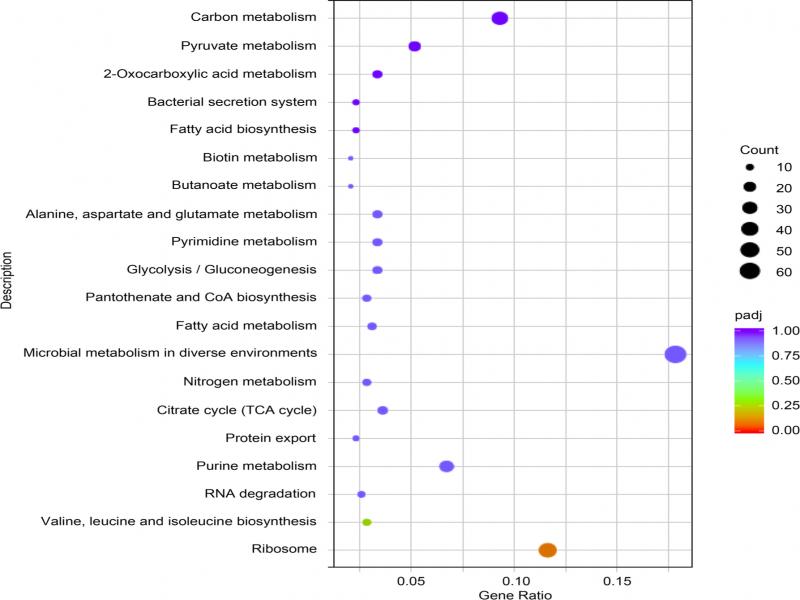
Fig. 4.
Functional analysis of DEGs of Staphylococcus aureus ATCC 6538 treated with 0.25 g/ml aqueous extracts of Melia azedarach fruits based on the KEGG pathway. Among the top 20 pathways, the first two pathways, the ribosome (pae03010) and valine, leucine, and isoleucine biosynthesis (pae00290), were significantly enriched (padj < 0.05). The right y-axis represents the KEGG pathway. The x-axis exhibits the enrichment factor, which denotes the ratio of the DEG numbers to the annotated gene numbers enriched in a specific pathway. DEG, differentially expressed genes; KEGG, Kyoto Encyclopedia of Genes and Genomes.
Table II
Identification results of the top 25 metabolites from aqueous extracts of Melia azedarach fruits in a positive mode.
| No. | Compound_ID | Name | Formula | Molecular Weight | Retention Time (min) |
|---|---|---|---|---|---|
| 1 | Com_2_pos | D-Pyrrolidine-2-Carboxylic acid | C5H9NO2 | 115.0634 | 1.382 |
| 2 | Com_3_pos | DL-Arginine | C6H14N4O2 | 174.1115 | 1.425 |
| 3 | Com_6_pos | Choline | C5H13NO | 103.0999 | 1.275 |
| 4 | Com_49_pos | L-Glutamic acid | C5H9NO4 | 147.0529 | 1.434 |
| 5 | Com_28_pos | Nicotinic acid | C6H5NO2 | 123.0321 | 1.773 |
| 6 | Com_44_pos | Perillartine | C10H15NO | 165.1152 | 7.342 |
| 7 | Com_30_pos | 6-Hydroxynicotinic acid | C6H5NO3 | 139.0268 | 1.988 |
| 8 | Com_59_pos | Maltol | C6H6O3 | 126.0318 | 5.271 |
| 9 | Com_21_pos | Isoamylamine | C5H13N | 87.10517 | 4.875 |
| 10 | Com_75_pos | 5-oxoproline | C5H7NO3 | 129.0426 | 1.45 |
| 11 | Com_71_pos | Ethyl 4-amino-2-(methylsulfanyl)-1,3-thiazole-5-carboxylate | C7H10N2O2S2 | 218.019 | 1.265 |
| 12 | Com_77_pos | DL-Tryptophan | C11H12N2O2 | 204.0897 | 6.801 |
| 13 | Com_98_pos | Ecgonine methyl ester | C10H17NO3 | 199.1206 | 8.349 |
| 14 | Com_103_pos | Scopoletin | C10H8O4 | 192.0421 | 8.708 |
| 15 | Com_105_pos | Gamma-Aminobutyric acid | C4H9NO2 | 103.0637 | 1.292 |
| 16 | Com_85_pos | Kinetin | C10H9N5O | 237.0635 | 2.048 |
| 17 | Com_104_pos | N-Acetyl-DL-serine | C5H9NO4 | 147.0529 | 1.284 |
| 18 | Com_116_pos | Pipecolinic acid | C6H11NO2 | 129.079 | 1.734 |
| 19 | Com_119_pos | 2-Methylenesuccinic acid | C5H6O4 | 130.0263 | 1.284 |
| 20 | Com_168_pos | 2-Picolinic acid | C6H5NO2 | 123.0321 | 1.523 |
| 21 | Com_165_pos | 6-O-(2-Methylbutanoyl)-α-D-glucopyranosyl α-D-glucopyranoside | C17H30O12 | 443.1997 | 8.133 |
| 22 | Com_135_pos | (+/-)12(13)-DiHOME | C18H34O4 | 296.2345 | 14.142 |
| 23 | Com_171_pos | Corylifol A | C25H26O4 | 390.1823 | 10.9 |
| 24 | Com_78_pos | Oleoyl ethylamide | C20H39NO | 309.3025 | 15.542 |
| 25 | Com_114_pos | Cytidine | C9H13N3O5 | 243.0893 | 8.013 |
Table III
Identification results of the top 25 metabolites from aqueous extracts of Melia azedarach fruits in a negative mode.
| No. | Compound_ID | Name | Formula | Molecular Weight | Retention Time (min) |
|---|---|---|---|---|---|
| 1 | Com_2_neg | D-Saccharic acid | C6H10O8 | 210.0372 | 1.174 |
| 2 | Com_6_neg | Palmitic acid | C16H32O2 | 256.2397 | 14.6 |
| 3 | Com_4_neg | Citric acid | C6H8O7 | 192.0267 | 1.214 |
| 4 | Com_11_neg | N-Acetylneuraminic acid | C11H19NO9 | 309.1055 | 1.296 |
| 5 | Com_17_neg | Elaidic acid | C18H34O2 | 282.2553 | 14.704 |
| 6 | Com_15_neg | Sucrose | C12H22O11 | 402.137 | 1.39 |
| 7 | Com_22_neg | D-(–)-Lyxose | C5H10O5 | 150.0526 | 1.268 |
| 8 | Com_21_neg | Gluconic acid | C6H12O7 | 196.058 | 1.256 |
| 9 | Com_29_neg | DL-Malic acid | C4H6O5 | 134.0214 | 1.186 |
| 10 | Com_23_neg | 4-Oxoproline | C5H7NO3 | 83.03709 | 1.293 |
| 11 | Com_31_neg | Pyruvic acid | C3H4O3 | 88.01595 | 1.186 |
| 12 | Com_25_neg | D-(–)-Fructose | C6H12O6 | 180.0632 | 1.307 |
| 13 | Com_48_neg | Glutaconic acid | C5H6O4 | 130.0265 | 1.172 |
| 14 | Com_56_neg | 2-Furoic acid | C5H4O3 | 112.016 | 1.155 |
| 15 | Com_47_neg | Toosendanin | C30H38O11 | 574.2414 | 11.083 |
| 16 | Com_57_neg | α-Eleostearic acid | C18H30O2 | 278.2241 | 14.157 |
| 17 | Com_50_neg | α-Lactose | C12H22O11 | 388.1213 | 1.373 |
| 18 | Com_71_neg | Nomilin | C28H34O9 | 514.2193 | 10.413 |
| 19 | Com_54_neg | 4-Acetamidobutanoic acid | C6H11NO3 | 145.0739 | 1.439 |
| 20 | Com_59_neg | D-(+)-Glucose | C6H12O6 | 180.0632 | 1.484 |
| 21 | Com_70_neg | 6-Sialyllactose | C23H39NO19 | 633.2127 | 1.319 |
| 22 | Com_78_neg | Purine | C5H4N4 | 120.0422 | 1.274 |
| 23 | Com_77_neg | 2-C-methyl D-erythritol 4-phosphate | C5H13O7P | 216.0399 | 1.27 |
| 24 | Com_72_neg | Azelaic acid | C9H16O4 | 188.1047 | 5.304 |
| 25 | Com_81_neg | 16-Hydroxyhexadecanoic acid | C16H32O3 | 254.2242 | 14.26 |
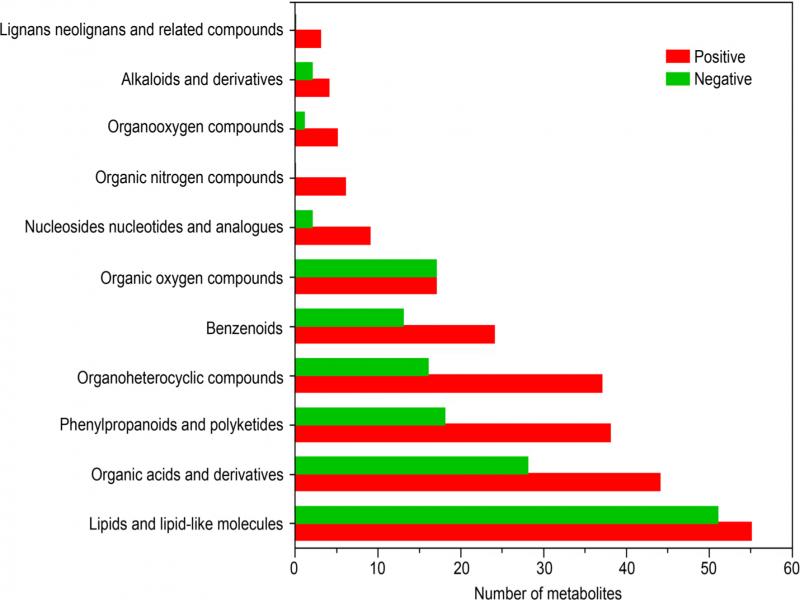
Fig. 5.
HMDB classification annotation of the components of aqueous extracts of Melia azedarach fruits in both positive and negative ion modes. The x-axis represents metabolite numbers, and the y-axis represents annotated HMDB entries.
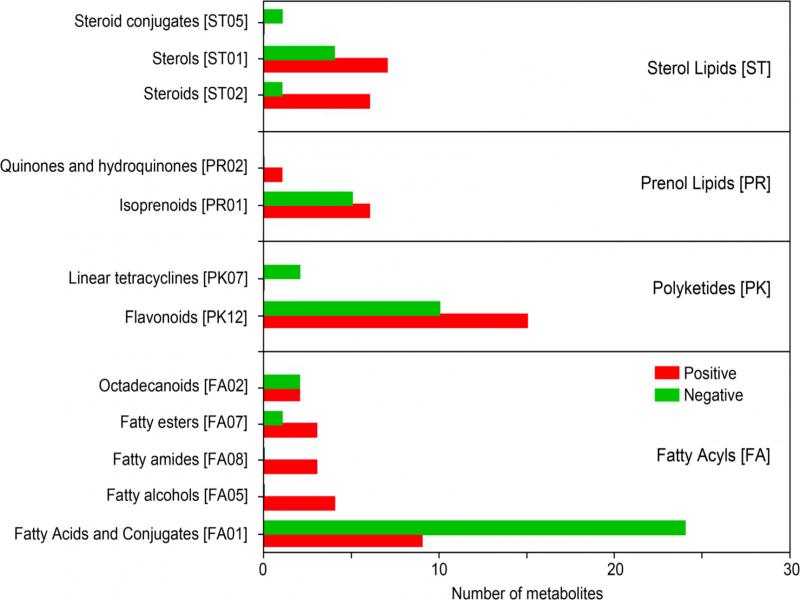
Fig. 6.
Lipidmaps classification annotation of components of aqueous extracts of Melia azedarach fruits in both positive and negative ion modes. The x-axis represents metabolite numbers, and the y-axis represents annotated Lipidmaps entries.
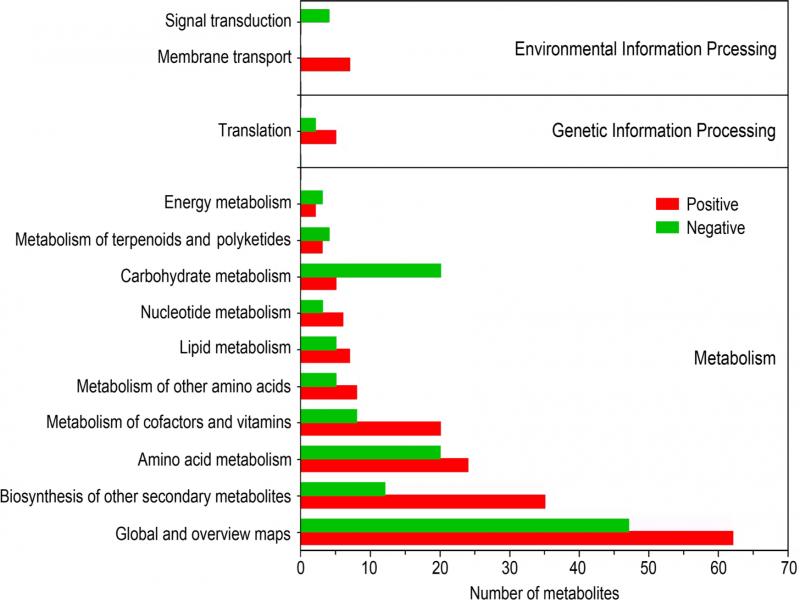
Fig. 7.
KEGG enrichment chart of the components of aqueous extraction of Melia azedarach fruits in both positive and negative ion modes. The x-axis represents metabolite numbers, and the y-axis represents enriched KEGG pathways. KEGG, Kyoto Encyclopedia of Genes and Genomes.