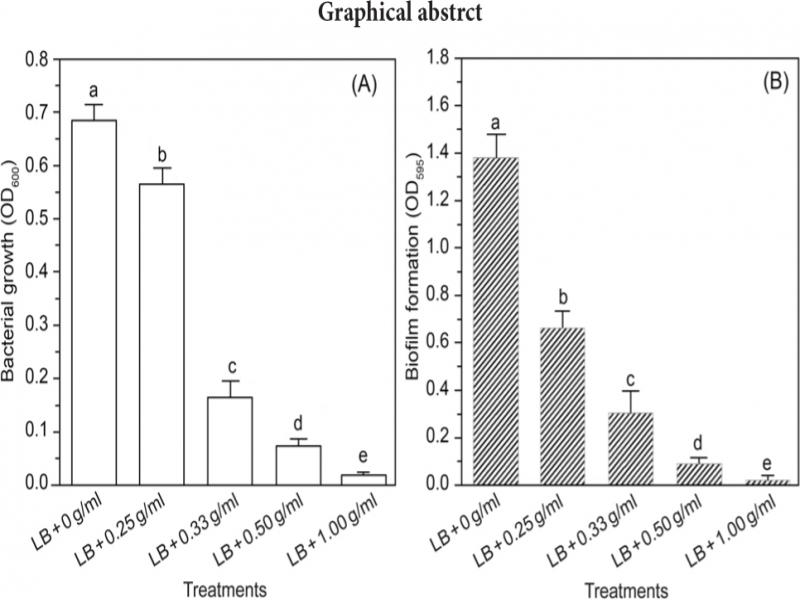
The planktonic growth (A) and biofilm formation (B) of Staphylococcus aureus can be inhibited by aqueous extracts of Melia azedarach fruits in a dose-dependent manner
Introduction
Melia azedarach (chinaberry) tolerates a wide range of adverse environmental settings so that it is commonly found in tropical, subtropical, and warm temperate areas as an ornamental plant, shade tree, and a source of fuel (Khan et al. 2011). In the past decades, various components have been extracted from chinaberry leaves, bark, fruits, and roots with different approaches. The active ingredients exhibited antimicrobial activities, which might be affected by the solvents used in the extraction and the parts of this plant that the extracts were from (Khan et al. 2011; Zahoor et al. 2015). Chinaberry leaves, roots, and bark extracted with methanol, petrol, dichloromethane, and ethyl acetate exhibited a broad spectrum of antibacterial activity, but the dichloromethane fraction of the bark was the most effective (Khan et al. 2001). A methanol extract of chinaberry flowers demonstrated potential antibacterial effects on Staphylococcus aureus when evaluated with a rabbit skin infection model (Saleem et al. 2002).
The antibacterial activities of chinaberry leaves extract in aqueous or chloroform on two Gram-positive bacteria, Bacillus subtilis and S. aureus, and three Gram-negative bacteria, Escherichia coli, Pseudomonas aeruginosa, and Klebsiella pneumoniae, were assessed using the agar well diffusion method. The extracts exhibited a relatively higher zone of inhibition at 75 μl/ml than at concentrations of 25 and 50 μl/ml, and the aqueous extracts were more effective at inhibiting the bacteria than those extracted in chloroform at the specific concentrations tested. It suggests that the leaf extracts caused inhibition in a dose-dependent manner, and the solvents used in extraction also influenced the activities (Suresh et al. 2008).
However, another study found that the alcoholic extracts of chinaberry leaves were more potent than those extracted with methanol, petroleum ether, and water when tested against eight human pathogens, including E. coli, P. aeruginosa, B. cereus, S. aureus, Fusarium oxisporum, Aspergillus niger, Rhizopus stolonifera, and Aspergillus flavus (Sen and Batra 2012). Antibacterial activities of the crude methanolic extracts of chinaberry were measured using an agar well diffusion method, but E. coli was highly resistant to the extracts at all doses tested (Zulqarnain et al. 2015). It suggests that the antibacterial activity of crude extracts of chinaberry varies with the microorganisms’ species.
In addition, the antibacterial spectrum of the same chinaberry extracts was affected by the solvents used in the extraction process. The antimicrobial, antioxidant, and cytotoxic activities of chinaberry bark extracted with various solvents were assayed. The results showed that the chloroform extract was active against both Enterobacter aerogenes and Proteus mirabilis, while both n-hexane and butanol were the most effective at inhibiting E. aerogenes. Simultaneously, aqueous and methanolic extracts were the most effective against P. mirabilis, and ethyl acetate was the most effective against P. aeruginosa (Zahoor et al. 2015).
Bacterial biofilms are complex, multi-species bacterial communities that are usually highly resistant to antimicrobial agents (Mah 2012; Zhou et al. 2015). However, chinaberry extracts have been shown to have strong antimicrobial effects against the microorganisms producing recalcitrant biofilm, including Acinetobacter guillouiae, Alcaligenes faecalis, Bacillus pumilus, Bacillus safensis, Brevundimonas alba, Microbacterium lacticum, Staphylococcus equorum, and Staphylococcus saprophyticus, which were isolated from dental plaques (Khalid et al. 2017).
In addition to their antibacterial activities, the bioactive phytochemicals were also isolated and identified from chinaberry extracts. The human pathogens Enterococcus faecalis, E. coli, P. aeruginosa and Klebsiella oxytoca were susceptible to extracts from chinaberry leaves, particularly the petroleum ether fraction that consists of secondary metabolites, such as alkaloids, terpenes/sterols, saponins, tannins and anthocyanins (Rojas Sierra et al. 2012). A variety of compounds have been found in the methanolic extracts from chinaberry, including propanedioic acid, butanedioic acid, diethyl ester, 2-pyrrolidinyl-methylamine, 2-piperidimethanamine, and trichloromethane (Al-Marzoqi et al. 2015). In addition, a substantial number of different ingredients were also isolated and identified from chinaberry by different research groups, which repeatedly demonstrated that the components of extracts varied with the extracted parts, solvents, and methodology.
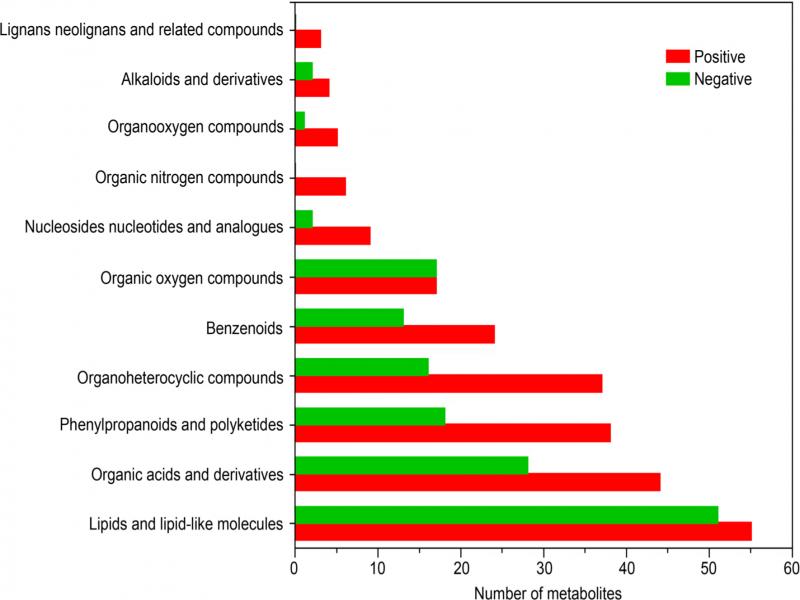
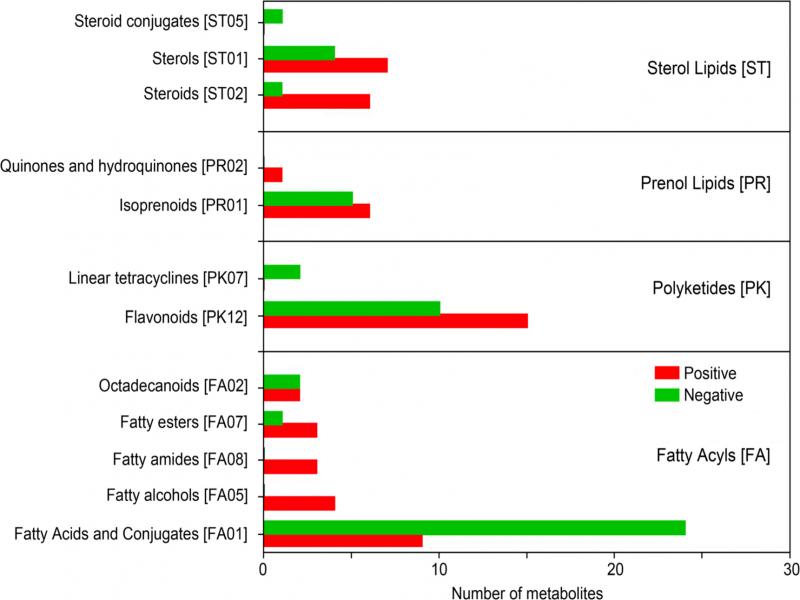
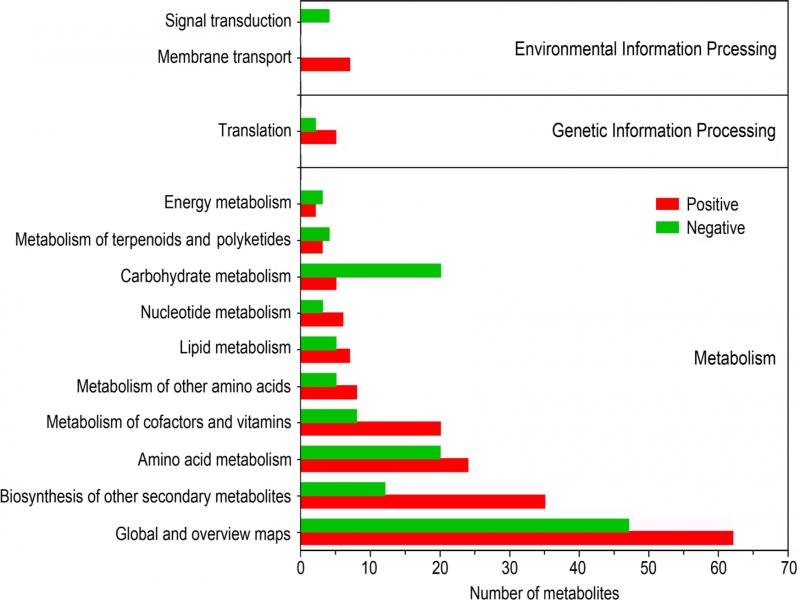
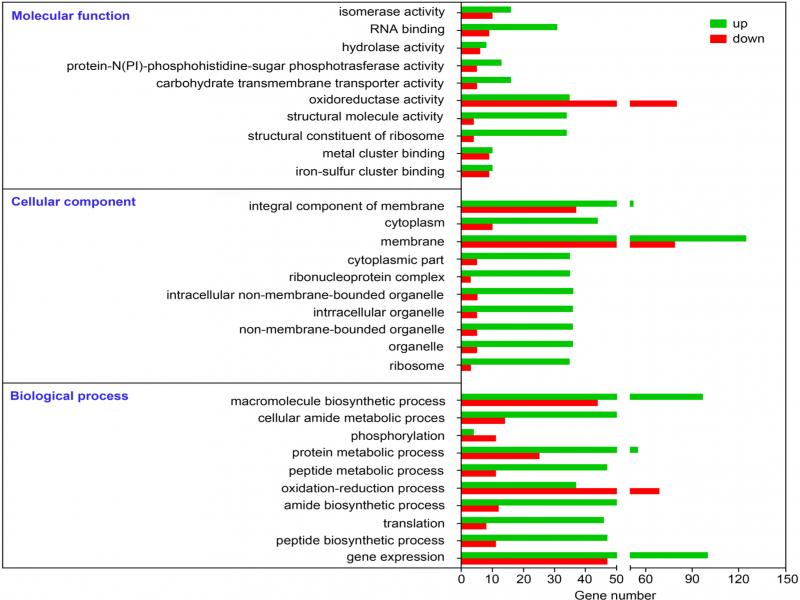
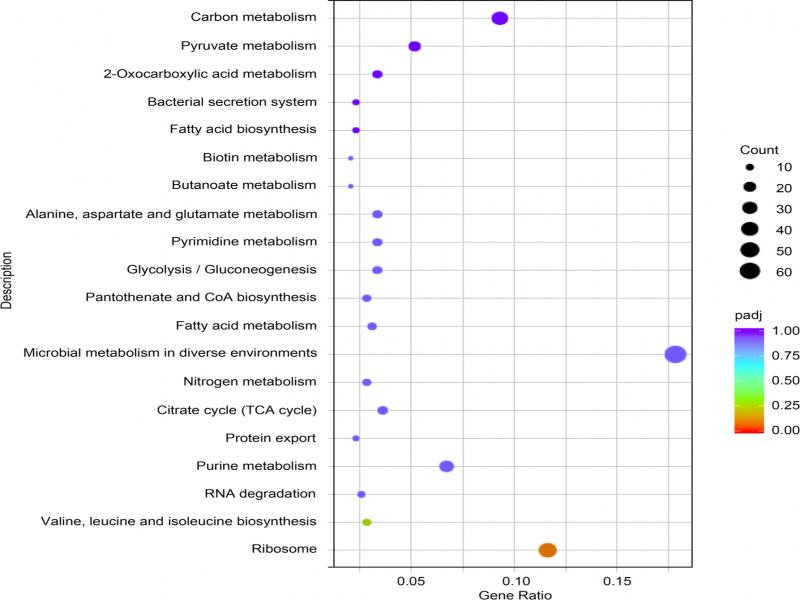
Taken together, the antimicrobial activities and bioactive agents of extracts of chinaberry have been widely studied by different laboratories. However, the underlying modes of action of these extracts on bacteria remain elusive. Thus, in this study, we tried to extract components from chinaberry fruits using simple boiling water methods, and the differentially expressed genes (DEGs) were detected with RNA-Seq using S. aureus as a model strain. The results demonstrated that various growth and metabolism-related genes and pathways were affected by the aqueous extracts of chinaberry fruits. Moreover, lipids and lipid-like molecules, organic acids, and derivatives were relatively abundant in these extracts.
Experimental
Materials and Methods
Bacterial strains and chemicals. The bacterial strain S. aureus ATCC 6538 was purchased from the American Type Culture Collection (ATCC) and was cultivated in Luria Bertani (LB) medium that consisted of 5 g/l yeast extract (Oxoid, Hampshire, England), 10 g/l NaCl (Sigma-Aldrich, St. Louis, MO, USA) and 10 g/l peptone (Oxoid) without any antibiotics at 37°C in a shaking incubator. All the chemicals used in this study were of analytical grade and supplied by Sigma-Aldrich (St. Louis, MO, USA) unless indicated otherwise.
Extractions of chinaberry fruits with water. The chinaberry fruits purchased in Sichuan (China) were first washed with pure water to remove dust, dried to a constant weight at 65°C, and then crushed into powders using a grinder (Tianchuang Powder Technology Co., Ltd., Changsha, China). An aliquot of 100 g of the ground powders was weighed and dissolved in 1,000 ml of distilled water, sonicated with an ultrasound instrument (Anpu Experimental Technology Co, Ltd., Shanghai, China) for 30 min at room temperature, heated, and boiled for 30 min, and sonicated again for another 30 min. The samples were filtered with 200-mesh gauze to obtain the crude extracts. The filter residues were subsequently added to 500 ml of distilled water, boiled for another 30 min, filtered with 200-mesh gauze, and the extracts obtained were combined with the previous extracts and centrifuged at 13,000 rpm for 10 min. The supernatants were then transferred into a new plastic tube, filtered through a 400-mesh nylon filter using a gas-liquid diaphragm vacuum pump (Huankai Microbiology Technology Co. Ltd., Guangzhou, China), and the filtered samples were re-filtered through a 0.45-μm membrane using the same vacuum pump. Finally, the samples that had been filtered twice were placed in a rotary evaporator (Ailang Instrument Co. Ltd., Shanghai, China) with a vacuum degree of –0.1 ~ –0.08 MPa to concentrate the liquid to 100 ml under reduced pressure to ensure that the final concentration of the bioactive reagents was approximately 1.00 g/ml. After sterilization at 121°C for 20 min, the concentrated extracts were stored in a refrigerator at 4°C for future use.
Semi-quantitative measurements of S. aureus biofilms. The biofilm biomass formed by S. aureus was measured using a crystal violet staining method in flat-bottomed polystyrene microtiter plates (Corning Inc., Corning, NY, USA), as previously described with minor modifications (Stepanović et al. 2000; Zhou et al. 2019). Briefly, each well of one column of a 96-well microtiter plate was inoculated with 150 μl of S. aureus suspensions with an optical density (OD600) of approximately 0.05 and 50 μl of aqueous extracts of chinaberry fruits to final concentrations of 0, 0.25, 0.33, 0.50, and 1.00 g/ml. Moreover, the negative controls contained only LB medium. The inoculated plates were then placed in a static incubator with a constant temperature at 37°C and cultured for 48 h. Before staining, the OD600 of planktonic cells was detected with a Multiskan GO plate reader (Thermo Fisher Scientific, Waltham, MA, USA). Next, the plates were gently washed three times with sterile water to remove all the planktonic cells. The biofilms formed on the inner wall of the plates were finally stained with 250 μl of crystal violet (0.1%, w/v; Shanghai Chemical Reagents Co. Ltd., Shanghai, China) for at least 30 min at room temperature. After removing the crystal violet, the stained biofilms in each well were finally dissolved in 260 μl of 95% ethanol (v/v; Shanghai Chemical Reagents Co. Ltd.), and the OD590 of each well was determined using the same Multiskan GO reader (Thermo Fisher Scientific). All the experiments were conducted with eight replicates and repeated at least three times on different days.
Confocal laser scanning microscopy (CLSM) observation of biofilm topographies. The biofilms of S. aureus that had formed on pre-sterilized glass cover slides were observed by CLSM as previously described with minor modifications (Shukla and Rao 2013; Zhou et al. 2013). Briefly, the wells of a 24-well polystyrene microtiter plate with glass coverslips inside were inoculated with 2 ml aliquots of S. aureus suspensions (final OD600 = 0.05), and different concentrations of water extracts of chinaberry fruits (final concentrations 0, 0.25, 0.33, 0.50, and 1.00 g/ml). The microtiter plates were then transferred to an incubator and incubated at static conditions at 37°C for 48 h. To assay the biomass and observe the topographies of the attached S. aureus biofilms, 5 μM of SYTO9 fluorescent dye (Invitrogen, Carlsbad, CA, USA) was used to dye the slips for 20 min in the dark, as previously reported (GrayMerod et al. 2005). Finally, the stained biofilms were visualized and photographed using a Zeiss LSM 710 (Jena, Germany), and the live bacteria encased in the biofilms were dyed fluorescent green. The CLSM images obtained under different conditions were analyzed in more detail using COMSAT 2.1 software to evaluate the biomass, maximum, and average height of the biofilms formed (Heydorn et al. 2000).
Transcriptomic sequencing (RNA-Seq) and data analyses.S. aureus was cultured statically in 96-well microtiter plates in the presence of 0.25 g/ml aqueous extracts of chinaberry fruits at 37°C. After 2 days of cultivation, the cultured planktonic cells of S. aureus were harvested from wells, the pellets were collected by centrifugation, and sent to the Guangzhou Meige Biotechnology Company (Guangzhou, China) for RNA extraction and RNA-Seq library preparation. The chinaberry fruits cultured without any water extracts were the control samples, and were simultaneously sent to the sequencing company. After cluster generation, the prepared RNA-Seq library was then sequenced on an Illumina NovaSeq platform (San Diego, CA, USA), and the paired-end reads of 150 bp were generated. Moreover, the clean data were acquired by removing low-quality reads and the reads that contained adapter and ploy-N from raw data. Differential expression analyses of the two conditions/groups were calculated using the DESeq R package (1.18.0). Moreover, the approach of Benjamini and Hochberg was used to adjust the resulting p-values to control the false discovery rate. DEGs were assigned with an adjusted value of p < 0.05 and |fold-change| > 1.5. Gene Ontology (GO) enrichment analyses of the DEGs were processed using the GOseq R package, in which the gene length bias was synchronously corrected. Moreover, GO terms with corrected p-values less than 0.05 were considered to be significantly enriched by DEGs. In addition, the KOBAS software was utilized to test the statistical enrichment of DEGs in KEGG pathways (https://www.kegg.jp/kegg/pathway.html). In addition, the clean transcriptomic sequencing data were deposited in the NCBI Sequence Read Archive (SRA) under BioProject ID PRJNA723959.
Chemical composition of the aqueous extracts from chinaberry fruits. The chemical composition of aqueous extracts from chinaberry fruits was analyzed as previously described (Liu et al. 2020; Wright Muelas et al. 2020; Grabowska et al. 2021). A Vanquish UHPLC system (Thermo Fisher Scientific) equipped with an Orbitrap Q Exactive series mass spectrometer (Thermo Fisher Scientific) was utilized to analyze the chemicals from the LC-MS/MS chinaberry fruit extracts. The treated and filtered samples were transferred into a Hypersil Gold column (100 × 2.1 mm, 1.9 μm; Thermo Fisher Scientific) operating at a column temperature of 50°C. The samples were eluted at 0.4 ml/min flow rate over 15 min with 0.1% formic acid in water (solvent A) and 0.1% formic acid in methanol (solvent B). Moreover, 5 mM ammonium acetate at pH 9.0 (solvent A) and methanol (solvent B) were used as eluents in the negative polarity mode. The solvent gradient was performed as follows: 2% B, 1.5 min; 2–100% B, 12.0 min; 100% B, 14.0 min; 100–2% B, 14.1 min; and 2% B, 17 min. The Q Exactive series mass spectrometer (Thermo Fisher Scientific) was operated in a positive or negative polarity mode with a capillary temperature of 320°C, a spray voltage of 3.2 kV, an auxiliary gas flow rate 10 arb, and a sheath gas flow rate of 35 arb. The raw data files obtained by UHPLC-MS/MS were then processed with Compound Discoverer CD3.1 software (Thermo Fisher Scientific) to align the peaks and picks and quantify each metabolite. The main parameters in the analyses were set as follows: retention time tolerance, 0.2 min; signal intensity tolerance, 30%; actual mass tolerance, 5 ppm; minimum intensity, 100,000 and signal/noise ratio, 3; respectively. Subsequently, the acquired peak intensities were then normalized to the total spectral intensity. The acquired normalized data were continuously used to predict the molecular formula based on the molecular ion peaks, additive ions, and fragment ions. Finally, the peaks were processed to match the mzVault 2.1, mzCloud (https://www.mzcloud.org/), and MassList databases to obtain accurate and relative quantitative results. Statistical analyses in this section were performed with the statistical software R (version: R-3.4.3), Python (version: 2.7.6), and CentOS (CentOS release 6.6). Furthermore, the HMDB (http://www.hmdb.ca/), LipidMaps (http://www.lipidmaps.org/), and Kyoto Encyclopedia of Genes and Genomes (KEGG) databases (http://www.genome.jp/kegg/) were utilized to conduct the annotation of all metabolites identified.
Statistical analysis. All the data obtained were expressed as the mean ± standard deviation (SD) and were then subjected to a one-way analysis of variance (ANOVA) followed by comparing multiple treatment levels with the control using the Fisher’s LSD test. Moreover, when p-value < 0.05 was considered as significant. The statistical analyses were calculated using the data processing system (DPS) software (Tang and Feng 2007).
Results
Aqueous extracts of chinaberry fruits exhibit inhibitory effects on both planktonic growth and biofilm formation of S. aureus. In this study, the active components were extracted from chinaberry fruits using a simple water boiling method. The aqueous extracts were then used to test their effects on planktonic growth and the initial S. aureus biofilm formation in a static condition in 96-well microtiter plates. As expected, the planktonic growth of S. aureus was inhibited by the aqueous extracts of chinaberry fruits in a dose-dependent manner (Fig. 1A). In the presence of 0.25, 0.33, 0.50, and 1.00 g/ml aqueous extracts, the planktonic growth of S. aureus was repressed by approximately 17.63%, 76.05%, 89.32%, and 97.27%, respectively, compared with the controls (Fig. 1A). Furthermore, the biofilm formation of S. aureus treated with the same concentrations of aqueous extracts of chinaberry fruits was assayed with the crystal violet staining method. The results demonstrated that the aqueous extracts also inhibited the biofilms of S. aureus in a dose-dependent manner (Fig. 1B), which is like the efficiencies of the inhibition of planktonic growth. When treated with 0.25, 0.33, 0.50, and 1.00 g/ml aqueous extracts, the biofilm formation of S. aureus was repressed by approximately 51.68%, 77.83%, 93.22%, and 98.30%, respectively, compared with the controls (Fig. 1B). These results revealed that aqueous extracts of chinaberry fruits can inhibit not only planktonic growth but also the S. aureus biofilm formation in a dose-dependent manner.
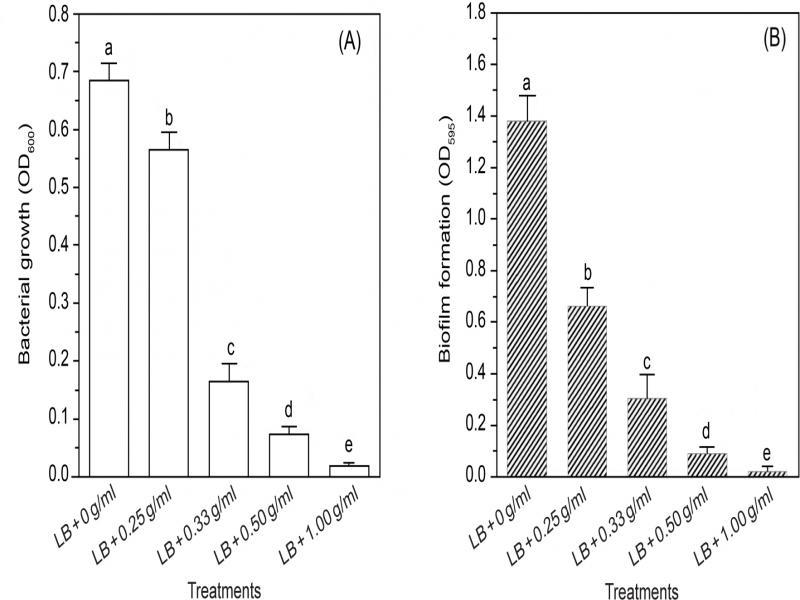
Fig. 1.
Effect of aqueous extracts of Melia azedarach fruits on planktonic growth (A) and biofilm formation (B) of Staphylococcus aureus ATCC 6538. S. aureus ATCC 6538 was cultured on LB media supplemented with different concentrations of aqueous extracts of chinaberry fruits at 37°C for 48 h. The S. aureus planktonic cells and biofilms stained with crystal violet were measured at OD600 and OD590, respectively, using a Multiskan GO plate reader.
Biofilm topographies of S. aureus can be influenced by the aqueous extracts of chinaberry fruits. As shown in Fig. 1B, since the initial biofilm of S. aureus formed on a polystyrene surface can be influenced by the aqueous extracts of chinaberry fruits, we sought to determine whether the biofilm topographies of this strain built on a glass surface could be affected by these extracts. Therefore, the initial S. aureus biofilm was first allowed to be formed on glass cover slips, and then stained with the fluorescent dye SYTO9, and finally observed under CLSM. The results demonstrated that when cultured for 2 days, a typical S. aureus biofilm could be formed on the surface of the glass slips (Fig. 2A). However, the biofilms on these slips decreased and became sparse with the increasing concentrations of the aqueous extracts (Fig. 2B-2E). Furthermore, the biofilms-related parameters were also calculated using the COMSTAT based on the images obtained from CLSM. The results showed that the average thickness and total biomass, with the exception of maximum thickness, of the formed biofilms that formed when cultured without aqueous extracts treatments were always higher than those harvested in the presence of various concentrations of aqueous extracts (Table I).
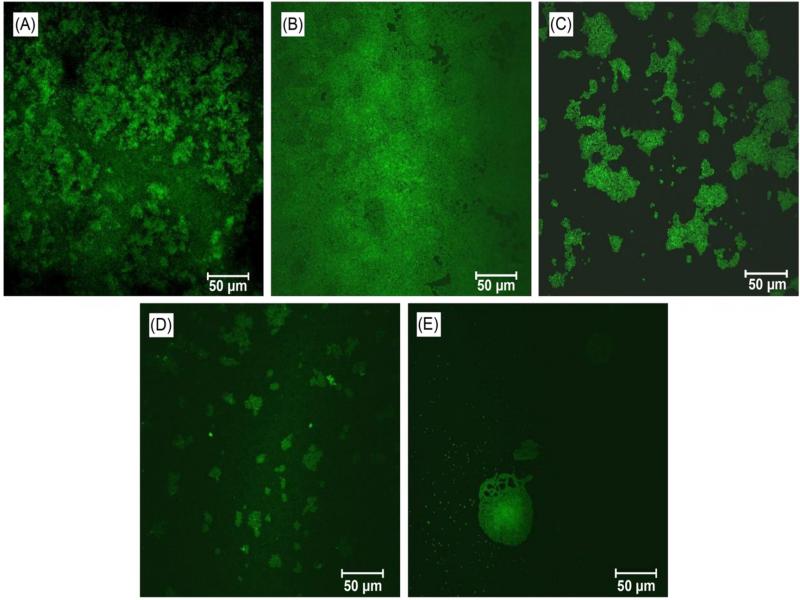
Fig. 2.
Representative CLSM images of Staphylococcus aureus ATCC 6538 biofilms grown in the presence of different concentrations of aqueous extracts of Melia azedarach fruits and stained with SYTO9. The biofilms were cultivated on the surface of glass coverslips for 48 h at 37°C. The constructed biofilms were stained with the fluorescent dye SYTO9 and then observed under a Zeiss LSM 710 CLSM. Scale bar = 50 μm. CLSM, confocal laser scanning microscopy.
Table I
Quantification of biofilm topologies in the presence of different concentrations of aqueous extracts of Melia azedarach fruits.
| Parameters | Control | 0.25 g/ml | 0.33 g/ml | 0.50 g/ml | 1.00 g/ml |
|---|---|---|---|---|---|
| Maximum thickness (μm) | 10 ± 0.00a | 10 ± 0.00a | 10 ± 0.00a | 10 ± 0.00a | 10 ± 0.00a |
| Average thickness (μm) | 7.75 ± 0.10a | 6.68 ± 0.36b | 3.37 ± 0.17c | 2.11 ± 0.19d | 1.11 ± 0.03e |
| Total biomass (μm3/μm2) | 9.81 ± 1.78a | 6.97 ± 0.08b | 2.98 ± 0.25c | 1.40 ± 0.24cd | 0.22 ± 0.02d |
| No. | Compound_ID | Name | Formula | Molecular Weight | Retention Time (min) |
|---|---|---|---|---|---|
| 1 | Com_2_pos | D-Pyrrolidine-2-Carboxylic acid | C5H9NO2 | 115.0634 | 1.382 |
| 2 | Com_3_pos | DL-Arginine | C6H14N4O2 | 174.1115 | 1.425 |
| 3 | Com_6_pos | Choline | C5H13NO | 103.0999 | 1.275 |
| 4 | Com_49_pos | L-Glutamic acid | C5H9NO4 | 147.0529 | 1.434 |
| 5 | Com_28_pos | Nicotinic acid | C6H5NO2 | 123.0321 | 1.773 |
| 6 | Com_44_pos | Perillartine | C10H15NO | 165.1152 | 7.342 |
| 7 | Com_30_pos | 6-Hydroxynicotinic acid | C6H5NO3 | 139.0268 | 1.988 |
| 8 | Com_59_pos | Maltol | C6H6O3 | 126.0318 | 5.271 |
| 9 | Com_21_pos | Isoamylamine | C5H13N | 87.10517 | 4.875 |
| 10 | Com_75_pos | 5-oxoproline | C5H7NO3 | 129.0426 | 1.45 |
| 11 | Com_71_pos | Ethyl 4-amino-2-(methylsulfanyl)-1,3-thiazole-5-carboxylate | C7H10N2O2S2 | 218.019 | 1.265 |
| 12 | Com_77_pos | DL-Tryptophan | C11H12N2O2 | 204.0897 | 6.801 |
| 13 | Com_98_pos | Ecgonine methyl ester | C10H17NO3 | 199.1206 | 8.349 |
| 14 | Com_103_pos | Scopoletin | C10H8O4 | 192.0421 | 8.708 |
| 15 | Com_105_pos | Gamma-Aminobutyric acid | C4H9NO2 | 103.0637 | 1.292 |
| 16 | Com_85_pos | Kinetin | C10H9N5O | 237.0635 | 2.048 |
| 17 | Com_104_pos | N-Acetyl-DL-serine | C5H9NO4 | 147.0529 | 1.284 |
| 18 | Com_116_pos | Pipecolinic acid | C6H11NO2 | 129.079 | 1.734 |
| 19 | Com_119_pos | 2-Methylenesuccinic acid | C5H6O4 | 130.0263 | 1.284 |
| 20 | Com_168_pos | 2-Picolinic acid | C6H5NO2 | 123.0321 | 1.523 |
| 21 | Com_165_pos | 6-O-(2-Methylbutanoyl)-α-D-glucopyranosyl α-D-glucopyranoside | C17H30O12 | 443.1997 | 8.133 |
| 22 | Com_135_pos | (+/-)12(13)-DiHOME | C18H34O4 | 296.2345 | 14.142 |
| 23 | Com_171_pos | Corylifol A | C25H26O4 | 390.1823 | 10.9 |
| 24 | Com_78_pos | Oleoyl ethylamide | C20H39NO | 309.3025 | 15.542 |
| 25 | Com_114_pos | Cytidine | C9H13N3O5 | 243.0893 | 8.013 |
| No. | Compound_ID | Name | Formula | Molecular Weight | Retention Time (min) |
|---|---|---|---|---|---|
| 1 | Com_2_neg | D-Saccharic acid | C6H10O8 | 210.0372 | 1.174 |
| 2 | Com_6_neg | Palmitic acid | C16H32O2 | 256.2397 | 14.6 |
| 3 | Com_4_neg | Citric acid | C6H8O7 | 192.0267 | 1.214 |
| 4 | Com_11_neg | N-Acetylneuraminic acid | C11H19NO9 | 309.1055 | 1.296 |
| 5 | Com_17_neg | Elaidic acid | C18H34O2 | 282.2553 | 14.704 |
| 6 | Com_15_neg | Sucrose | C12H22O11 | 402.137 | 1.39 |
| 7 | Com_22_neg | D-(–)-Lyxose | C5H10O5 | 150.0526 | 1.268 |
| 8 | Com_21_neg | Gluconic acid | C6H12O7 | 196.058 | 1.256 |
| 9 | Com_29_neg | DL-Malic acid | C4H6O5 | 134.0214 | 1.186 |
| 10 | Com_23_neg | 4-Oxoproline | C5H7NO3 | 83.03709 | 1.293 |
| 11 | Com_31_neg | Pyruvic acid | C3H4O3 | 88.01595 | 1.186 |
| 12 | Com_25_neg | D-(–)-Fructose | C6H12O6 | 180.0632 | 1.307 |
| 13 | Com_48_neg | Glutaconic acid | C5H6O4 | 130.0265 | 1.172 |
| 14 | Com_56_neg | 2-Furoic acid | C5H4O3 | 112.016 | 1.155 |
| 15 | Com_47_neg | Toosendanin | C30H38O11 | 574.2414 | 11.083 |
| 16 | Com_57_neg | α-Eleostearic acid | C18H30O2 | 278.2241 | 14.157 |
| 17 | Com_50_neg | α-Lactose | C12H22O11 | 388.1213 | 1.373 |
| 18 | Com_71_neg | Nomilin | C28H34O9 | 514.2193 | 10.413 |
| 19 | Com_54_neg | 4-Acetamidobutanoic acid | C6H11NO3 | 145.0739 | 1.439 |
| 20 | Com_59_neg | D-(+)-Glucose | C6H12O6 | 180.0632 | 1.484 |
| 21 | Com_70_neg | 6-Sialyllactose | C23H39NO19 | 633.2127 | 1.319 |
| 22 | Com_78_neg | Purine | C5H4N4 | 120.0422 | 1.274 |
| 23 | Com_77_neg | 2-C-methyl D-erythritol 4-phosphate | C5H13O7P | 216.0399 | 1.27 |
| 24 | Com_72_neg | Azelaic acid | C9H16O4 | 188.1047 | 5.304 |
| 25 | Com_81_neg | 16-Hydroxyhexadecanoic acid | C16H32O3 | 254.2242 | 14.26 |