
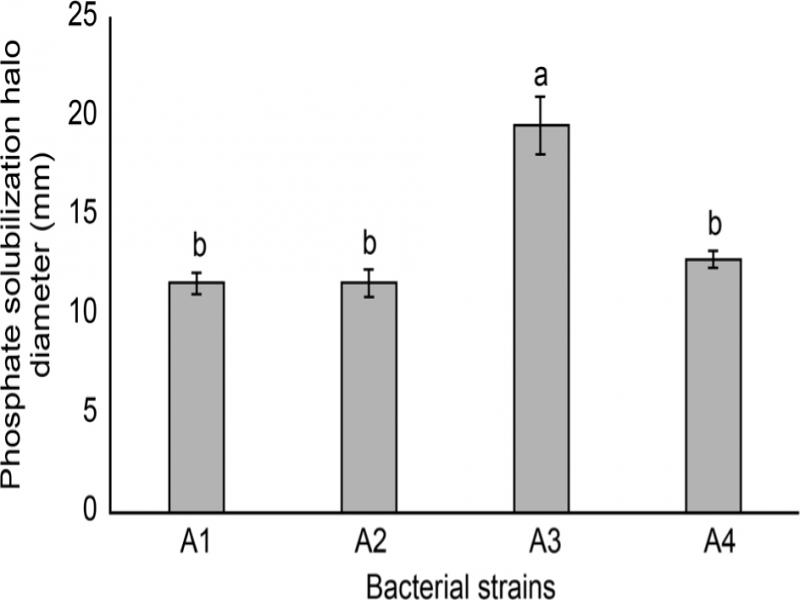
Fig. 1.
Phosphate solubilization assay, measured by halo formation by four bacterial strains cultured on PVK agar. The lines above each bar indicate standard deviation. The different letters above the bars denote statistical differences (LSD test (p < 0.001)).
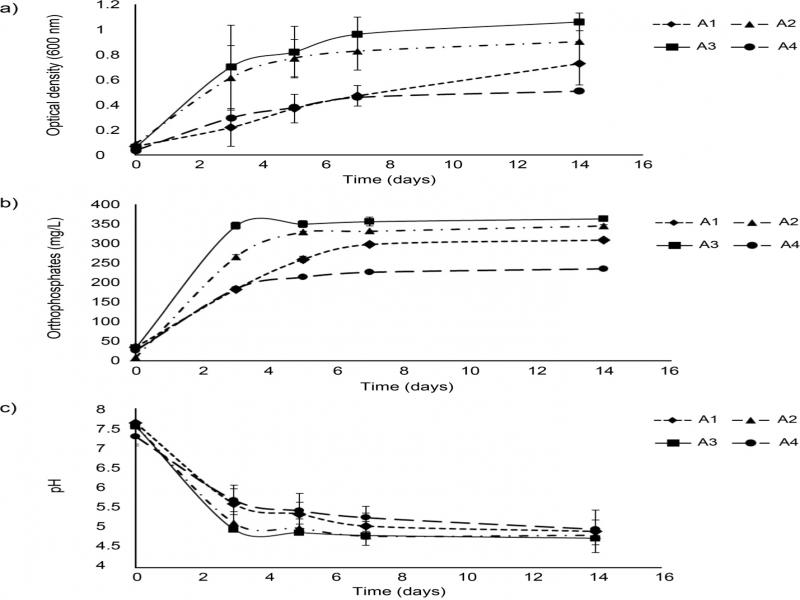
Fig. 2.
Kinetics of the bacterial growth on PVK liquid medium.
a) the bacterial growth measured as optical density at a wavelength of 600 nm, b) the orthophosphates released measured with molybdenum blue method, and c) the acidification evidence (lower pH values) in PVK liquid medium. The lines shown above or below each point indicate the standard deviation.
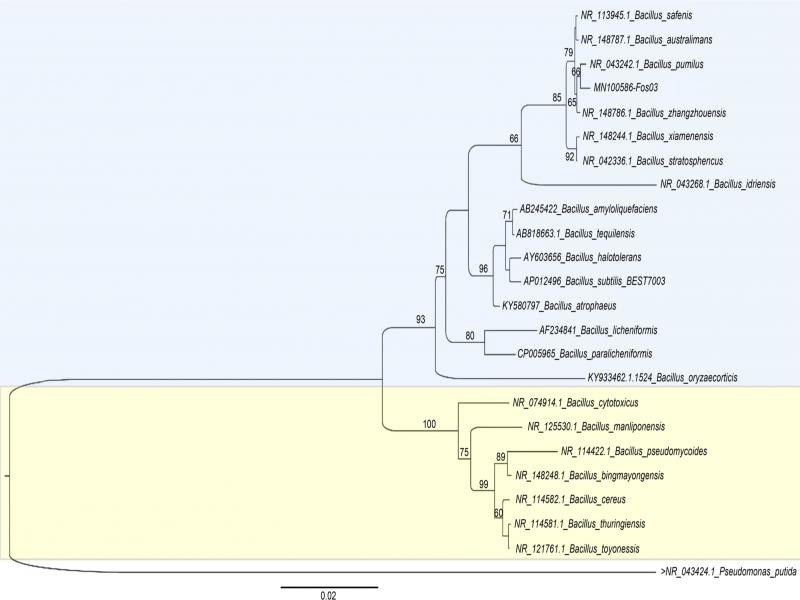
Fig. 3.
Phylogenetic tree of A3 bacterial strain identified by 16 S rDNA molecular analysis.
Table I
Growth evaluation of potato microplants cv. Citlali with different P sources and sucrose concentrations.
| Variable | |||||
|---|---|---|---|---|---|
| Phosphate (A) | Sucrose g/l (B) | Interaction | |||
| KH2PO4 (T0, T1) | Ca3(PO4)2 (T4, T5) | 10 (T1, T5) | 30 (T0, T4) | AB | |
| 1* | 6.081 ± 0.154¤b | 6.801 ± 0.155a | 6.122 ± 0.153b | 6.760 ± 0.156a | No |
| 2 | 15.099 ± 0.640NS | 16.180 ± 0.636NS | 14.335 ± 0.632b | 16.944 ± 0.644a | No |
| 3 | 0.279 ± 0.093NS | 0.334 ± 0.094NS | 0.240 ± 0.0195b | 0.373 ± 0.0198a | Present |
1 *1 – Stem length (cm), 2 – Root length (cm), and 3 – Fresh weight (g); data are expressed as means ± standard deviation. The different letters between variables A and B indicate significant differences according to the Tukey test p < 0.05 (2-way ANOVA); NS – not significant at p < 0.05; KH2PO4 – potassium phosphate; Ca3(PO4)2 – tricalcium phosphate; T0 – KH2PO4 and sucrose 30 g/l; T1 – KH2PO4, sucrose 10 g/l; T4 – Ca3(PO4)2, sucrose 30 g/l; T5 – Ca3(PO4)2 sucrose 10 g/l
Table II
Potato microplants (Solanum tuberosum L.) cv. Citlali grown for 28 ± 2 d in vitro in presence/absence of PSB strain A3.
| Treatments | Stem length (cm) | Root length (cm) | Fresh weight (g) |
|---|---|---|---|
| Bacterial strain A3 added | 10.043 ± 3.252* | 2.943 ± 1.634* | 0.573 ± 0.296* |
| Without added bacterial strain A3 | 5.6 ± 2.026 | 4.297 ± 3.136 | 0.174 ± 0.161 |
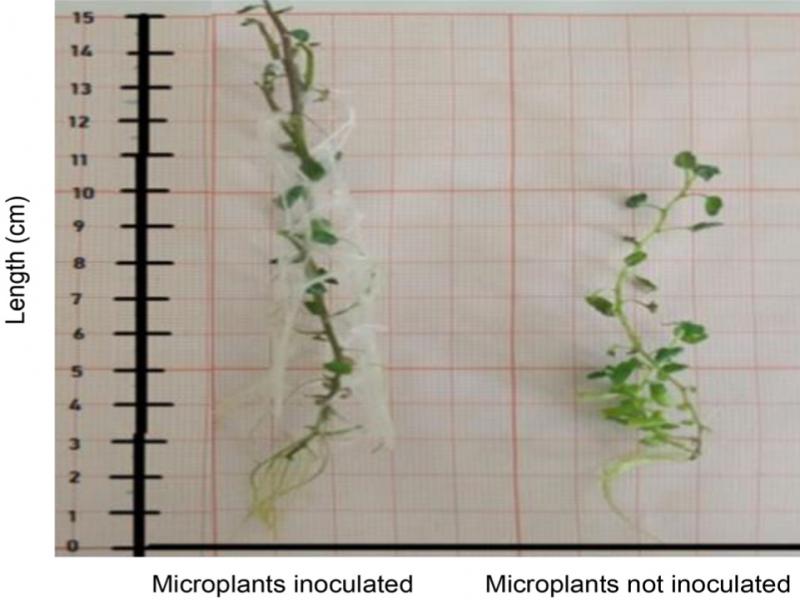
Fig. 4.
Development of adventitious roots in potato microplants (Solanum tuberosum L.) cv. Citlali, inoculated with PSB strain A3 and cultured for 28 d ± 2 d.