
Table I
Groups of experimental animals.
| Group | Number | Experimental treatments | |
|---|---|---|---|
| Oral administration | Intraperitoneal injection | ||
| NC | 10 | Normal saline (0.85%, 20 ml/kg BW) | Normal saline (0.85%, 20 ml/kg BW) |
| MC | 10 | Normal saline (0.85%, 20 ml/kg BW) | D-galactose (30 g/l, 200 mg/kg BW) |
| PC | 10 | Vitamin C (30 g/l, 200 mg/kg BW) | D-galactose (30 g/l, 200 mg/kg BW) |
| LD | 10 | L. fermentum JX306 (108 CFU/day) | D-galactose (30 g/l, 200 mg/kg BW) |
| MD | 10 | L. fermentum JX306 (109 CFU/day) | D-galactose (30 g/l, 200 mg/kg BW) |
| HD | 10 | L. fermentum JX306 (1010 CFU/day) | D-galactose (30 g/l, 200 mg/kg BW) |
Table II
The selected LAB strains with high antioxidant activity.
| Strains | DPPH scavenging rate (%) | Hydrogen radicals scavenging rate (%) | Inhibition rate of lipid peroxidation (%) |
|---|---|---|---|
| L. fermentum JX306 | 37.29 ± 1.75 a | 37.90 ± 0.29 a | 28.14 ± 2.97 a |
| L. fermentum GZ394 | 34.92 ± 3.57 a | 35.02 ± 1.70 b | 23.89 ± 1.60 b |
| L. plantarum SC34 | 23.09 ± 4.00 c | 34.50 ± 1.44 b | 12.69 ± 0.23 d |
| L. plantarum GZ328 | 27.83 ± 2.25 b | 29.21 ± 1.60 c | 20.85 ± 2.07 bc |
| Pediococcus pentosaceus GZ430 | 16.22 ± 0.89 d | 23.32 ± 1.62 d | 18.01 ± 2.09 c |
| Leuconostoc mesenteroides YN295 | 15.26 ± 0.67 d | 34.31 ± 1.18 b | 14.43 ± 1.29 d |
Table III
The survival rate (%) of LAB in simulated bile, gastric fluid, and intestinal fluid.
| Strains | Simulated bile | Simulated gastric fluid | Simulated intestinal fluid |
|---|---|---|---|
| L. fermentum JX306 | 78.28 ± 0.18 a | 53.05 ± 1.75 a | 42.07 ± 6.52 a |
| L. fermentum GZ394 | 74.61 ± 4.67 a | 30.57 ± 3.68 b | 27.26 ± 4.95 b |
| L. plantarum SC34 | 65.09 ± 6.33 b | 5.34 ± 1.92 c | 12.23 ± 1.85 e |
| L. splantarum GZ328 | 74.48 ± 1.79 a | 1.51 ± 0.22 e | 9.75 ± 0.45 f |
| Pediococcus pentosaceus GZ430 | 22.99 ± 3.12 d | 3.62 ± 1.11 d | 15.26 ± 2.34 d |
| Leuconostoc mesenteroides YN295 | 33.89 ± 0.96 c | 5.34 ± 0.79 c | 17.28 ± 0.56 c |
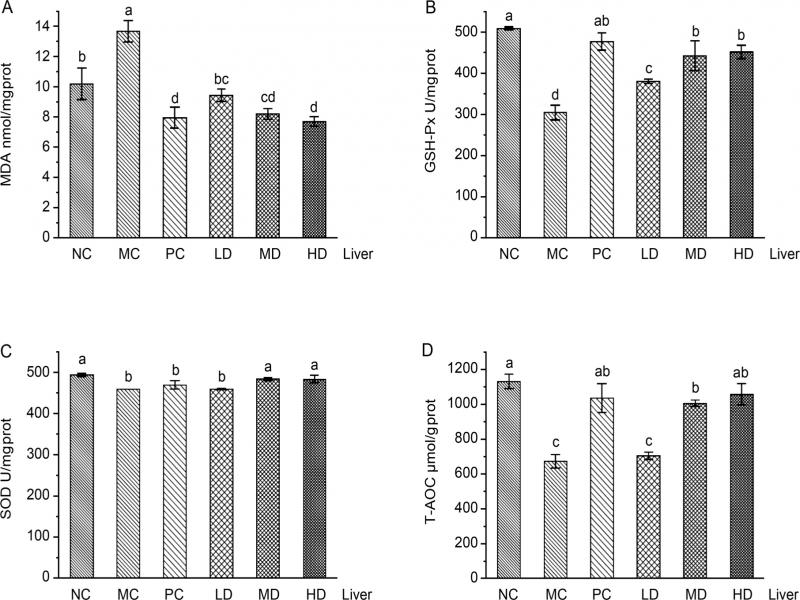
Fig. 1.
Effect of L. fermentum JX306 on GSH-Px, SOD, T-AOC activities, and MDA concentration in the liver of mice with oxidative stress induced by D-galactose. (A) MDA; (B) GSH-Px; (C) SOD; (D) T-AOC. All data are presented as mean ± SD (n = 3). Bars with different letters were significantly different (p < 0.05).
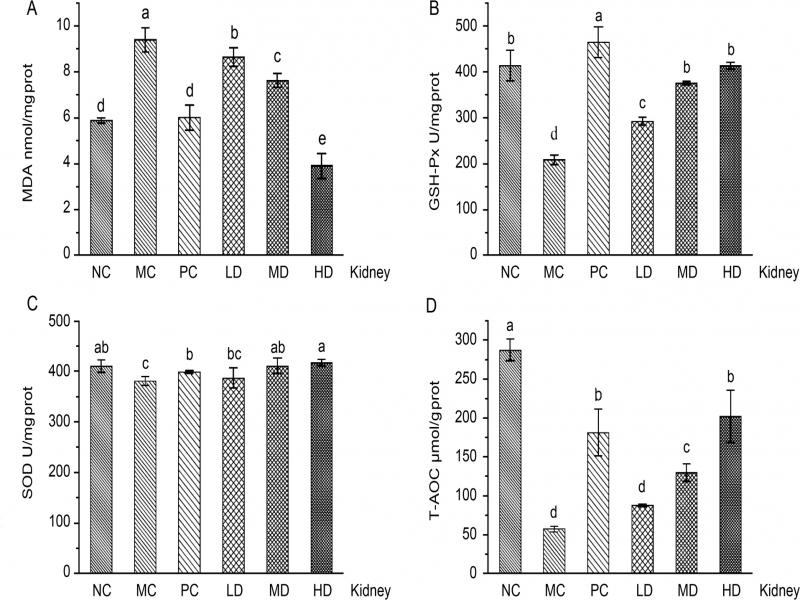
Fig. 2.
Effect of L. fermentum JX306 on GSH-Px, SOD, T-AOC activities, and MDA concentration in the kidney of mice with oxidative stress induced by D-galactose. (A) MDA; (B) GSH-Px; (C) SOD; (D) T-AOC. All data are presented as mean ± SD (n = 3). Bars with different letters were significantly different (p < 0.05).
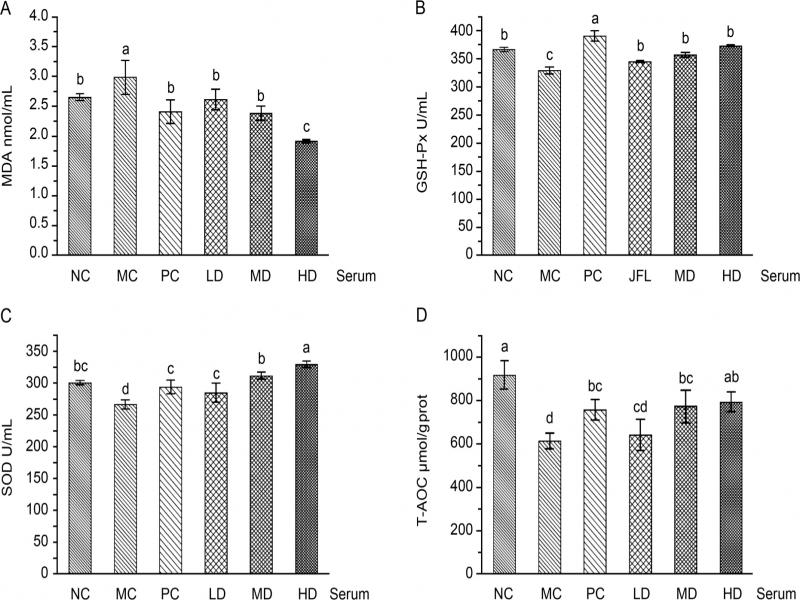
Fig. 3.
Effect of L. fermentum JX306 on GSH-Px, SOD, T-AOC activities and MDA concentration in the serum of mice with oxidative stress induced by D-galactose. (A) MDA; (B) GSH-Px; (C) SOD; (D) T-AOC. All data are presented as mean ± SD (n = 3). Bars with different letters were significantly different (p < 0.05).
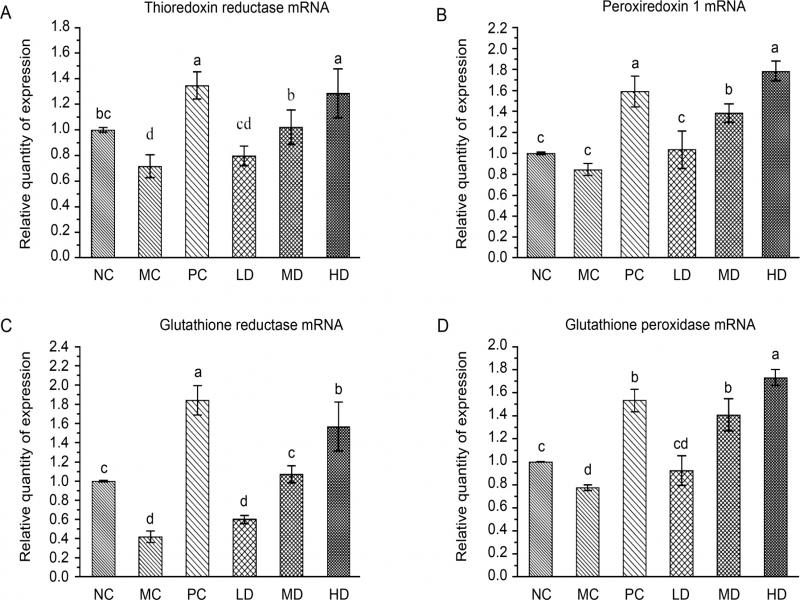
Fig. 4.
Effect of L. fermentum JX306 on the expression of the genes encoding for peroxiredoxin-1 (Prdx1), glutathione peroxidase (Gsr), glutathione peroxidase (Gpx), and thioredoxin reductase (TR3) in the liver of D-galactose induced aging mice. (A) Thioredoxin reductase mRNA; (B) Peroxiredoxin1 mRNA; (C) Glutathione reductase mRNA; (D) Glutathione peroxidase mRNA. All data are presented as mean ± SD (n = 3). Bars with different letters were significantly different (p < 0.05).
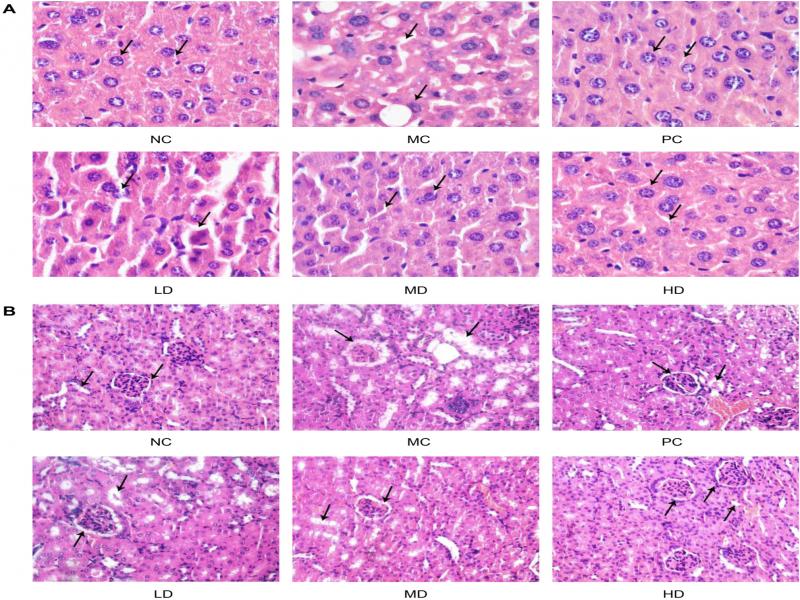
Fig. 5.
Effects of L. fermentum JX306 treatment on organic damages in the liver (A), and the kidney (B) of D-galactose induced aging mice.