
Table 1.
Reference Model Parameters Used in the Analytical Framework.
| Parameter | Symbol | Value | Unit | Source / Note |
|---|---|---|---|---|
| Air density (sea-level reference) | ρ | 1.225 | kg m-3 | ISA reference (adjusted in simulations) |
| Wing area | S | 1.2 | m2 | Typical micro-UAV configuration |
| Zero-lift drag coefficient | CD0 | 0.025 | — | UAV aerodynamic literature |
| Induced drag factor | k | 0.045 | — | Empirical aerodynamic constant |
| Propeller efficiency | ηprop | 0.85 | — | Assumed constant (conceptual level) |
| Fuel-cell efficiency | ηfc | 0.60 | — | Typical PEM system |
| Motor efficiency | ηem | 0.90 | — | BLDC motor |
| Battery energy density | ρbatt | 230 | Wh kg-1 | Commercial Li-ion cells |
| Hydrogen lower heating value | LHVH2 | 120 × 106 | J kg-1 | ISO standard |
| Structural mass (reference literature scaling value) | mstruct | 10 | kg | Representative UAV sizing |
| Payload mass (reference literature scaling value) | mpayload | 2 | kg | Generic sensor payload |
Table 2.
Baseline UAV Mass Breakdown Used in the Parametric Study.
| Component | Symbol | Value (kg) | Notes |
|---|---|---|---|
| Structural mass | mstruct | 0.85 | Wing, fuselage, empennage |
| Payload | mpayload | 0.10 | Small camera or sensor |
| Fuel-cell stack | ηfc | 0.18 | 150–200 W PEM system |
| Hydrogen tank | mtank | 0.25 | Type-IV,700 bar (≈5:1 tank:H2) |
| Hydrogen mass | mH2 | 0.05 | ≈6 wt% of tank assembly |
| Battery pack | mbatt | 0.20 | Peak-power support |
| Avionics + ESC | melec | 0.07 | Flight control and wiring |
| Electric motor | mmotor | 0.12 | BLDC motor |
| Total mass | mtotal | 1.82 | Used in analytical calculations |
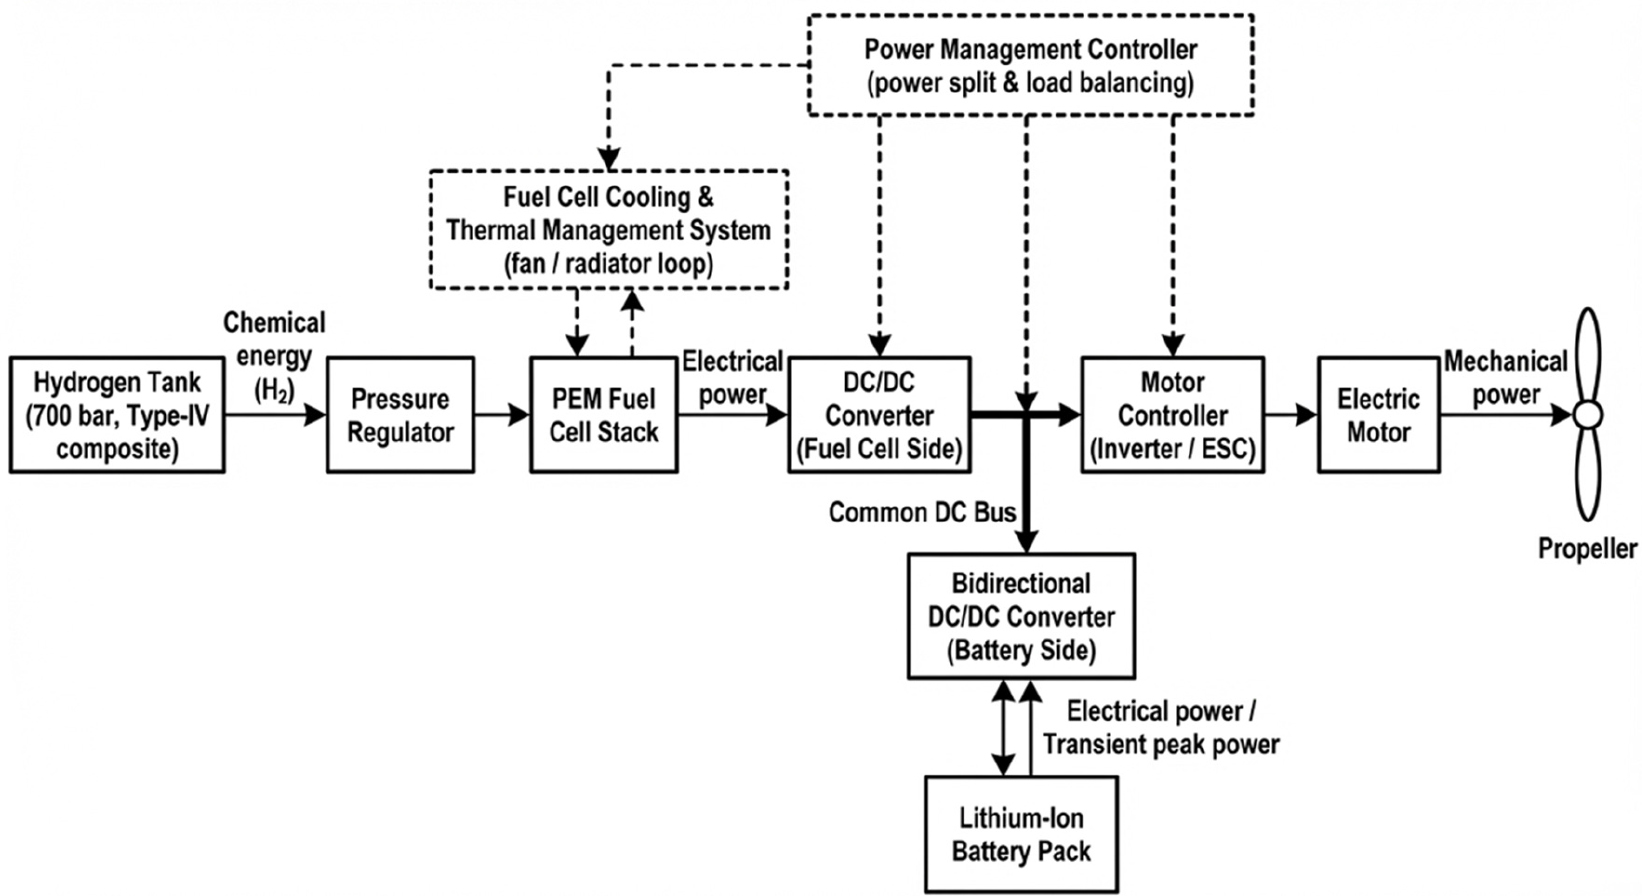
Fig. 1.
Functional architecture of the hybrid hydrogen–electric propulsion system assumed in the analytical model.
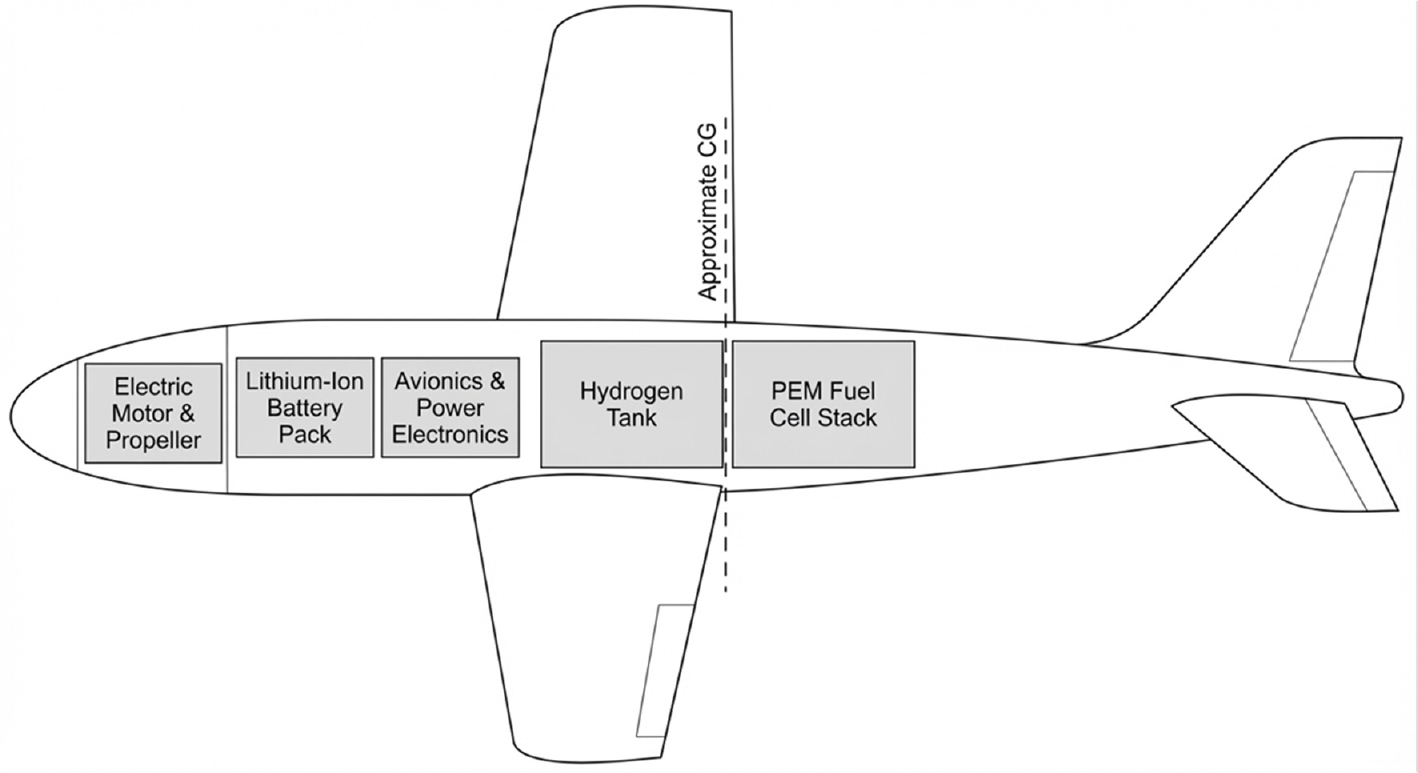
Fig. 2.
Conceptual layout and mass distribution of the baseline micro-to-small fixed-wing UAV assumed in the analytical model.
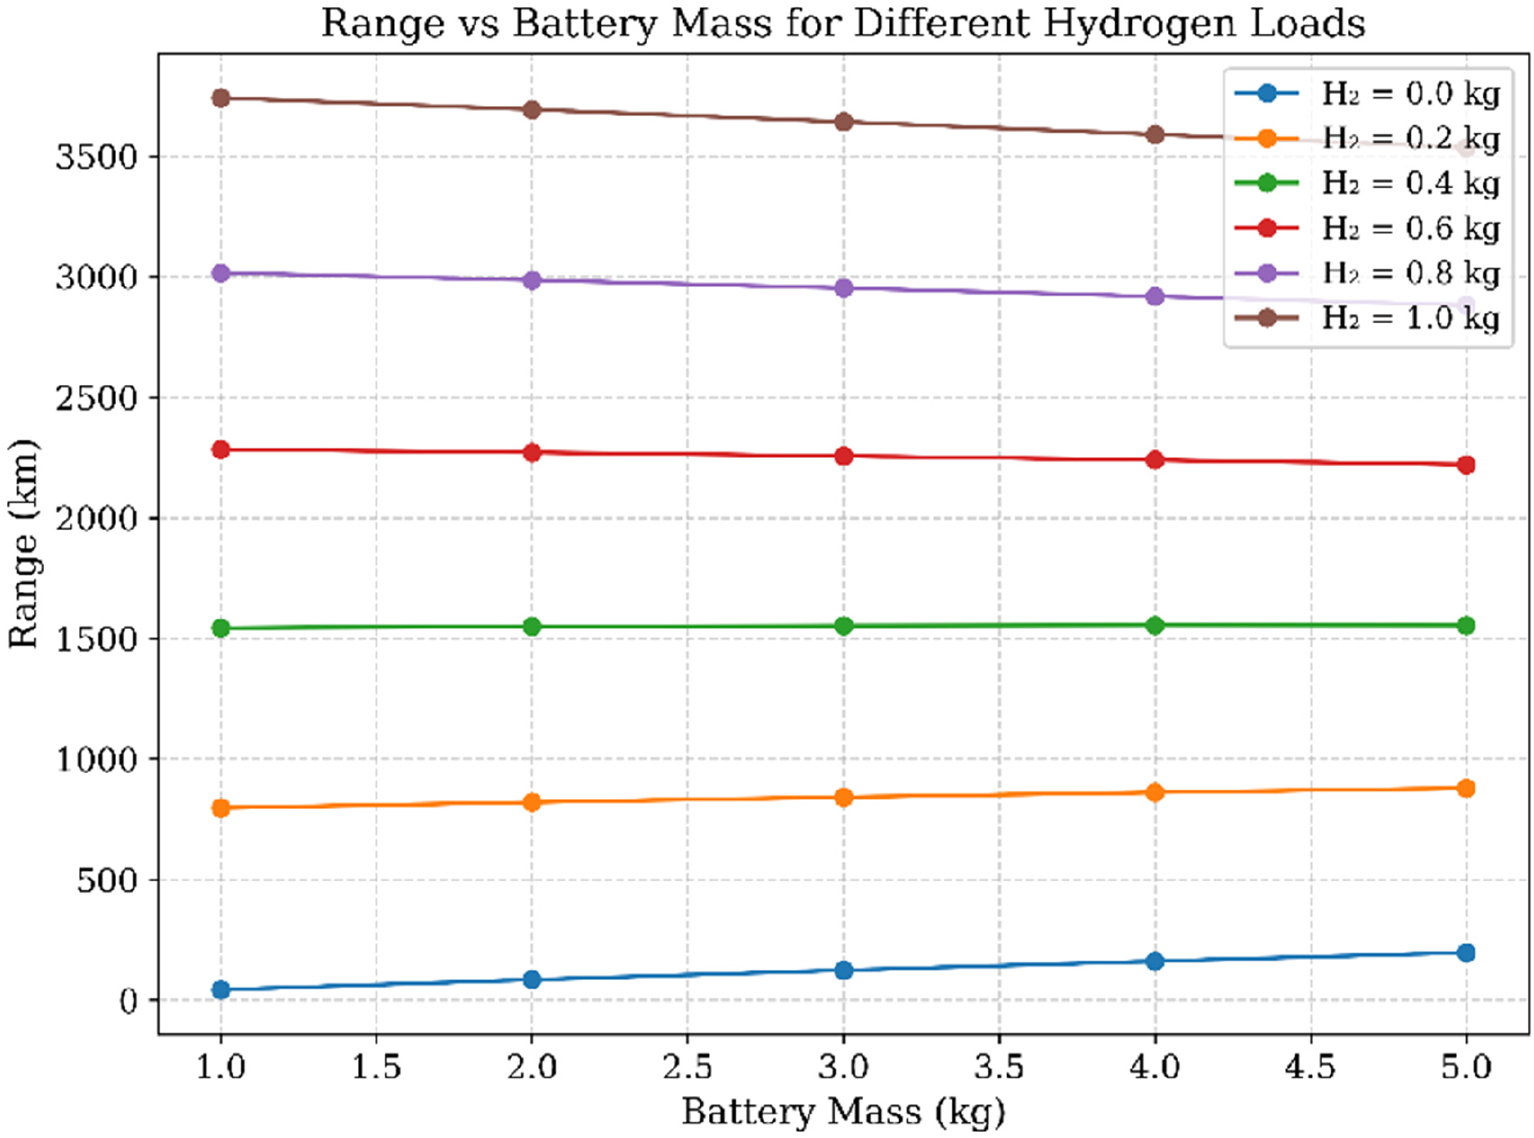
Fig. 3.
Range versus battery mass for different hydrogen loadings at a cruise speed of 25 m s-1.
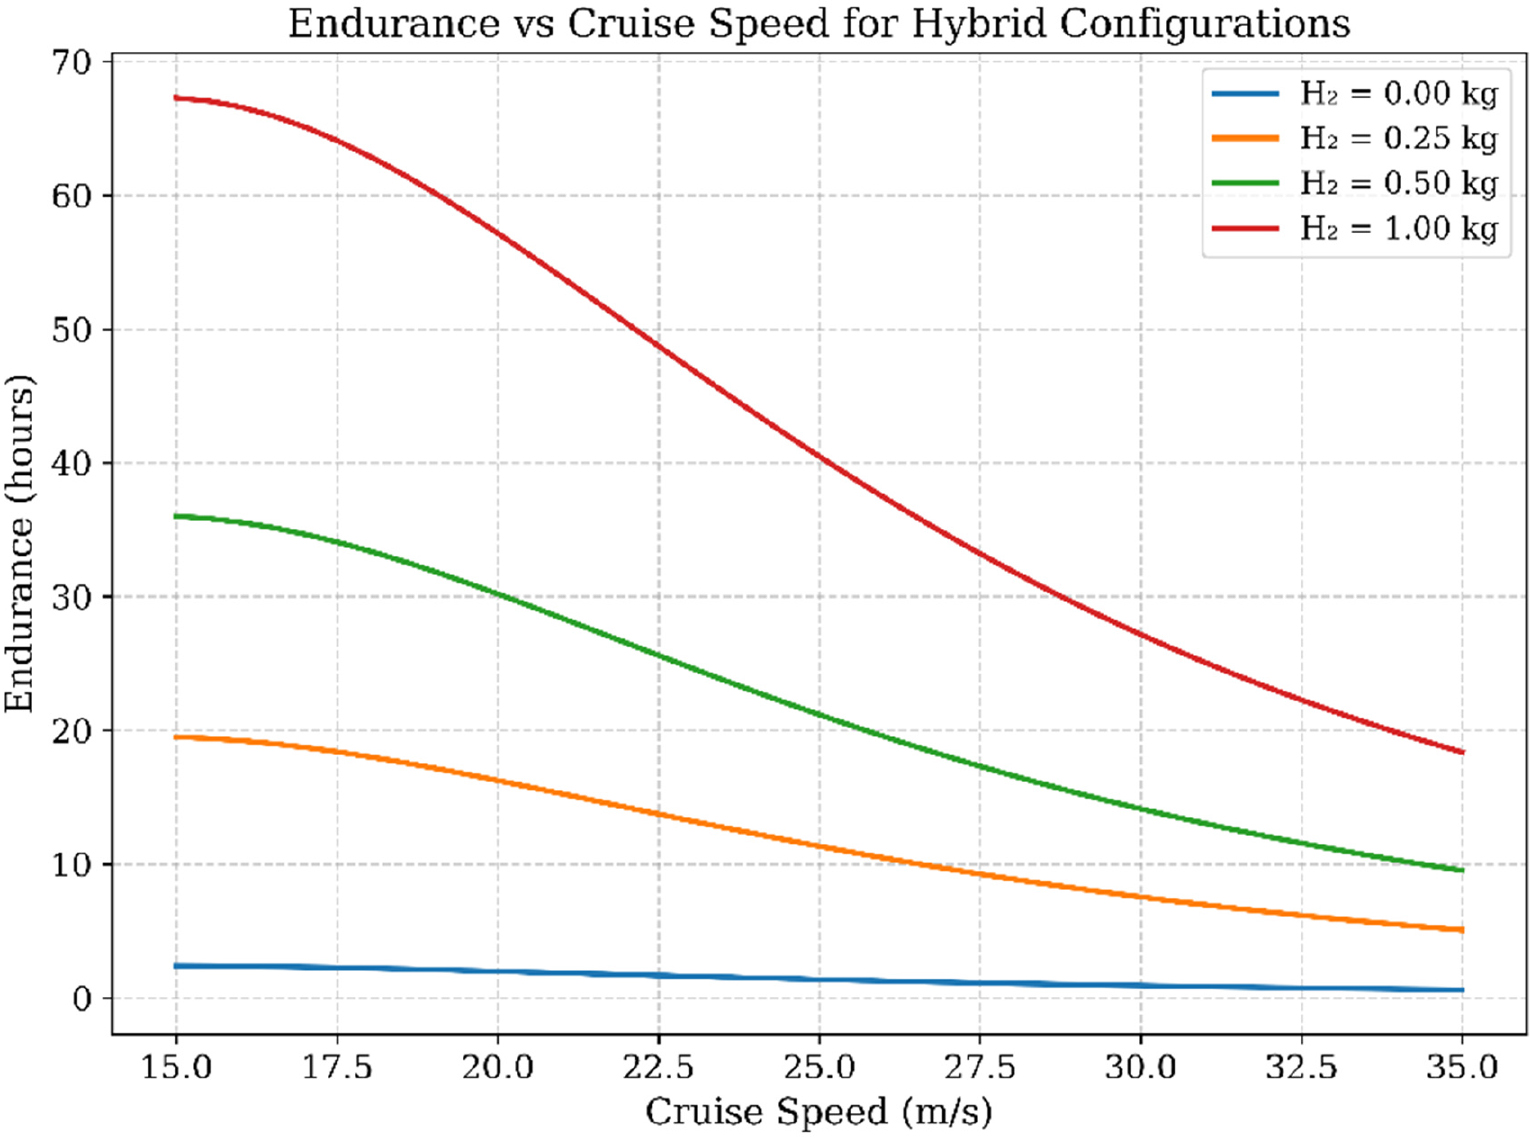
Fig. 4.
Predicted endurance as a function of cruise speed for multiple hybrid hydrogen–electric configurations.
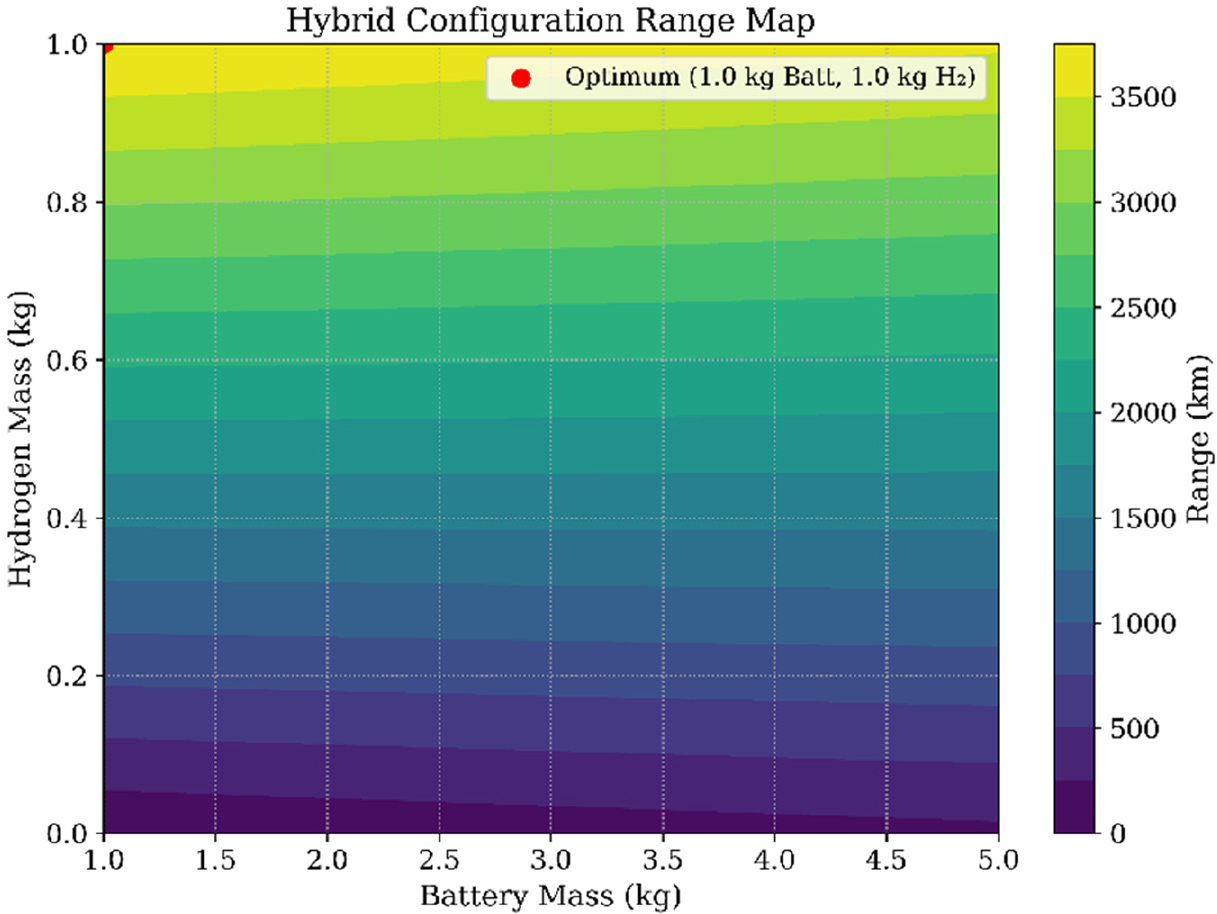
Fig. 5.
Contour map of predicted range as a function of battery mass and hydrogen mass at 25 m s-1.
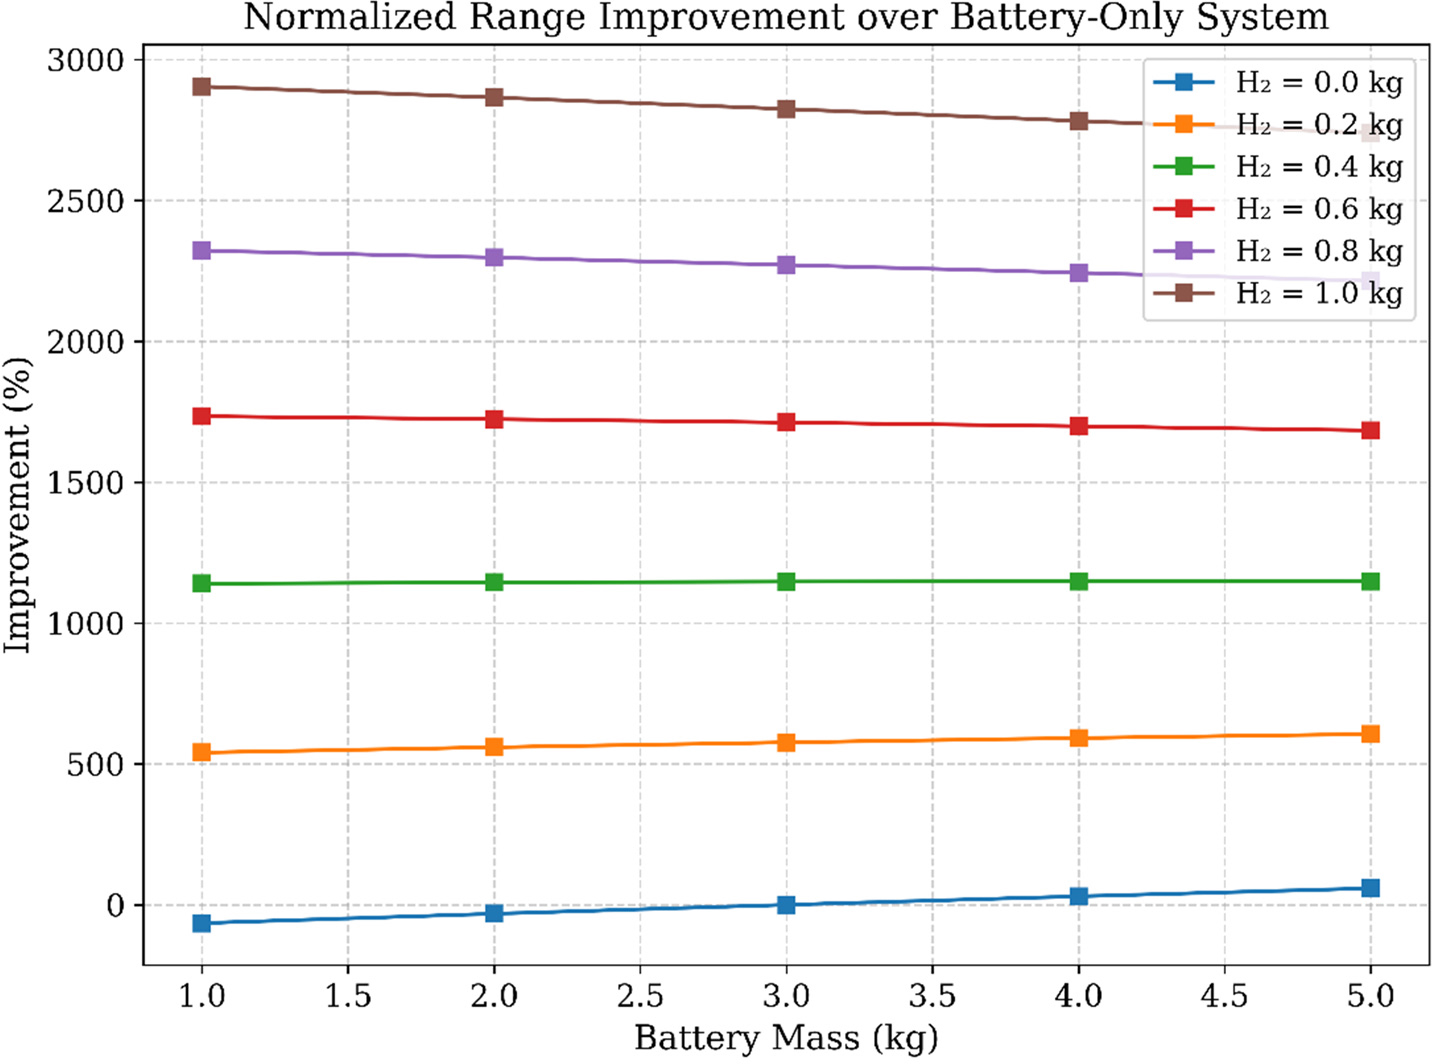
Fig. 6.
Normalized range improvement of hybrid configurations relative to a battery-only UAV baseline.
Table 3.
Representative Hybrid UAV Performance Results (Analytical Predictions).
| Battery (kg) | H2 (kg) | Endurance (h) | Range (km) | Power (kW) | Improvement (%) |
|---|---|---|---|---|---|
| 3.0 | 0.00 | 3.2 | 100 | 0.41 | — |
| 3.0 | 0.25 | 18.9 | 720 | 0.43 | 620 |
| 3.0 | 0.50 | 35.2 | 1400 | 0.44 | 1300 |
| 3.0 | 1.00 | 68.0 | 3700 | 0.46 | 3000 |
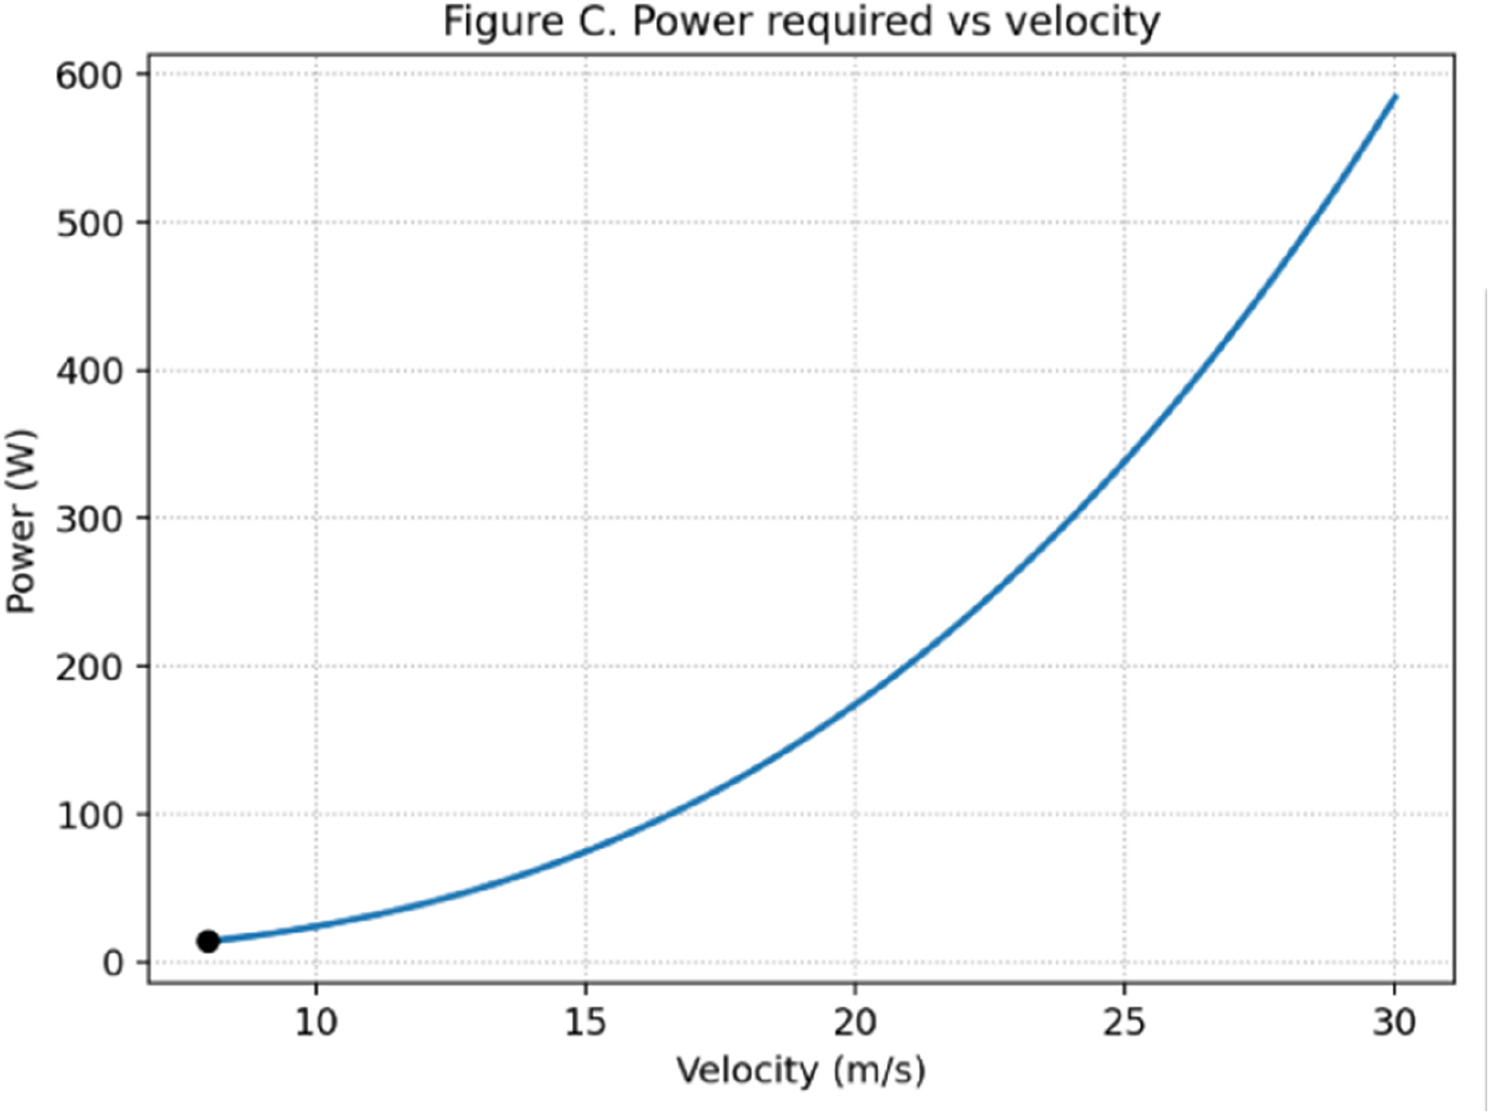
Fig. 7.
Propulsive power requirement as a function of cruise velocity predicted by the analytical model.
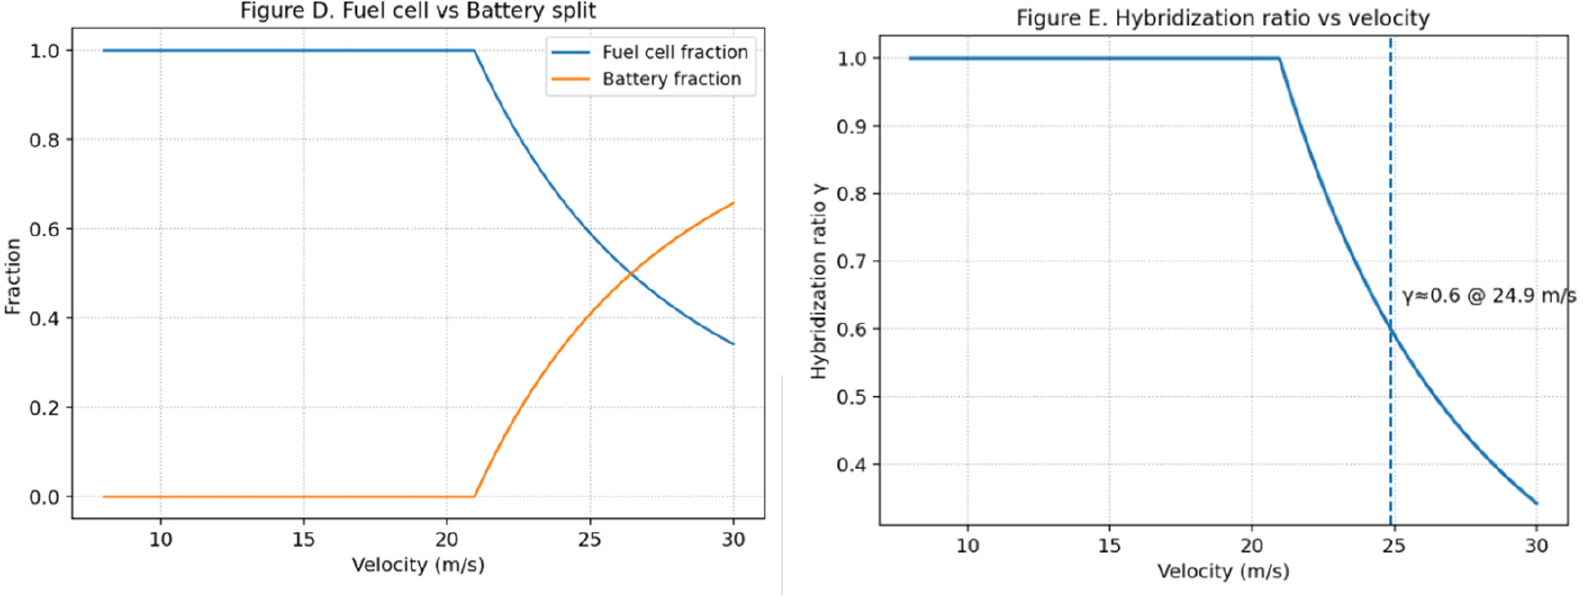
Fig. 8.
Hybrid power-sharing characteristics during steady cruise flight predicted by the analytical model.
(a) Fractional contribution of fuel-cell and battery power as a function of airspeed. At low and moderate velocities, the fuel cell supplies nearly the entire propulsive power demand, reflecting its role as the primary continuous energy source. As airspeed increases and aerodynamic power requirements grow, the battery contributes an increasing share of the total power, consistent with a hybrid operating strategy in which the battery provides transient or peak-power support while the fuel cell maintains baseline power delivery.
(b) Hybridization ratio (γ) as a function of cruise velocity. The hybridization ratio, defined as the fraction of required propulsive power supplied by the fuel cell, remains close to unity at low speeds and decreases smoothly with increasing velocity as battery contribution rises. Values around γ ≈ 0.6 indicate a balanced hybrid operating regime in which battery loading is moderated while efficient utilization of the fuel cell is maintained. The smooth, monotonic trend reflects the internal consistency of the energy-sharing formulation adopted in the analytical model.
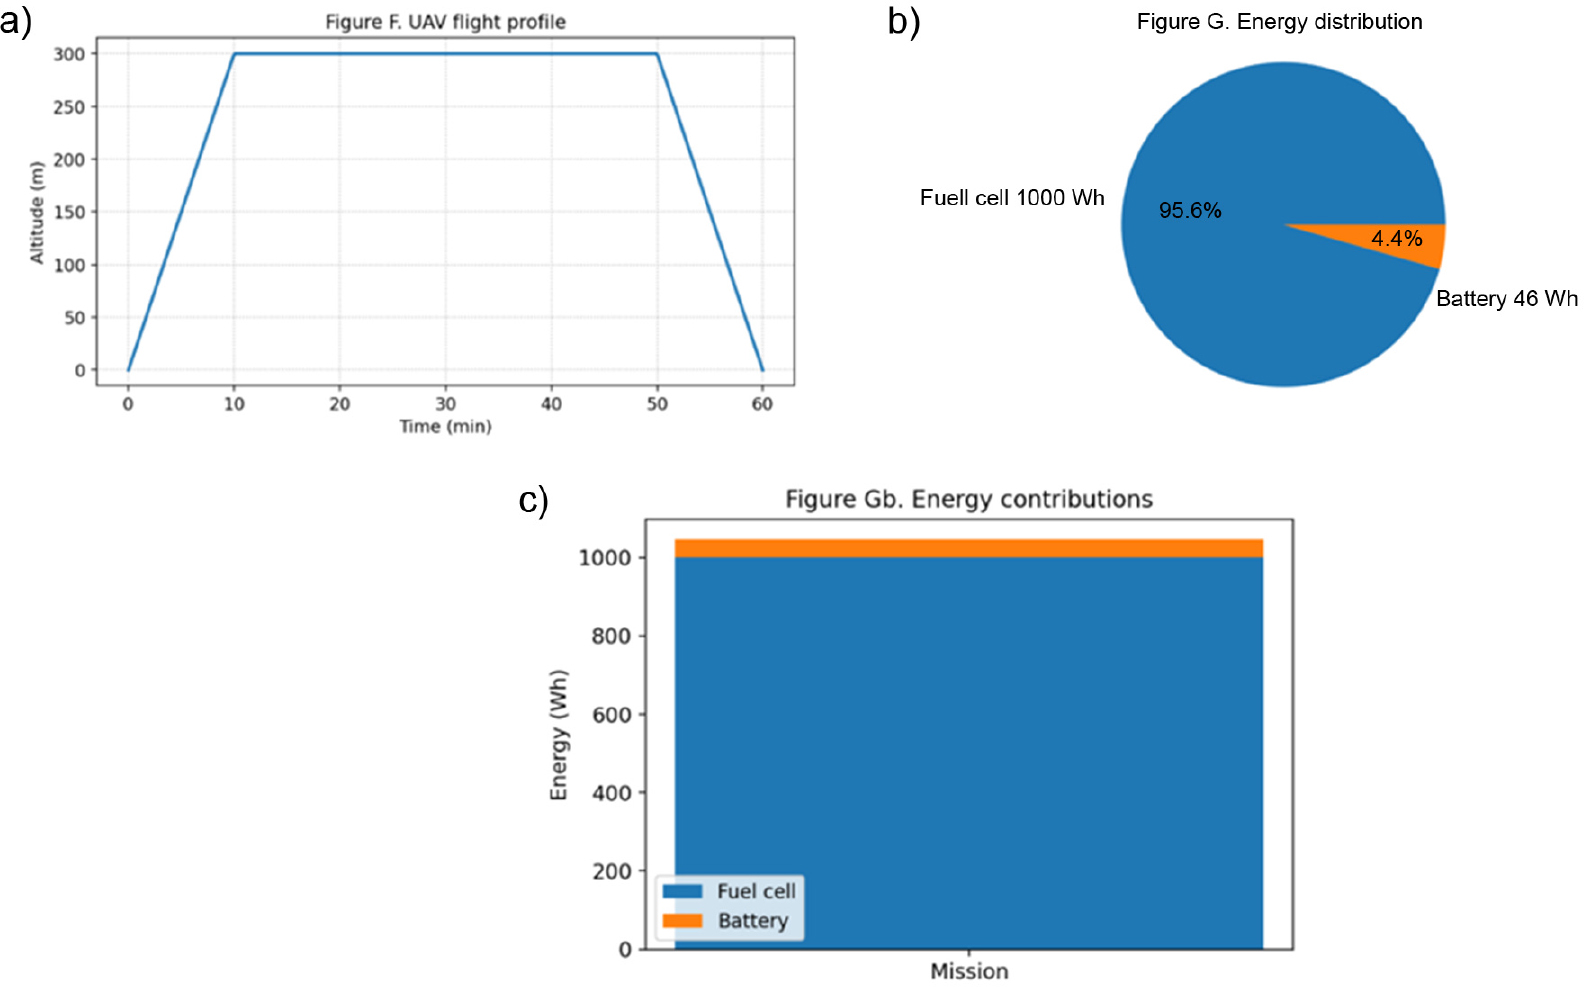
Fig. 9.
Mission-level energy utilization and endurance characteristics predicted by the analytical framework.
(a) Energy contribution of the hydrogen fuel cell and battery over a representative mission segment, illustrating the dominant role of hydrogen in long-duration energy supply and the supporting function of the battery for transient loads.
(b) Stacked comparison of total usable energy provided by each energy-storage subsystem, highlighting the relative contributions assumed in the hybrid architecture.
(c) Endurance map as a function of battery mass and hydrogen mass, showing smooth scaling with hydrogen loading and diminishing returns for battery-dominated configurations. All results are derived under steady-cruise and constant-efficiency assumptions and are intended for conceptual comparison.
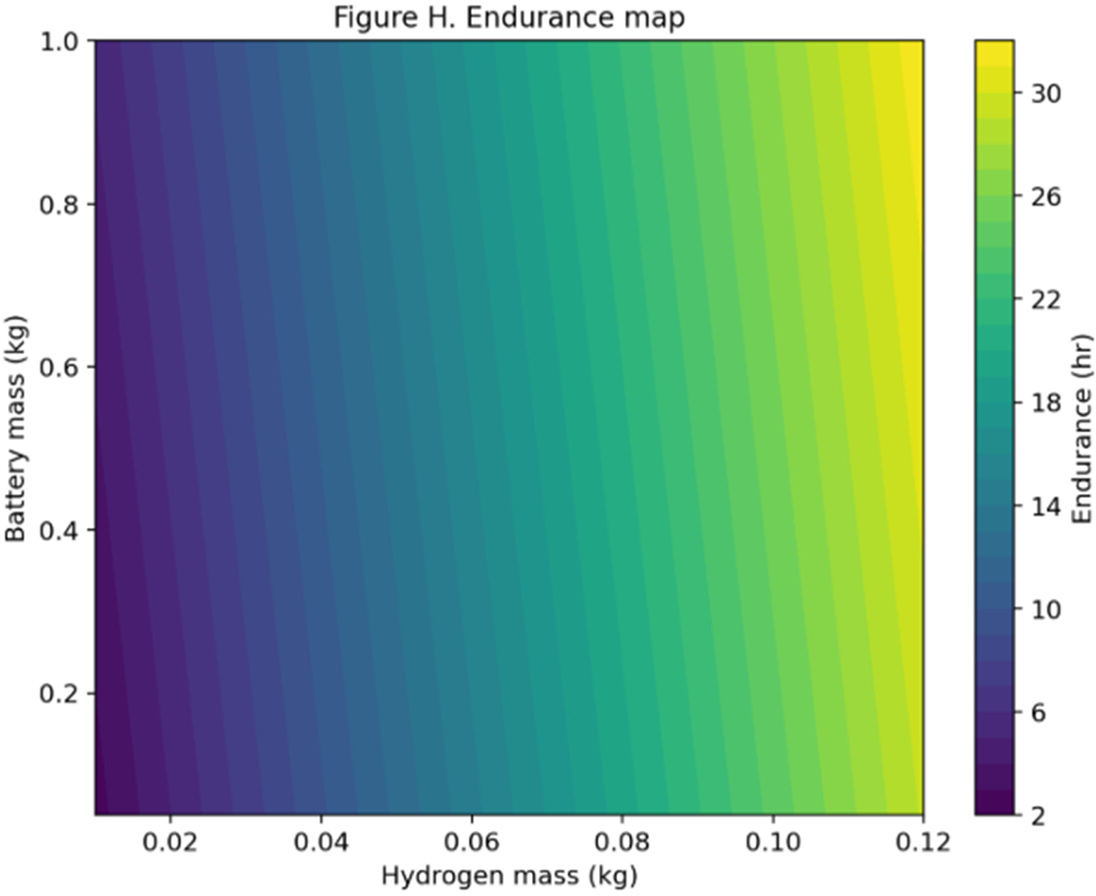
Fig. 10.
Endurance map as a function of battery mass and hydrogen mass predicted by the analytical framework.
Table 4.
Comparison of analytically predicted cruise-power requirements with representative values reported for small UAV platforms.
| UAV System | Reported Cruise Power | Model Prediction | Deviation |
|---|---|---|---|
| DJI Matrice 600 (hexarotor) | 0.4–0.6 kW | 0.45 kW | < 10% |
| Hydrogen–Electric Fixed-Wing UAV [1] | 180–220 W | 195 W | < 8% |
| Symbol | Description | Value / Range | Unit |
|---|---|---|---|
| ρ | Air density | 1.225 | kg m-3 |
| S | Wing area | 1.2 | m2 |
| CD0 | Zero-lift drag coefficient | 0.025 | — |
| k | Induced-drag factor | 0.045 | — |
| ηprop | Propeller efficiency | 0.85 | — |
| ηem | Motor efficiency | 0.90 | — |
| ηfc | Fuel-cell efficiency | 0.60 | — |
| ρbatt | Battery energy density | 230 | Wh kg-1 |
| LHVH2 | Hydrogen lower heating value | 1.20 × 10⁸ | J kg-1 |
| V | Cruise velocity | 15-35 | m s-1 |
| mbatt | Battery mass | 1-5 | kg |
| mH2 | Hydrogen mass | 0-1 | kg |