Figure 1
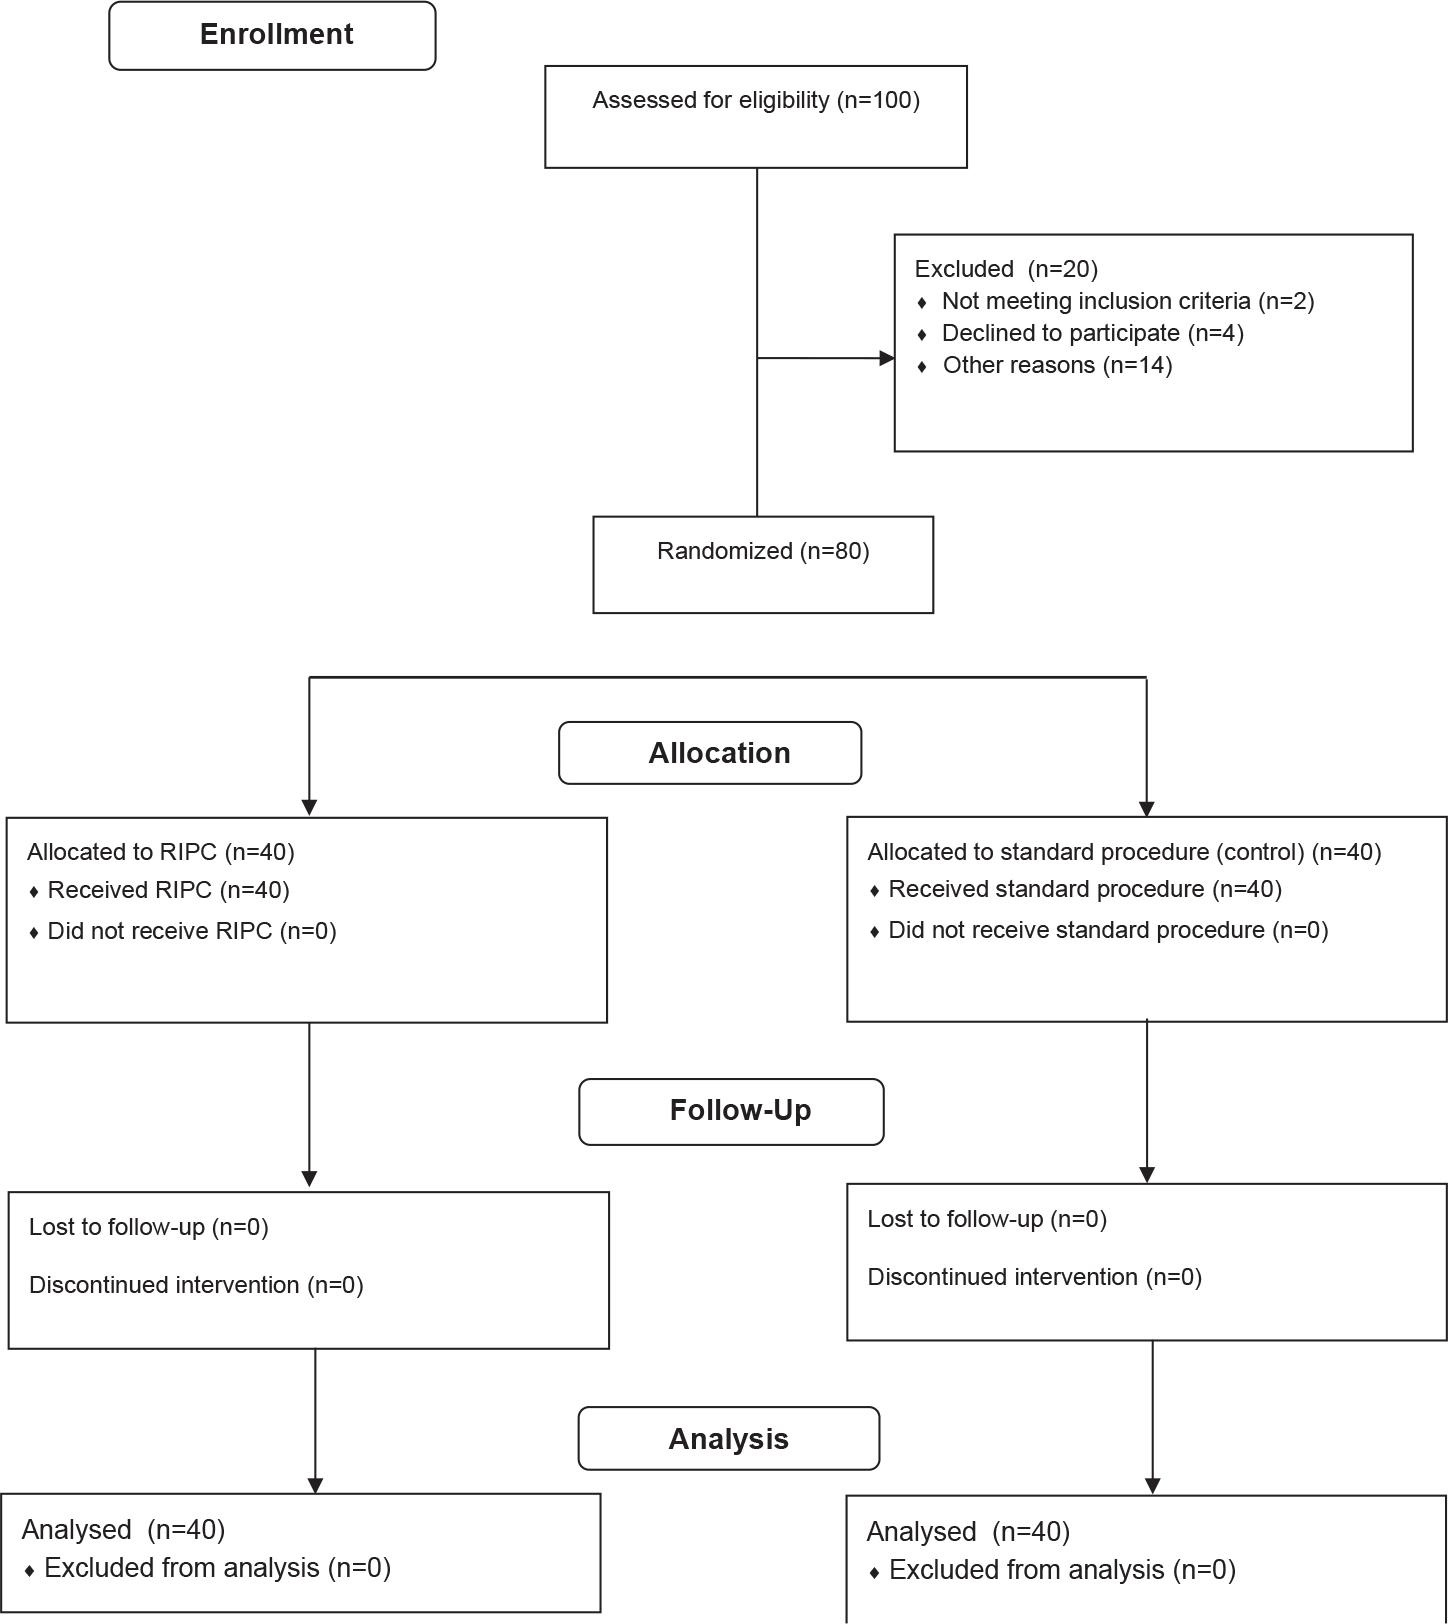
Figure 2
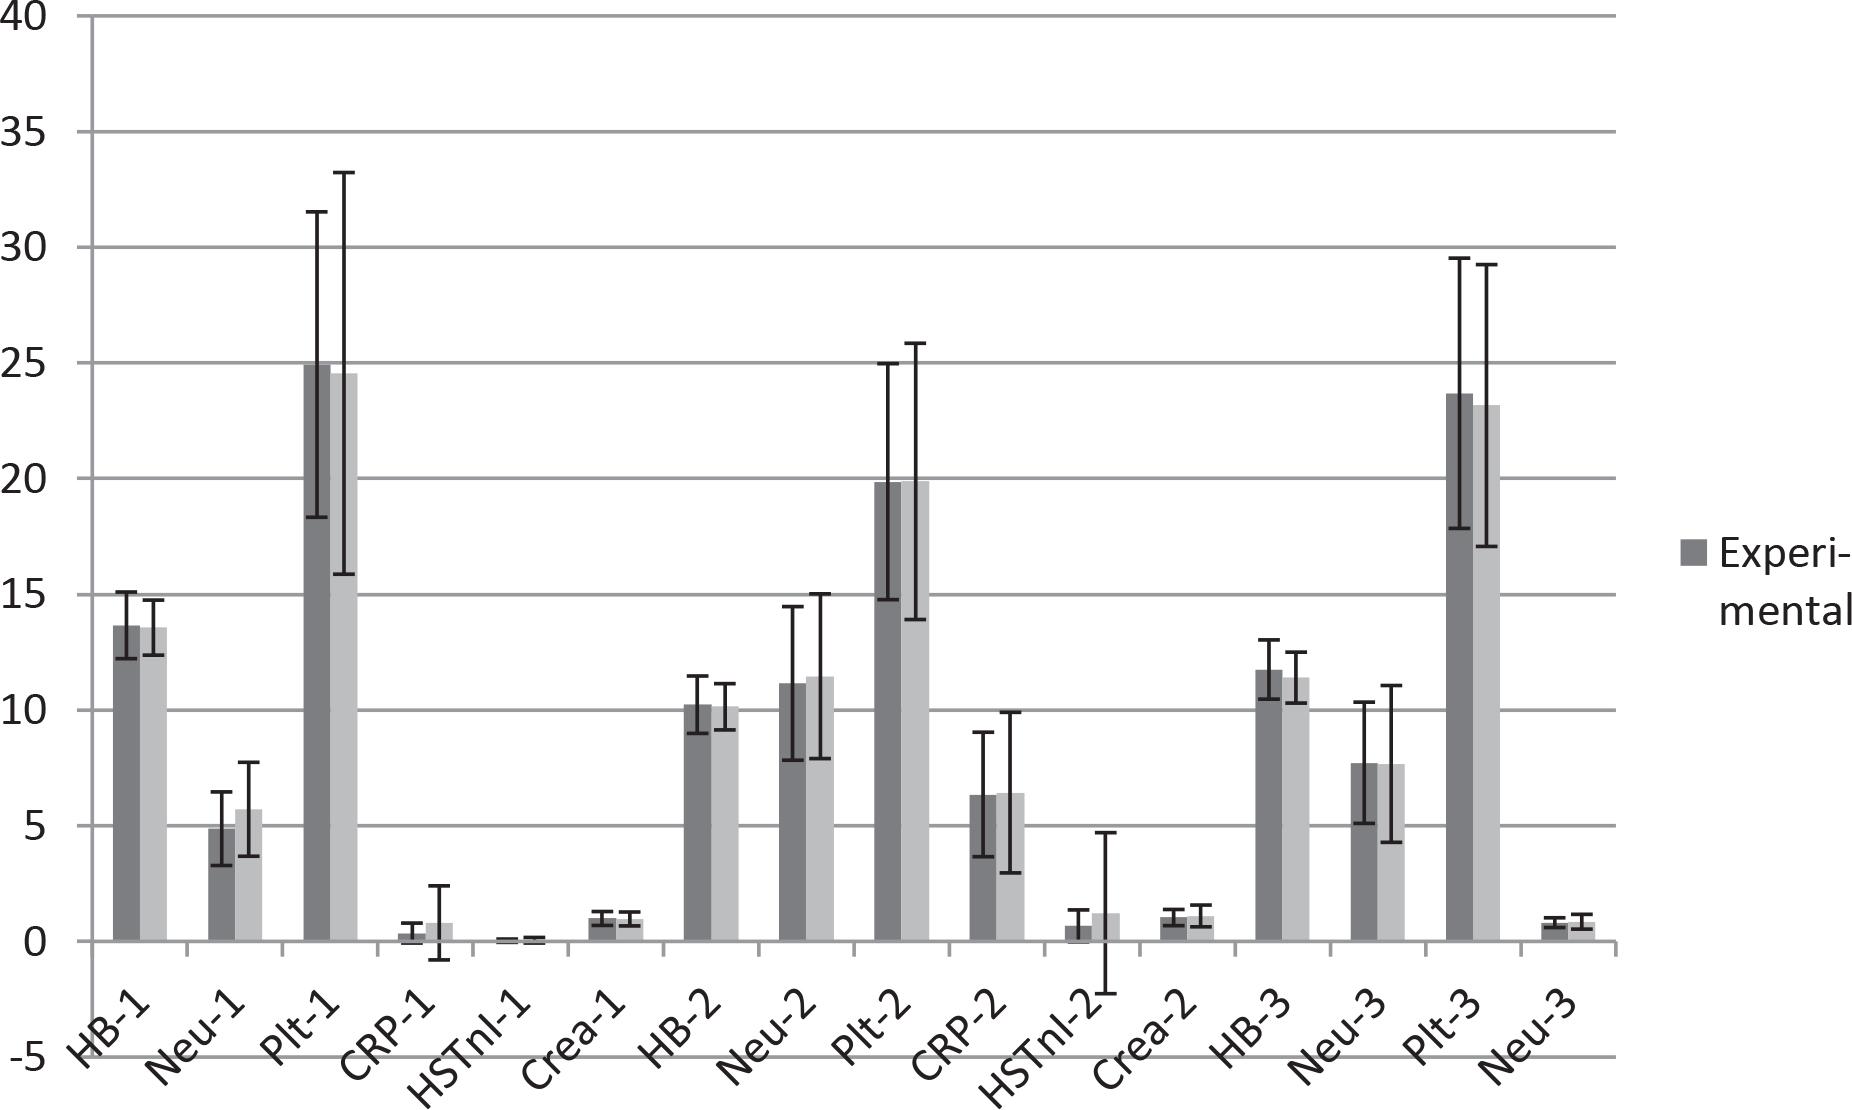
Figure 3
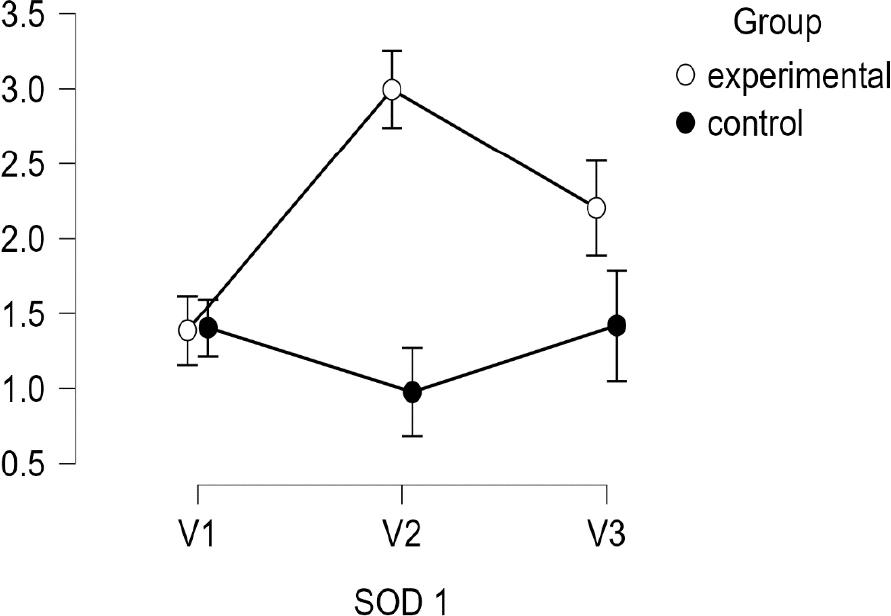
Figure 4
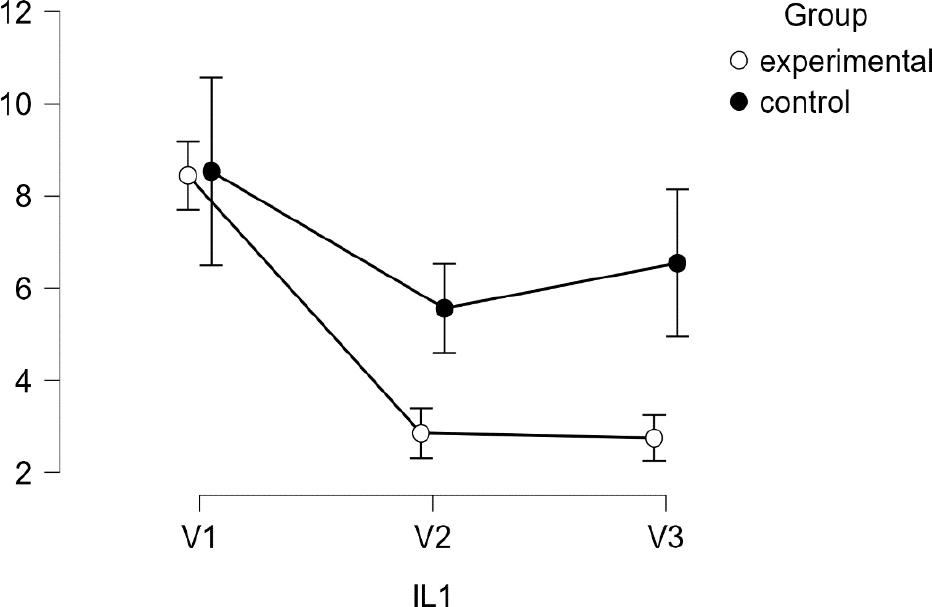
Figure 5
Operative characteristics of the patients
| Experimental group N = 40 | Control group N = 40 | p | |
|---|---|---|---|
| SYNTAX I – n ± SD | 29.58 ± 7.94 | 30.51 ± 8.59 | 0.61 |
| ACT (min) – n ± SD | 65.45 ± 28.20 | 76.42 ± 26.33 | 0.97 |
| CPBT (min) – n ± SD | 81.20 ± 28 | 93.50 ± 28.31 | 0.97 |
| LVEF/pre (%) – n ± SD | 51.75 ± 7.97 | 48.37 ± 9.63 | 0.89 |
| LVEF/post (%) – n ± SD | 51.62 ± 7.37 | 49.37 ± 8.02 | 0.90 |
| ICU days (n) – n ± SD | 3.62 ± 0.86 | 4.10±1.59 | 0.97 |
| Hosp. days (n) - n ± SD | 10.30 ± 2.51 | 10.55 ± 3.17 | 0.98 |
Cardiovascular risk factors of the patients
| Experimental group N = 40 | Control group N = 40 | p | |
|---|---|---|---|
| Dyslipidemia n, (%) | 40, (100.00) | 37, (92.50) | 0.10 |
| HTN n, (%) | 39, (97.50) | 37, (92.50) | 0.21 |
| T2DM n, (%) | 16, (40.00) | 15, (37.50) | 0.36 |
| Old MI n, (%) | 12, (30.00) | 17, (42.50) | 0.11 |
| History of stroke n, (%) | 2, (5.00) | 2, (5.00) | 0.98 |
| PAD n, (%) | 4, (7.50) | 8, (15) | 0.10 |
General laboratory tests
| Experimental group N = 40 | Control group N = 40 | p | ||
|---|---|---|---|---|
| V1 | Hb - g/dl ± SD | 13.66 ± 1.44 | 13.56 ± 1.19 | 0.73 |
| Neu – u/l (103) ± SD | 4.87 ± 1.59 | 5.71 ± 2.03 | 0.44 | |
| Plt – u/l (103) ± SD | 249.35 ± 66.05 | 245.57 ± 86.80 | 0.82 | |
| CRP – mg/dl ± SD | 0.36 ± 0.43 | 0.80 ± 1.60 | 0.10 | |
| hsTnI – pg/ml ± SD | 0.03 ± 0.07 | 0.05 ± 0.12 | 0.57 | |
| Creatinine – mg/dl ± SD | 0.99 ± 0.30 | 0.97 ± 0.30 | 0.83 | |
| V2 | Hb - g/dl ± SD | 10.23 ± 1.24 | 10.14 ± 1.00 | 0.71 |
| Neu – u/l (103) ± SD | 11.15 ± 3.32 | 11.46 ± 3.56 | 0.69 | |
| Plt – u/l (103) ± SD | 198.75 ± 51.08 | 198.85 ± 59.75 | 0.99 | |
| CRP – mg/dl ± SD | 6.35 ± 2.69 | 6.43 ± 3.47 | 0.90 | |
| hsTnI – pg/ml ± SD | 0.67 ± 0.69 | 1.22 ± 3.48 | 0,33 | |
| Creatinine – mg/m l± SD | 1.03 ± 0.35 | 1.10 ± 0.47 | 0.43 | |
| V3 | Hb - g/dl ± SD | 11.75 ± 1.28 | 11.40 ± 1.10 | 0.19 |
| Neu – u/l (103) ± SD | 7.72 ± 2.62 | 7.67 ± 3.39 | 0.94 | |
| Plt – u/l (103) ± SD | 236.95 ± 58.41 | 231.62 ± 60.97 | 0.69 | |
| Creatinine – mg/ml ± SD | 0.81 ± 0.21 | 0.85 ± 0.32 | 0.45 | |
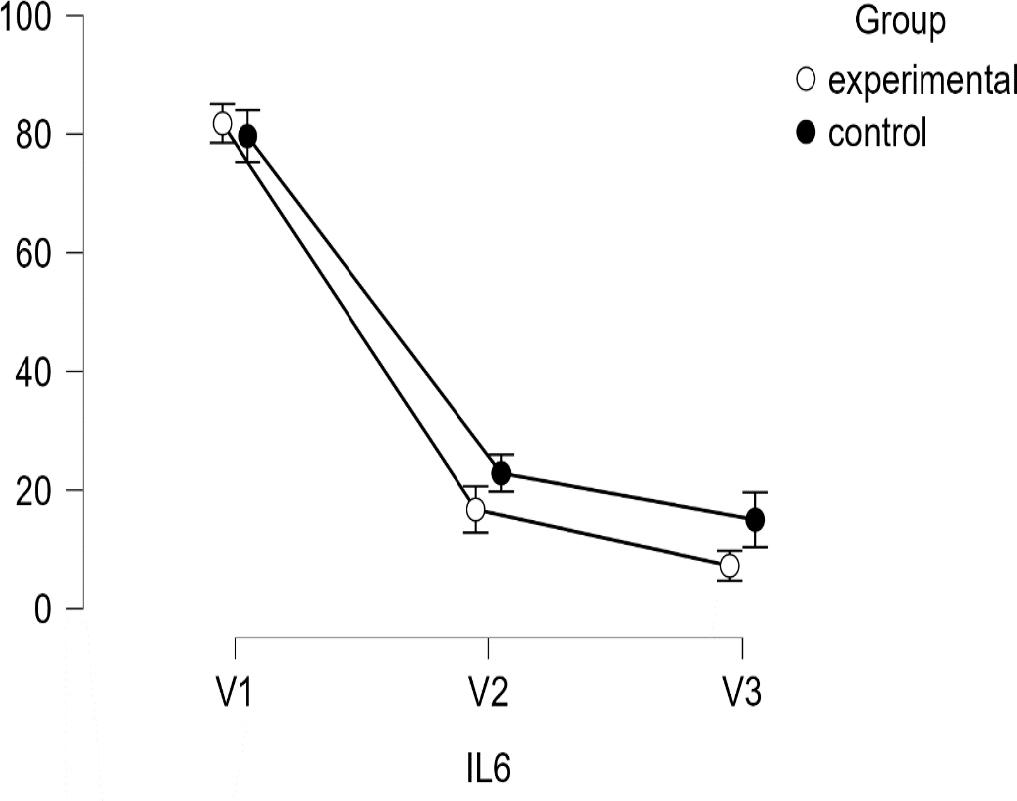
Results of ANOVA RM for SOD-1, IL-1 and IL-6 under RIPC on patients undergoing CABG
| SOD-1 | IL-1 | IL-6 | ||||
|---|---|---|---|---|---|---|
| Experimental (n = 40) | Control (n = 40) | Experimental (n = 40) | Control (n = 40) | Experimental (n = 40) | Control (n = 40) | |
| V1 | 1.38±0.20 | 1.4±0.24 | 14.57±11.17 | 16.78 ± 13.17 | 80.59 ± 10.89 | 77.66 ± 9.43 |
| V2 | 2.99 ± 0.93*** | 0.97 ± 0.79 | 2.85 ± 2.24*** | 5.56 ± 4.90 | 16.43±9.73** | 22.83 ± 13.39 |
| V3 | 2.20 ± 1.22** | 1.41 ± 1.33 | 2.75 ± 2.06*** | 6.54 ± 5.10 | 2.75 ± 2.06*** | 6.54 ± 5.10 |
Post-hoc Power Analysis
| Power | Without RIPC | With RIPC | Cohen’s |δ| | α | |
|---|---|---|---|---|---|
| 0.598 | 40 | 40 | 0.500 | 0.050 | |
| Power by Effect Size | |||||
| True effect size | Power to detect | Description | |||
| 0 < |δ| ≤ 0.444 | ≤ 50% | Likely to miss | |||
| 0.444 < |δ| ≤ 0.634 | 50% – 80% | Good chance of missing | |||
| 0.634 < |δ| ≤ 0.816 | 80% – 95% | Probably will detect | |||
| |δ| ≥ 0.816 | ≥ 95% | Almost surely will detect | |||
Baseline characteristics of the patients
| Experimental group N = 40 | Control group N = 40 | p | |
|---|---|---|---|
| Age – years (mean) ± SD | 65 ± 7.57 | 64.47 ± 8.53 | 0.90 |
| Gender (male) – n, (%) | 34, (85) | 29, (72.50) | 0.08 |
| BMI – kg/m2±SD | 27.88 ± 4.26 | 29.36 ± 3.93 | 0.98 |
| Smoking – n, (%) | 9, (22.50) | 6, (15) | 0.08 |