
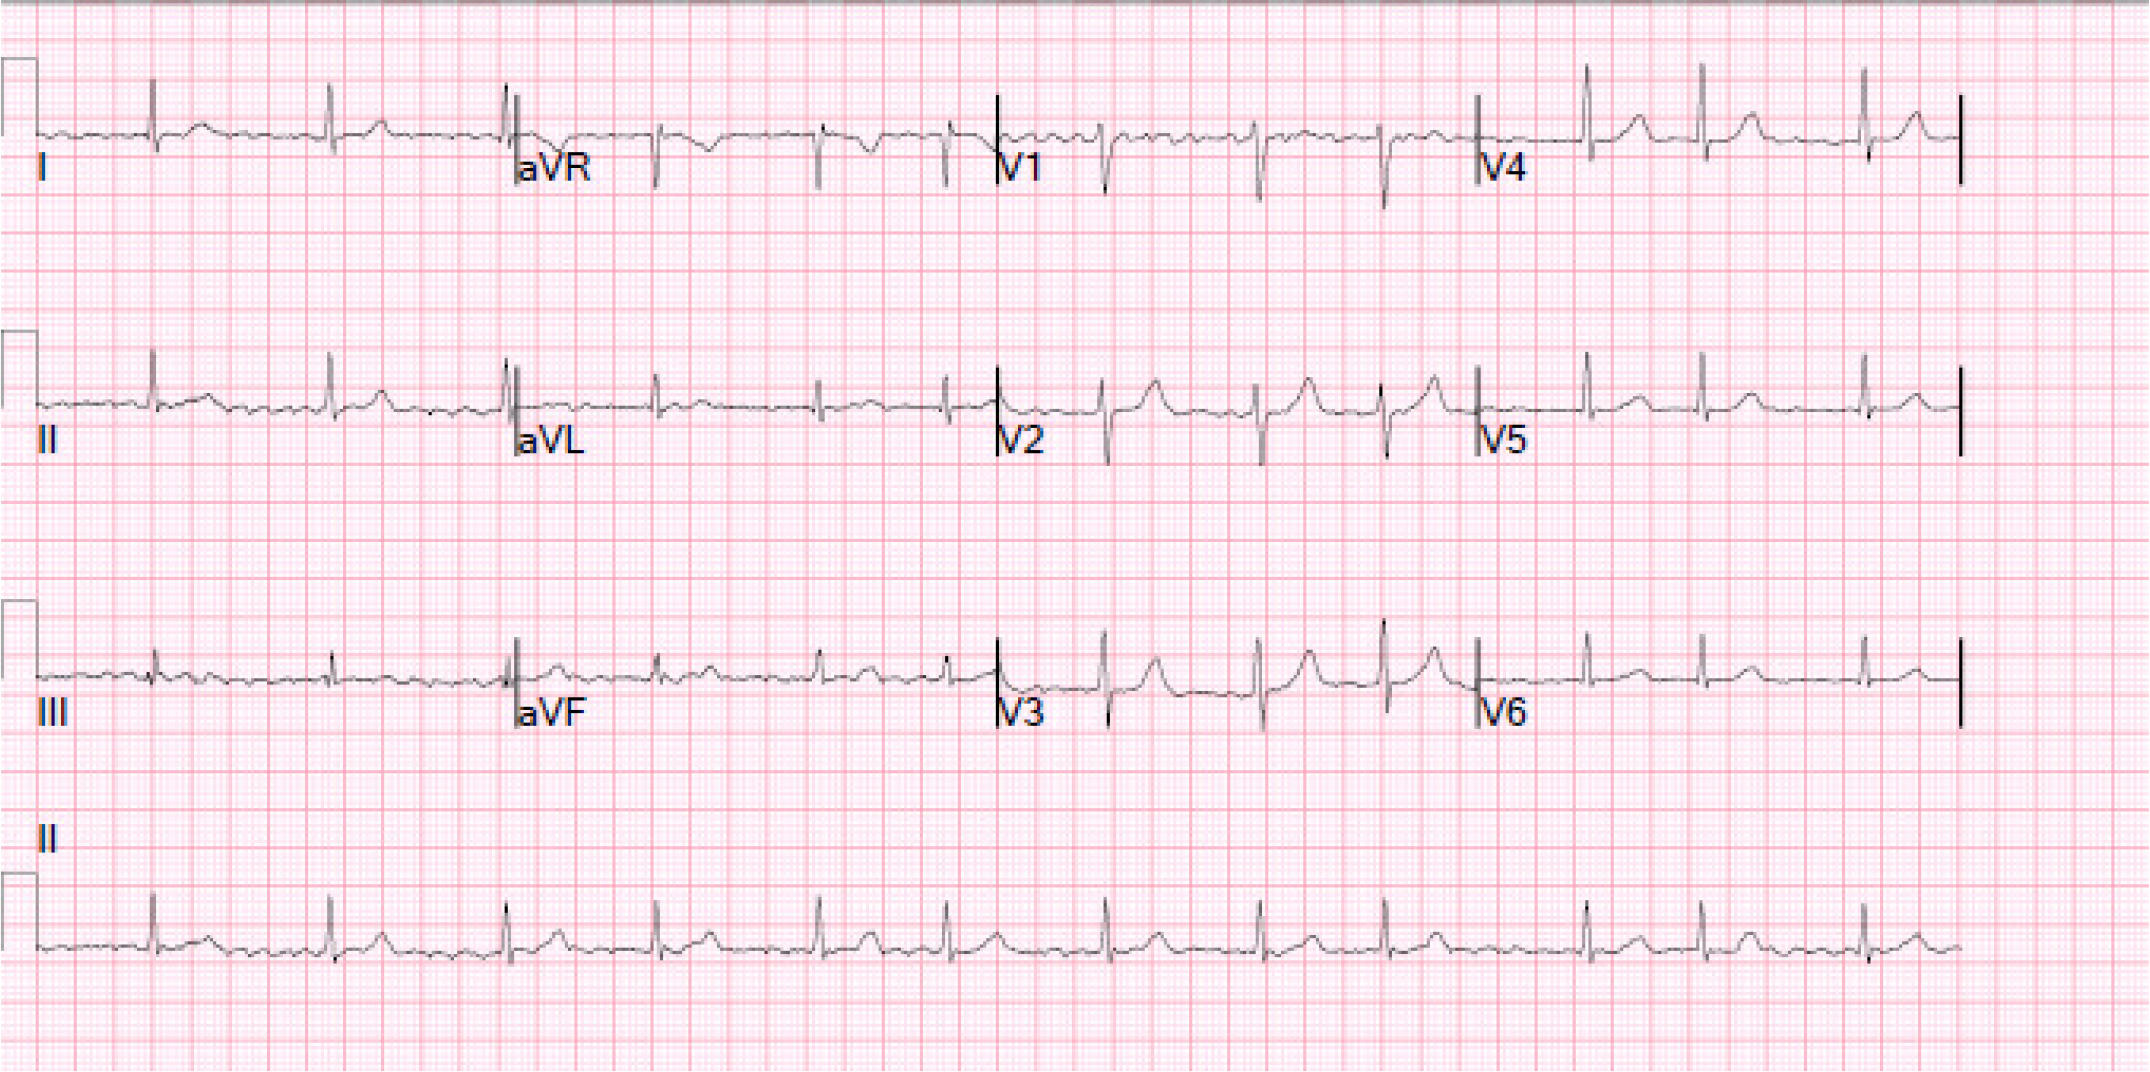
Figure 1
ECG at rest. The ECG trace is showing AF at 72 bpm with normal QRS morphology and no repolarization abnormalities. The QTc interval is 420ms
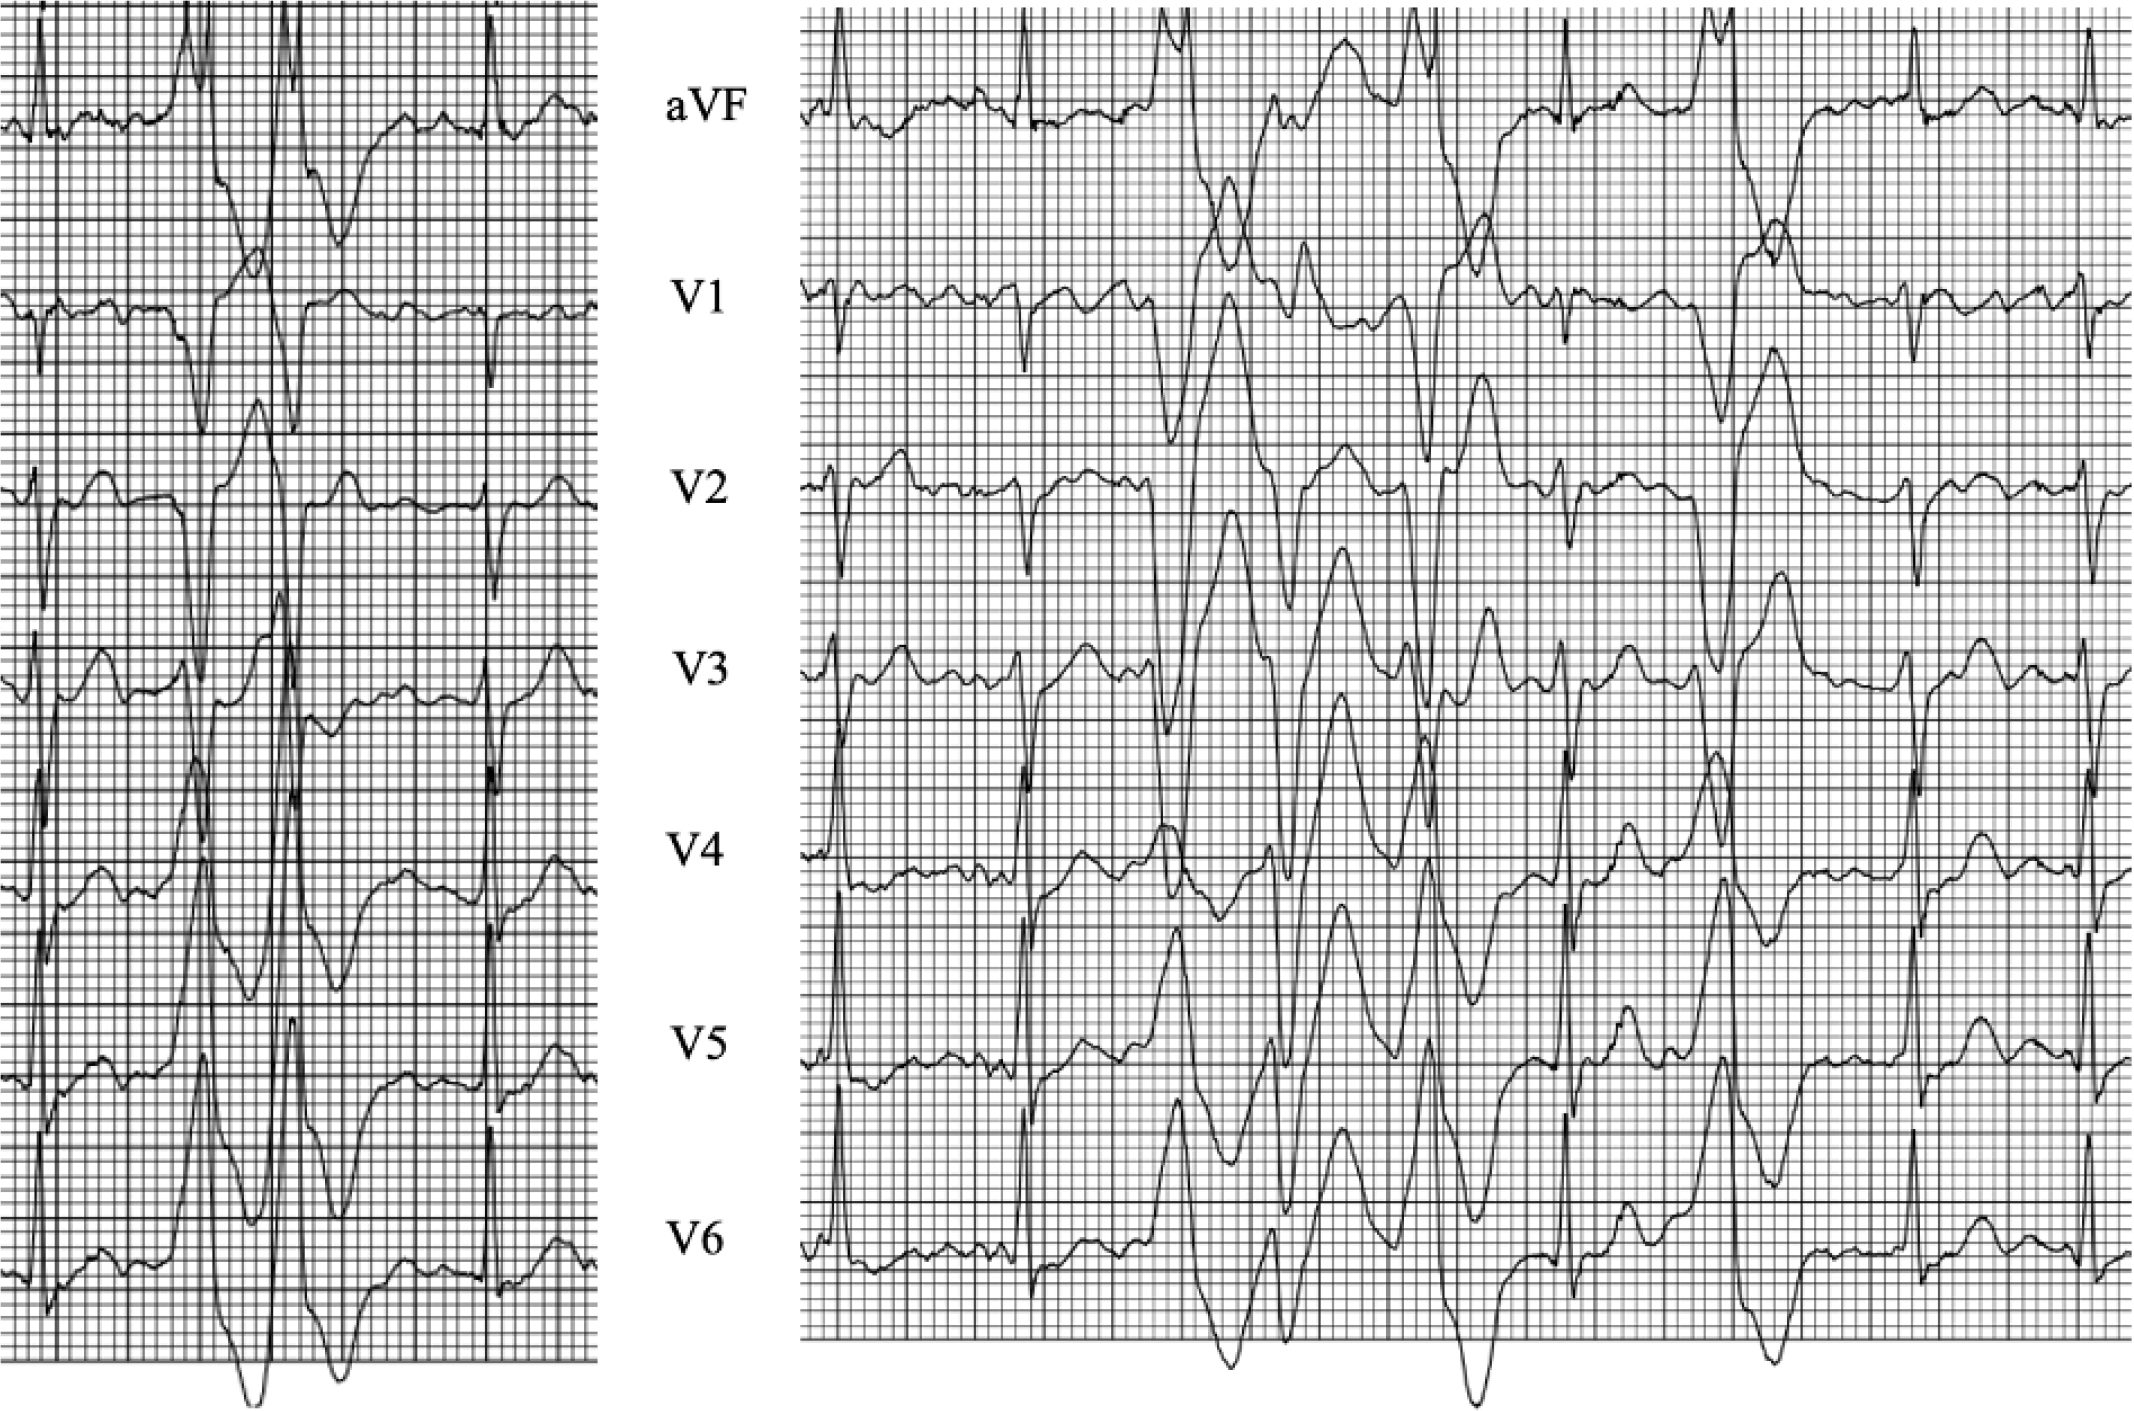
Figure 2
Initial exercise tolerance test. The ECG trace is showing a monomorphic couplet and a polymorphic run of NSVT at 150 bpm with ventricular capture
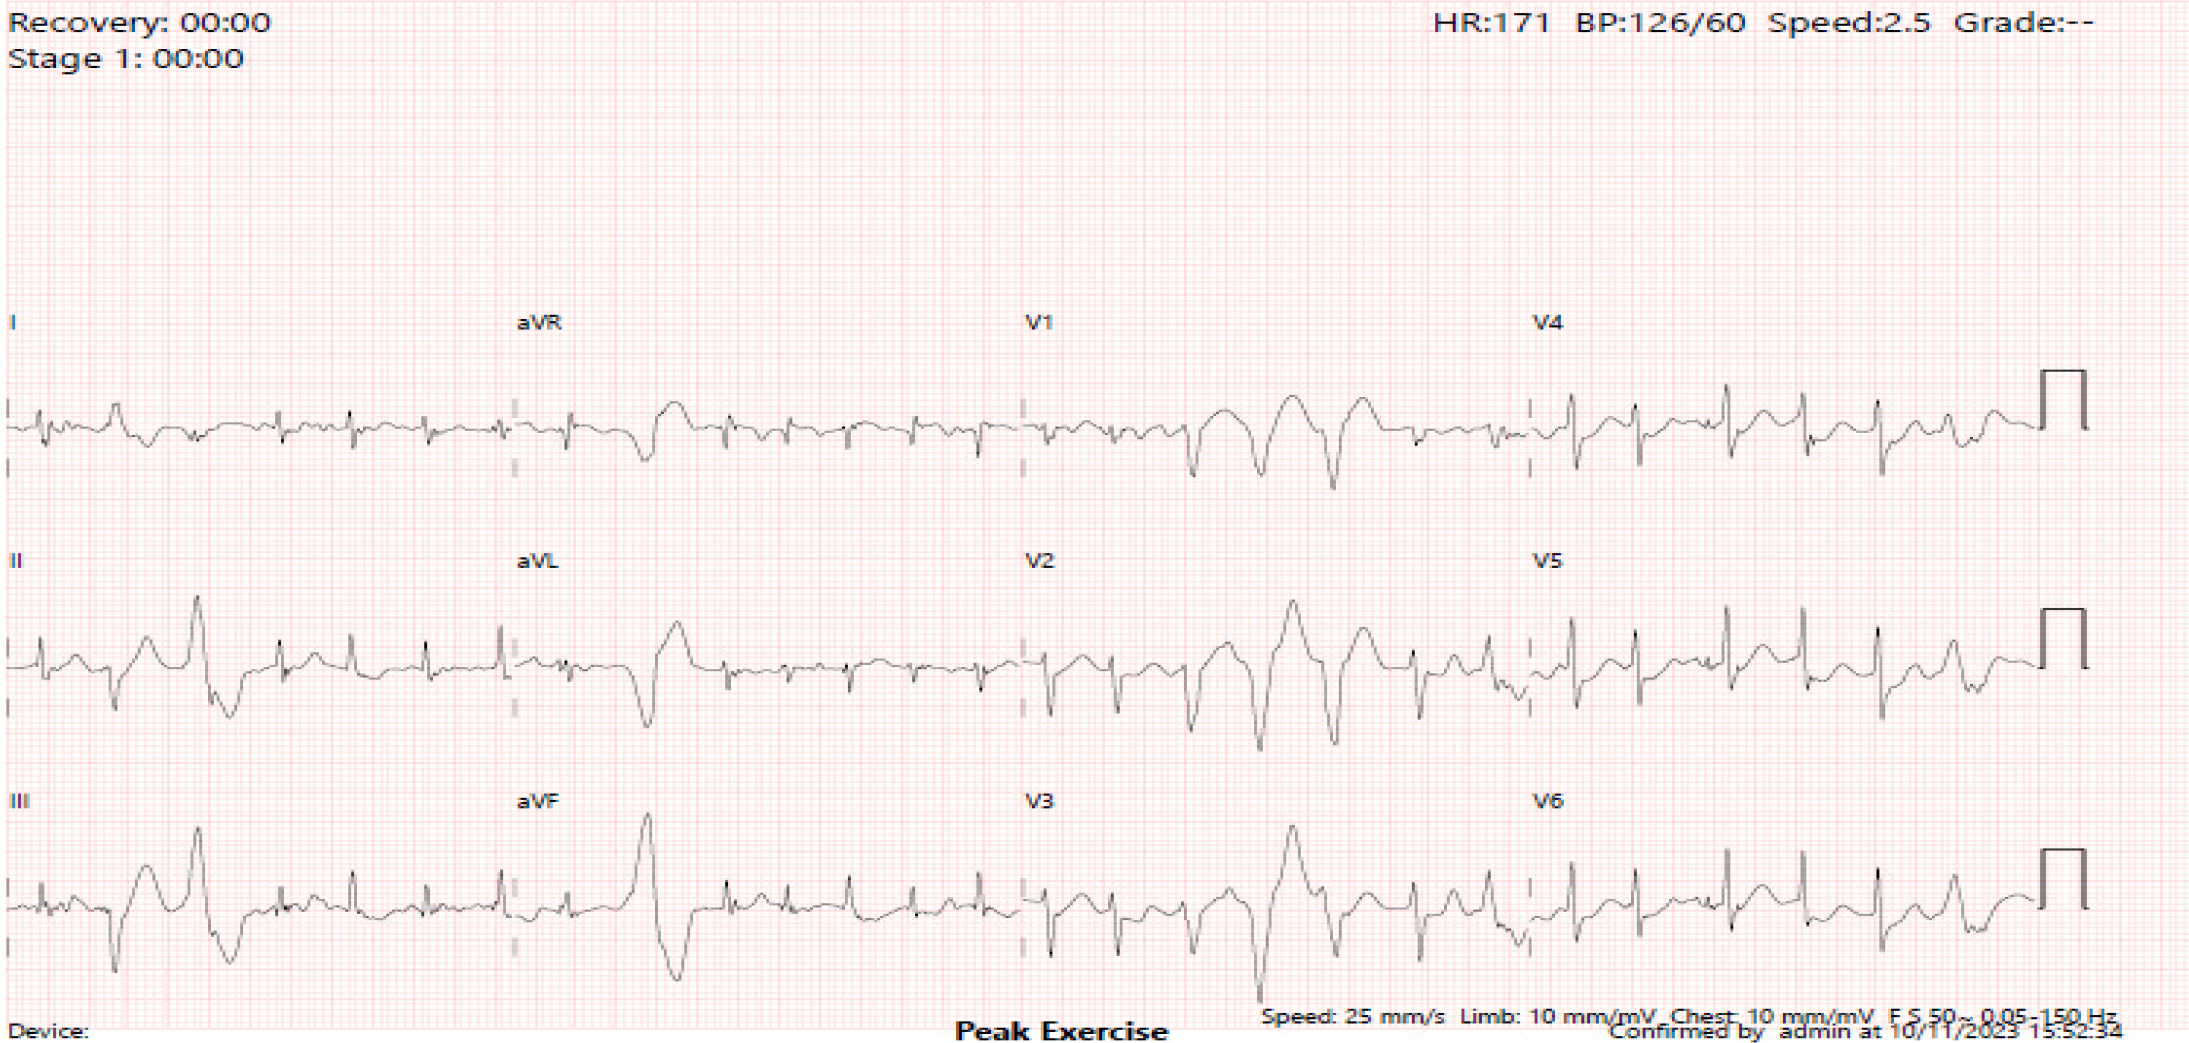
Figure 3
The second exercise tolerance test was performed under bisoprolol. The ECG strip recorded a bidirectional couplet and a 3-beat run at 170 bpm.