Figure 1.
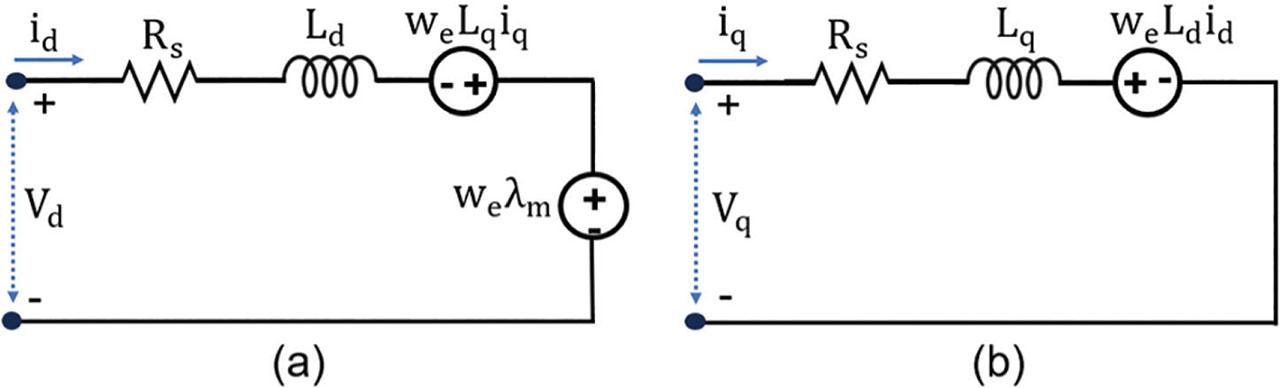
Equivalent electrical circuit representation of the OR-PMaSynRM in the dq reference frame: (a) d-axis model, (b) q-axis model. OR-PMaSynRM, outer-rotor permanent magnet-assisted synchronous reluctance motor.

Figure 2.
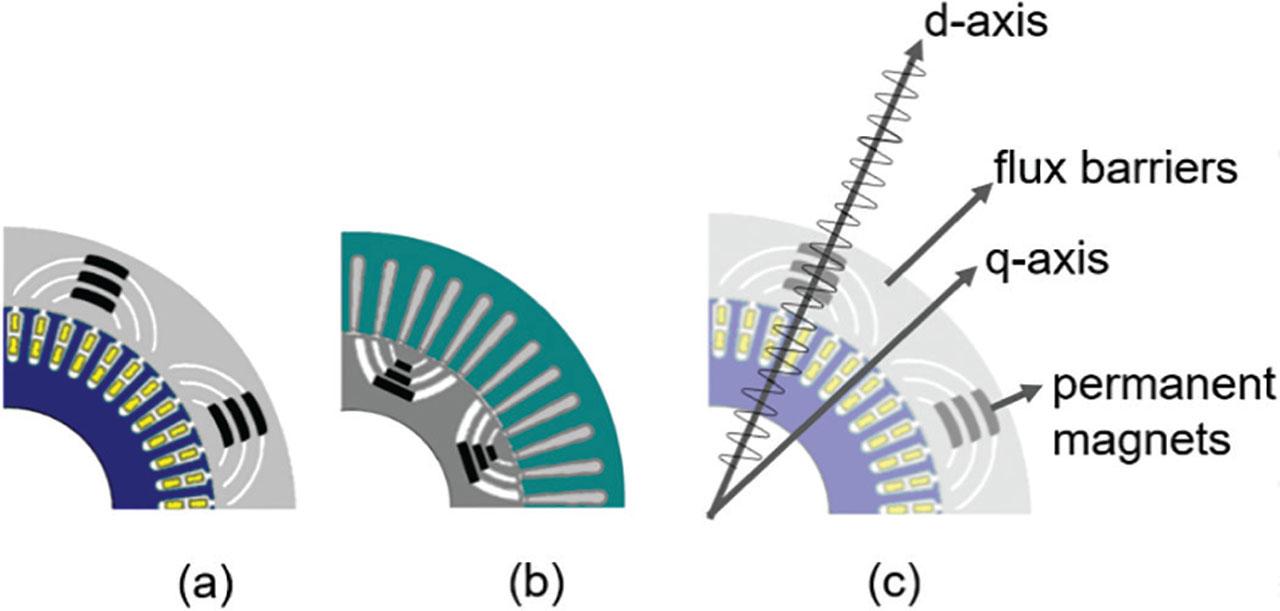
Cross-sectional views of PMaSynRM with (a) outer rotor and (b) inner rotor configurations. PMaSynRM, permanent magnet-assisted synchronous reluctance motors

Figure 3.
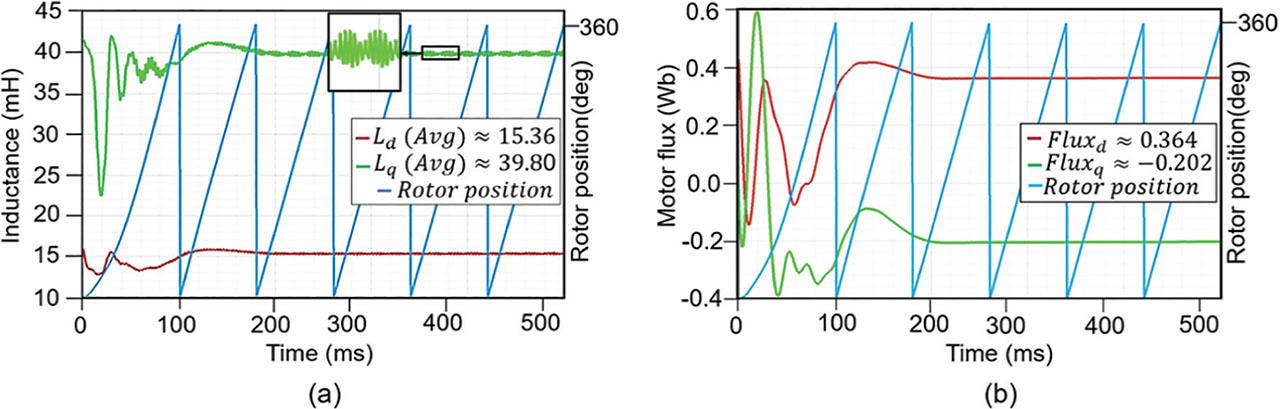
Electromagnetic characteristics of the OR-PMaSynRM: (a) Variation of the Ld and Lq inductances with respect to the rotor position and (b) magnetic flux linkage characteristics of the motor and the rotor position graph. OR-PMaSynRM, outer-rotor permanent magnet-assisted synchronous reluctance motor.

Figure 4.
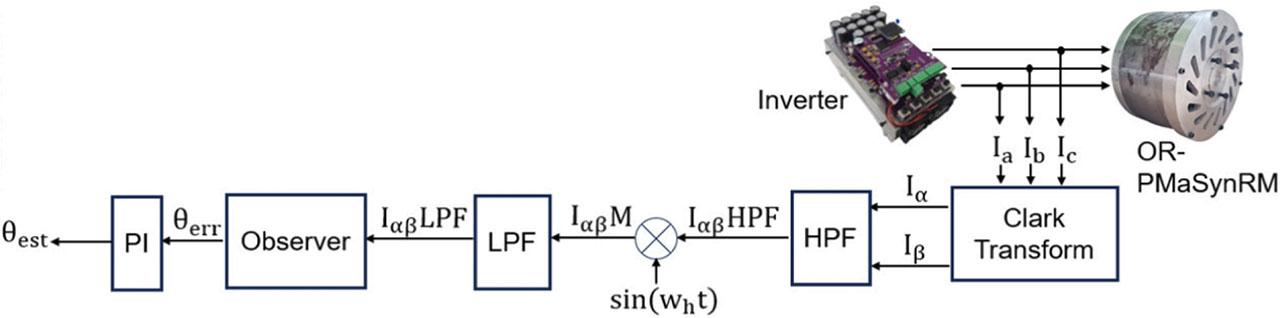
Demodulation stages in HFI-based rotor position estimation. HFI, high-frequency signal injection; HPF, high-pass filter; LPF, low-pass filter.

Figure 5.
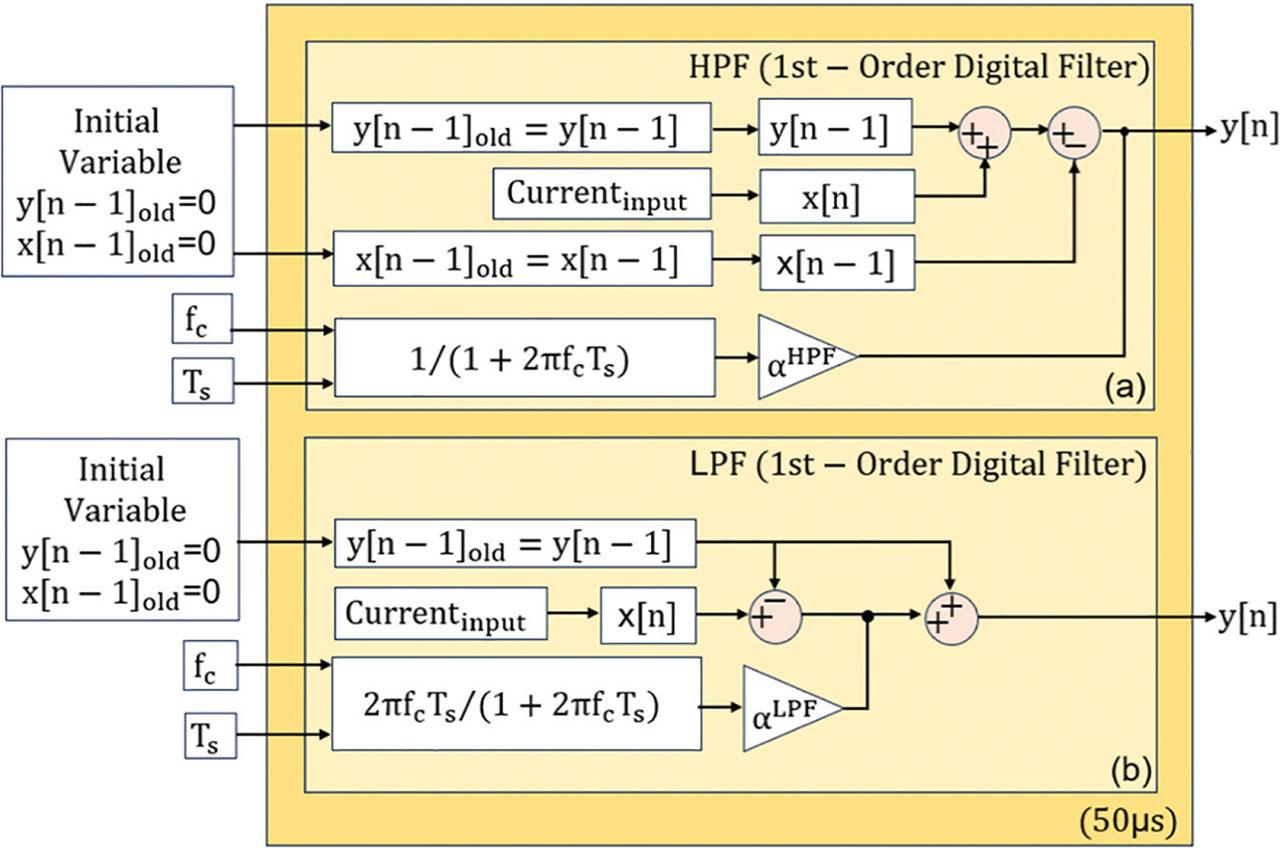
Implementation structures of the first-order digital filters: (a) HPF used in the demodulation stage, (b) LPF used in the signal extraction stage. HPF, high-pass filter; LPF, low-pass filter.

Figure 6.
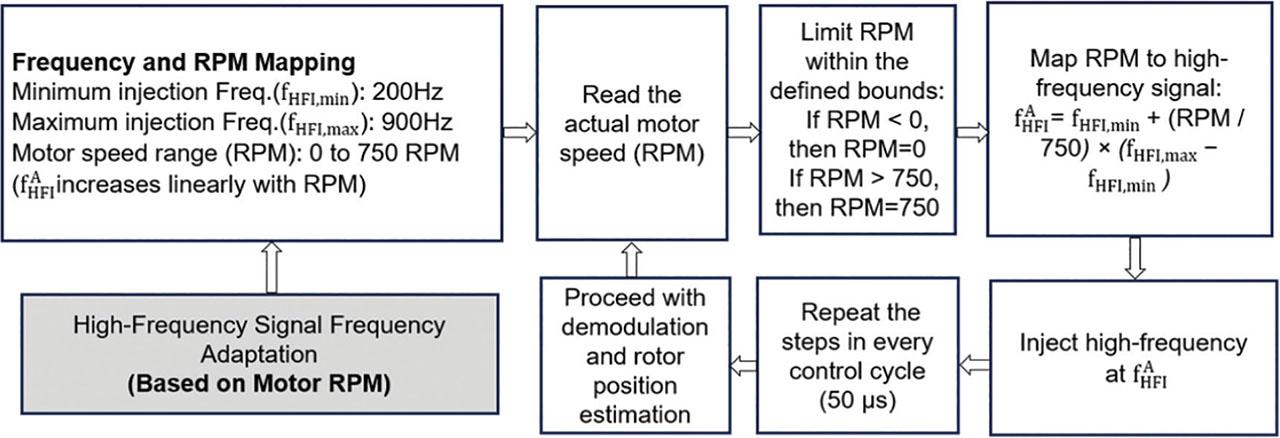
Flowchart of the adaptive frequency injection algorithm.

Figure 7.
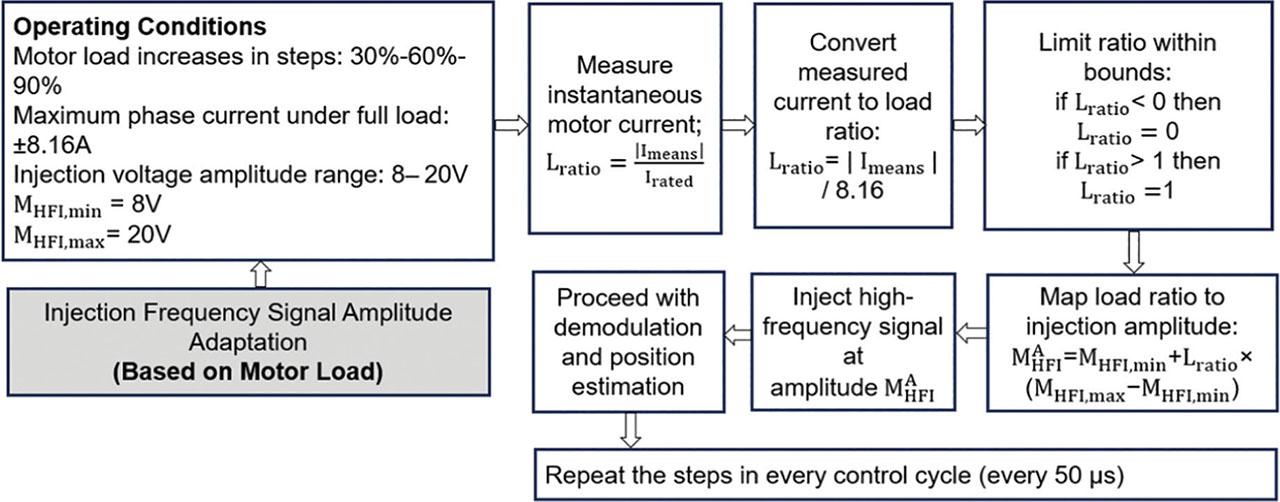
Flowchart of the adaptive injected signal amplitude control.

Figure 8.
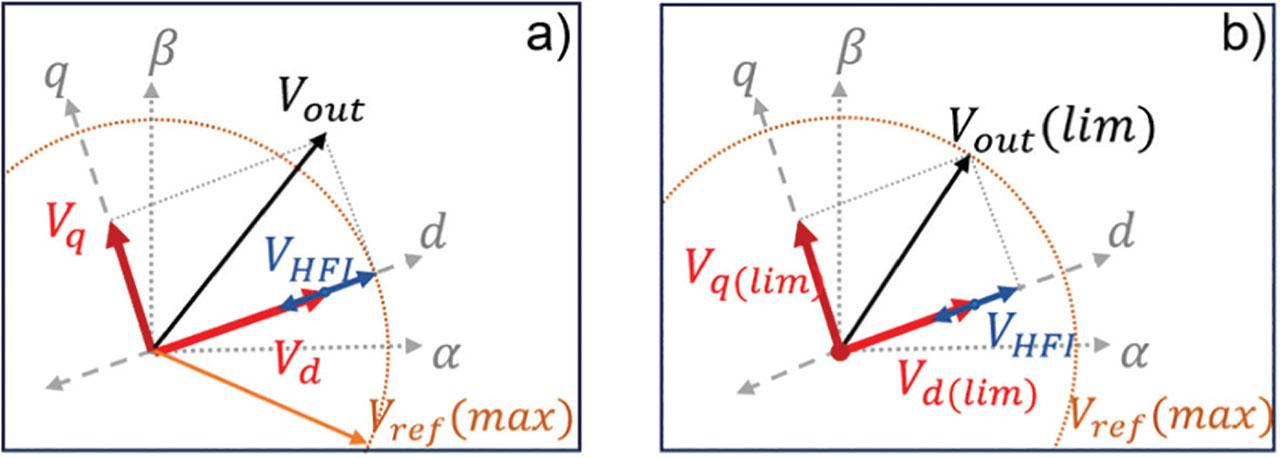
(a) Total stator voltage vector exceeding the voltage limit and (b) limited stator voltage vector.

Figure 9.
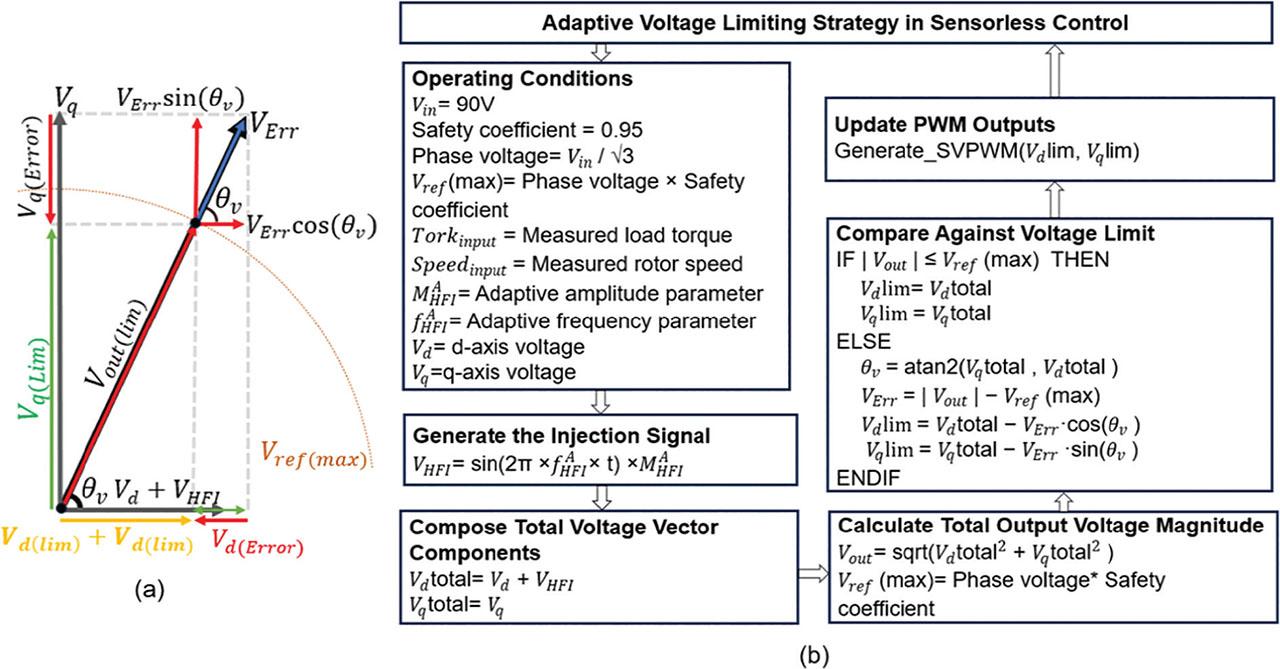
(a) Vector representation of the proposed limiting strategy based on error vector decomposition and (b) flowchart of the adaptive voltage limiting strategy. SVPWM, Space Vector Pulse Width Modulation.

Figure 10.
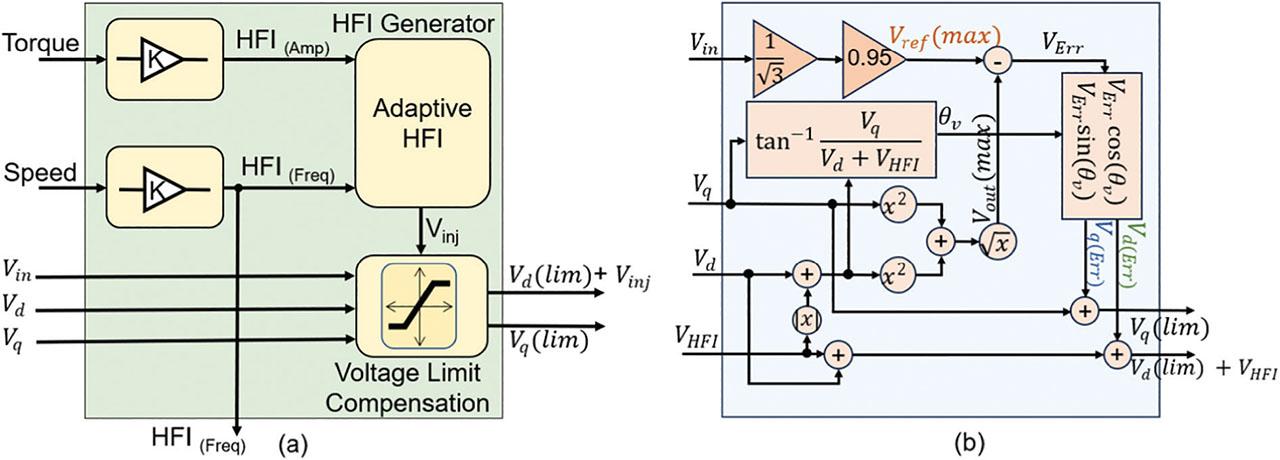
(a) Adaptive HFI signal generation and voltage limiting block and (b) mathematical flow diagram. HFI, high-frequency signal injection.

Figure 11.
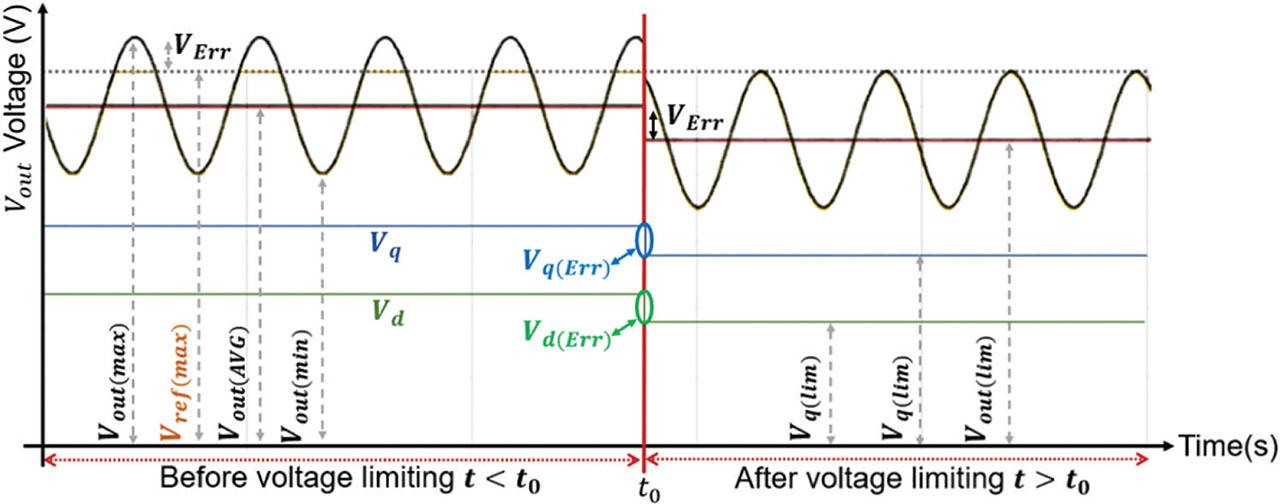
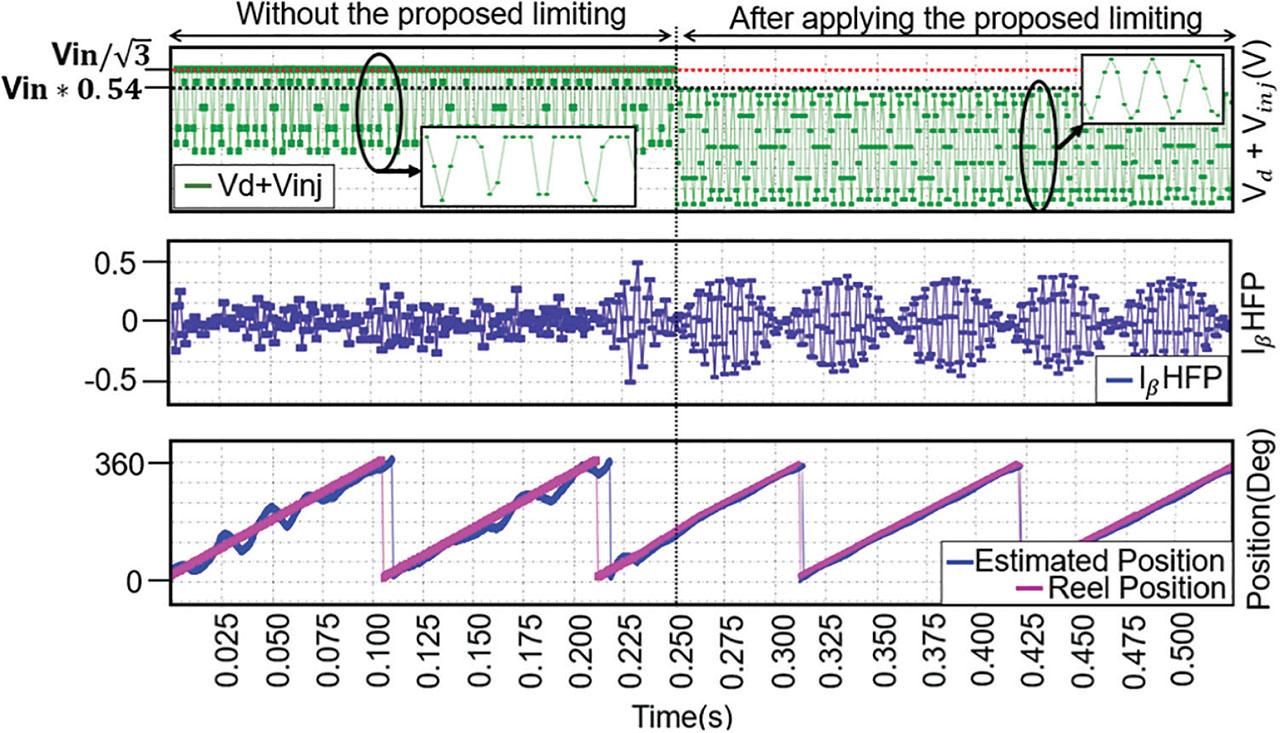
Comparison of the VHFI signal integrity before and after the voltage limiting.

Figure 12.
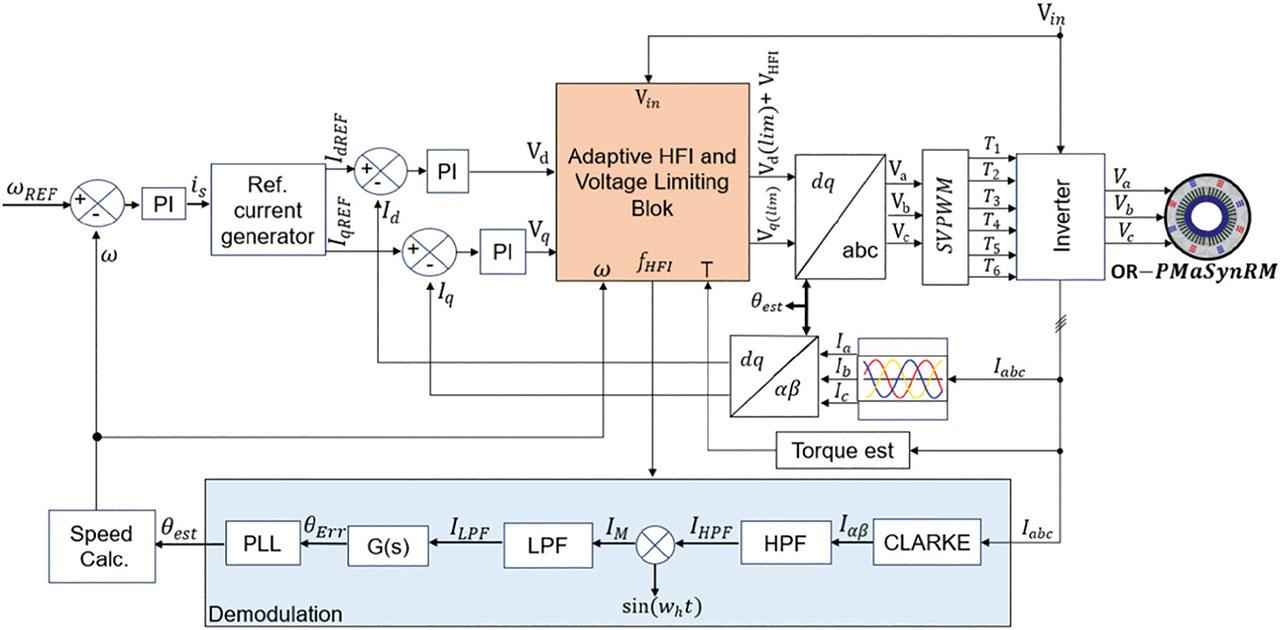
Block diagram of the FOC-based adaptive HFI sensorless control system. FOC, field-oriented control; HFI, high-frequency signal injection; HPF, high-pass filter; LPF, low-pass filter.

Figure 13.
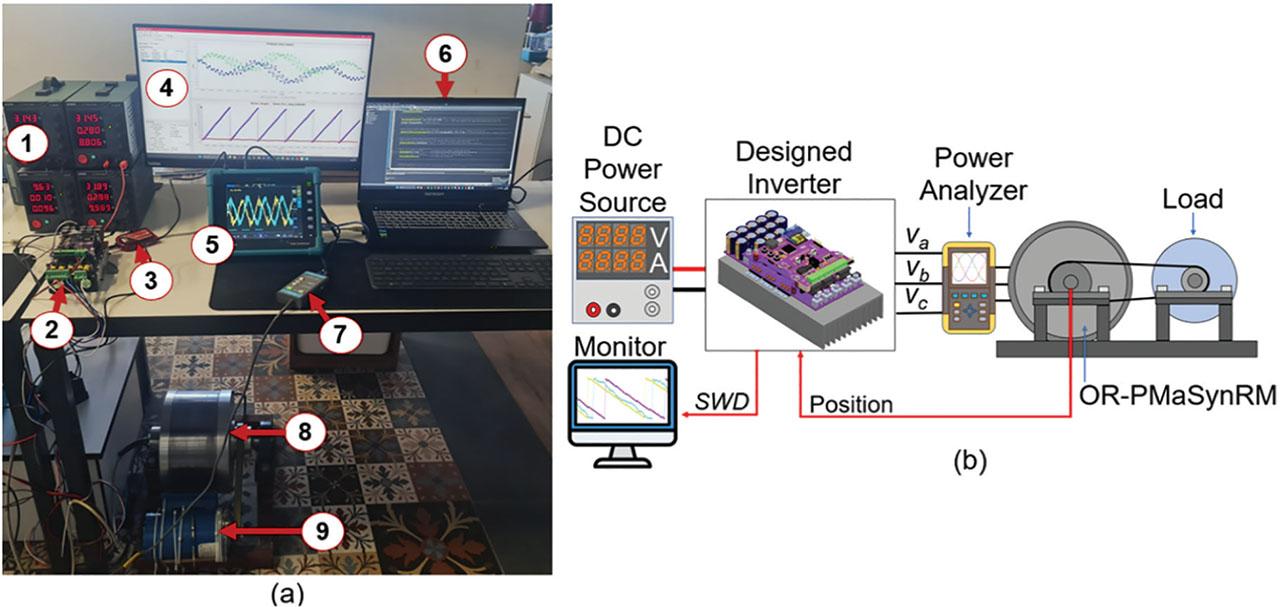
(a) The established OR-PmaSynRM sensorless drive system: (1) DC power source, (2) motor drive circuit, (3) isolated ST-Link, (4) monitor, (5) digital oscilloscope, (6) PC, (7) current probe, (8) OR-PmaSynRM, (9) current brake and (b) the OR-PmaSynRM drive test unit. OR-PMaSynRM, outer-rotor permanent magnet-assisted synchronous reluctance motor.
Table 1.
Experimental hardware specifications.
| Parameter | Value |
|---|---|
| Microcontroller | STM32F407VG (168 MHz, ARM Cortex-M4F [32-bit]) |
| DC bus voltage (Vin) | 90 VDC |
| Current sensor type | GHS 20-SME |
| Current sensor output sensitivity | 40 mV/A (typical) |
| Current sensing resolution | 12-bit ADC |
| Position sensor (for validation only) | MA702, 14-bit magnetic encoder |
| Cooling method | Aluminium heatsink and fan |
Table 2.
Experimental software specifications.
| Parameter | Value |
|---|---|
| Control method | FOC, HFI |
| HFI injection axis | d-axis only |
| Filter type (demodulation) | HPF and LPF (first-order digital) |
| Angle estimation method | PLL-based estimator with PI compensation |
| RMS angle error evaluation | RMSE |
| PWM switching frequency | 15 kHz |
| Proportional and integral gain values for the d-axis current controller | , |
| Proportional and integral gain values for the q-axis current controller | , |
Table 3.
Boundaries of adaptive control parameters.
| Control parameter | Adaptation variable | Operating range | Adaptive range |
|---|---|---|---|
| Adaptive injection frequency | Motor speed (RPM) | 0–750 RPM | 200–900 Hz |
| Adaptive injection amplitude | Load ratio (%) | 30%–60%–90% | 8–20 V |
| Adaptive filter cut-off frequency | – | 200–900 Hz | |
| Reference voltage limit | – | 45–49 V |
Table 4.
Specifications of the OR-PmaSynRM.
| Parameter | Value | Unit |
|---|---|---|
| Phase voltage | 90 | VRMS |
| Rated current | 5.741 | ARMS |
| Reactive power | 313 | VAR |
| Output power | 1500 | W |
| Input power | 1639 | VA |
| Efficiency | 91.51 | % |
| Rated speed | 750 | RPM |
| Frequency | 50 | Hz |
| Load torque | 19.1 | Nm |

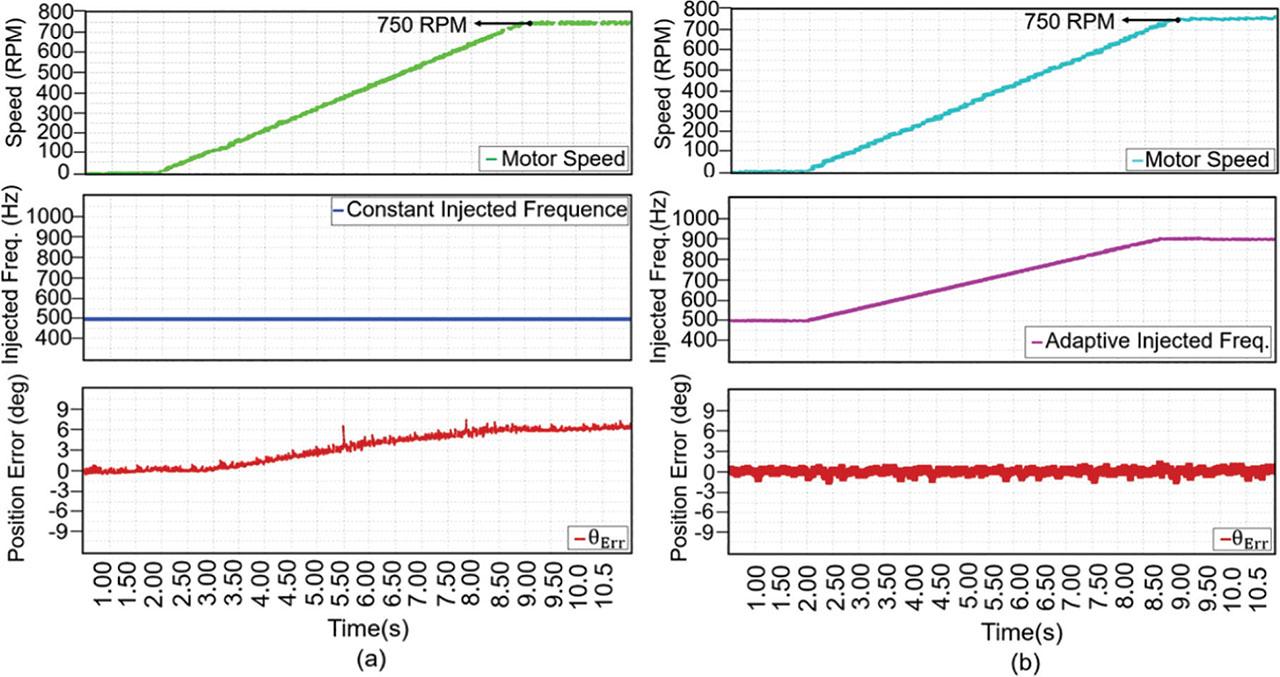
Figure 14.
(a) Effect of a constant injection frequency on rotor position estimation error during motor speed increase and (b) impact of the adaptive injection signal frequency on rotor position estimation error during motor speed variations.

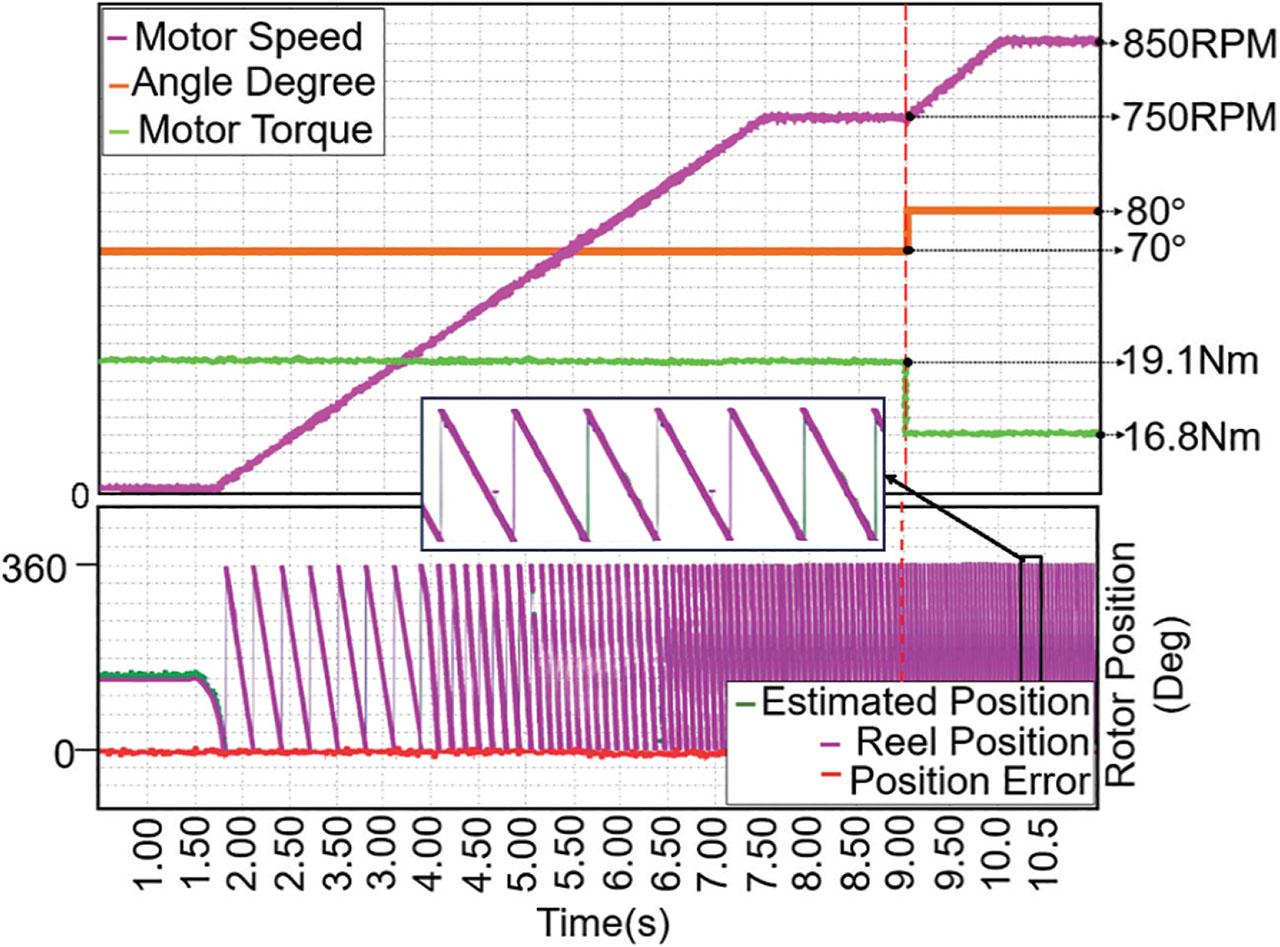
Figure 15.
Flux weakening behaviour and rotor position estimation performance of the OR-PmaSynRM. OR-PMaSynRM, outer-rotor permanent magnet-assisted synchronous reluctance motor.

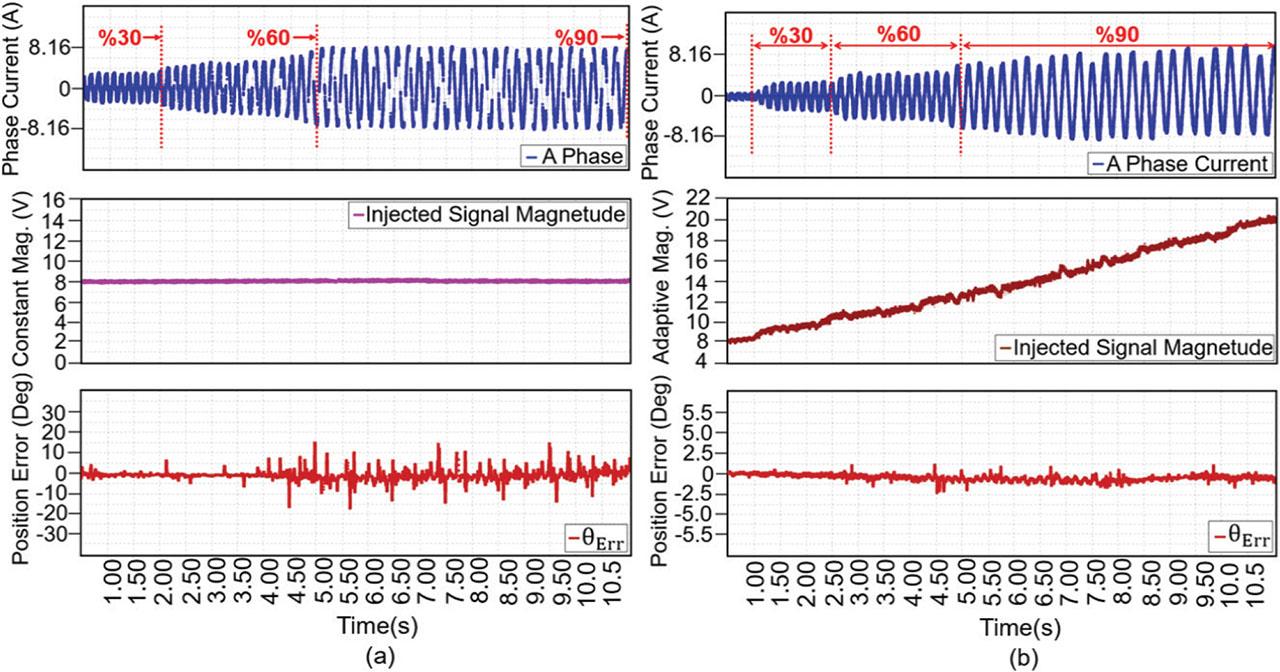
Figure 16.
(a) Rotor position error resulting from a constant-amplitude injection signal under varying load conditions and (b) impact of the adaptive injection signal frequency on rotor position estimation error during motor speed variations.

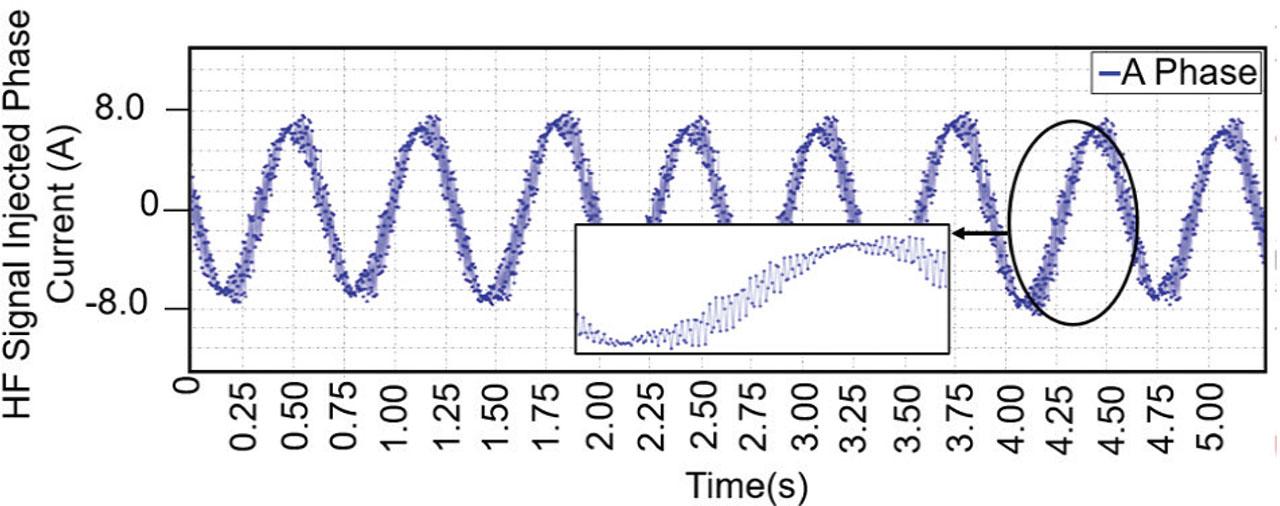
Figure 17.
Motor phase current under high-frequency injection.

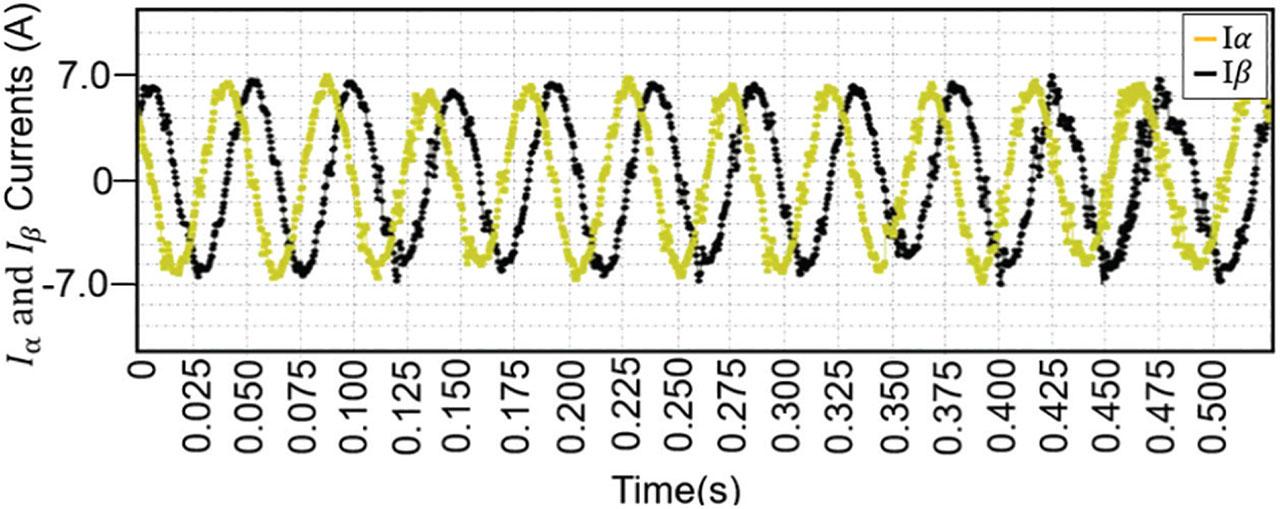
Figure 18.
Iα and Iβ currents under high-frequency signal injection.

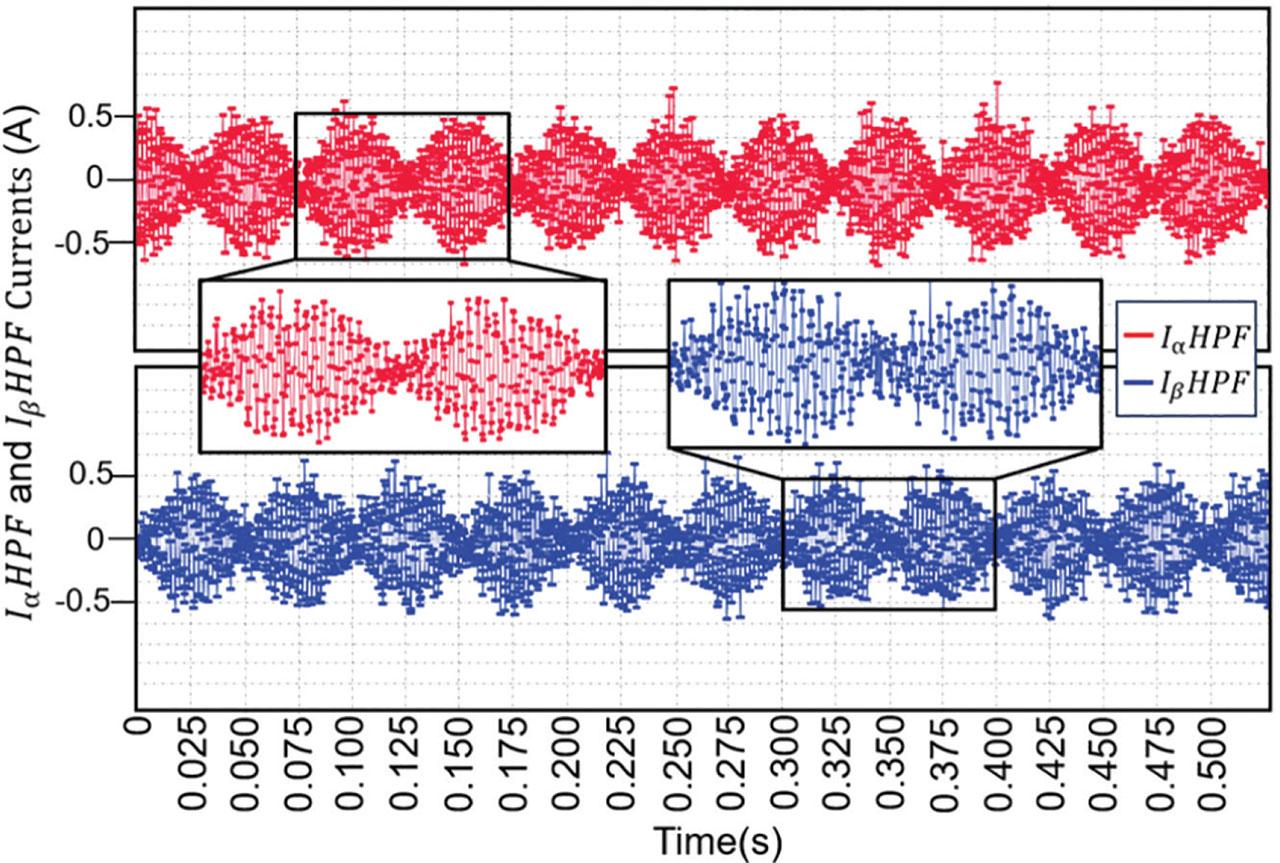
Figure 19.
IαHPF and IβHPF signals obtained after the HPF stage. HPF, high-pass filter.

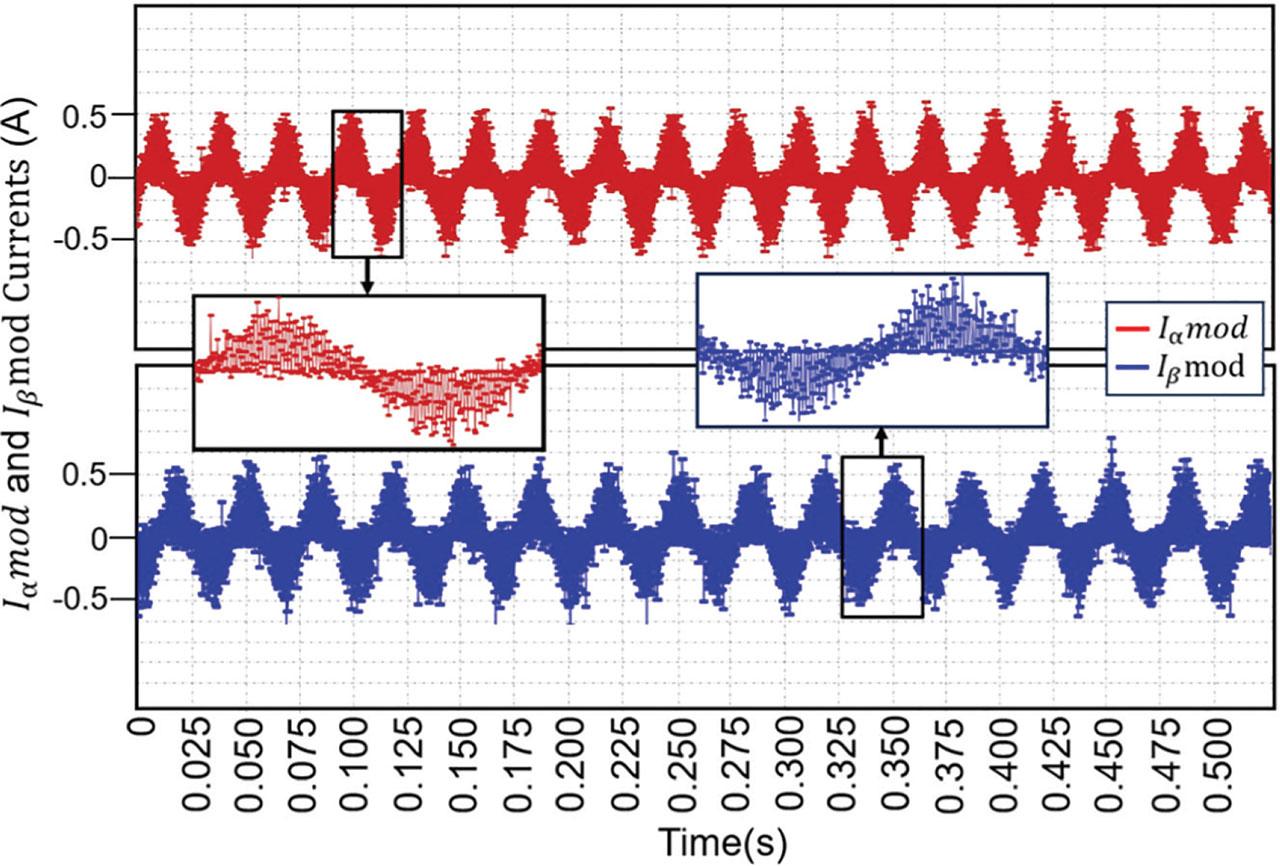
Figure 20.
Outputs of Iαmod and Iβmod after sine-wave modulation.

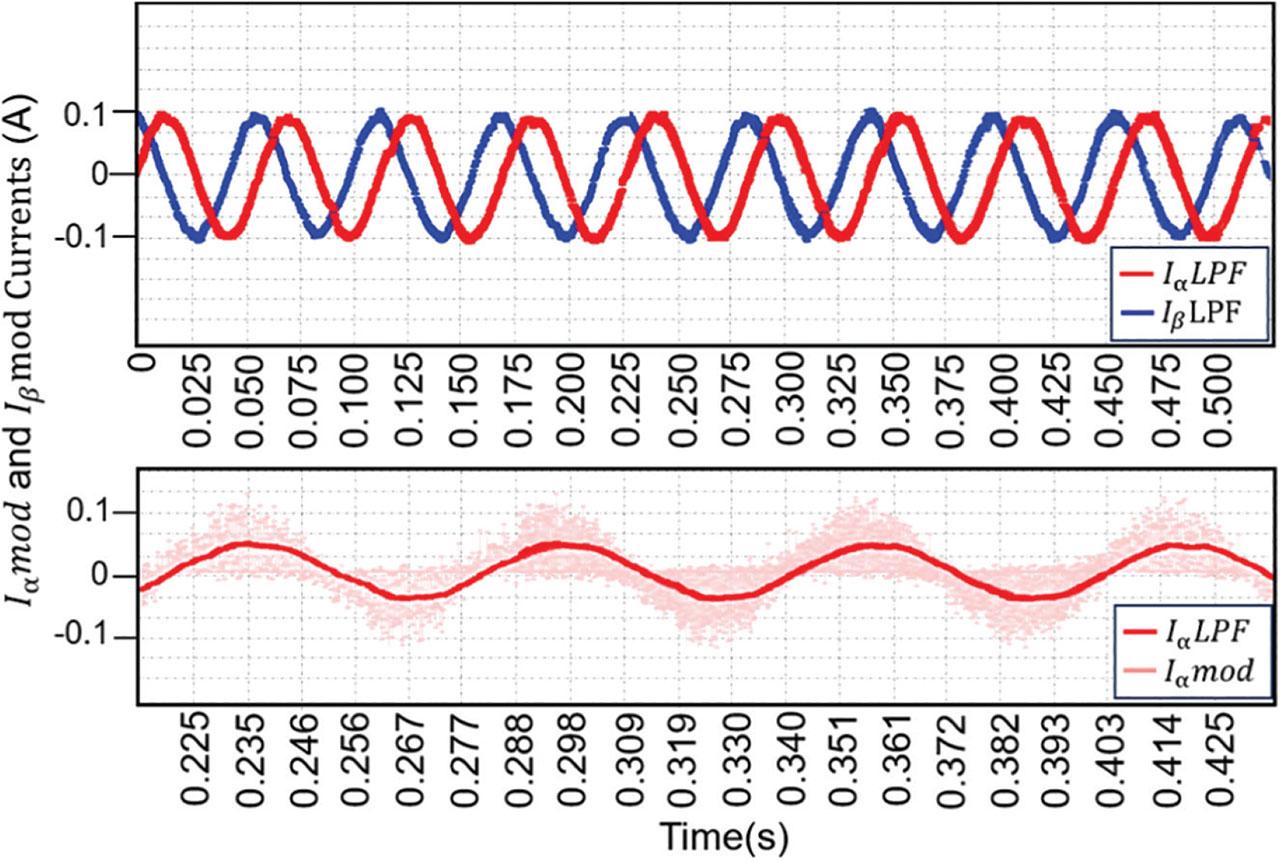
Figure 21.
IαLPF and IβLPF current outputs obtained after low-pass filtering. LPF, low-pass filter.

Figure 22.
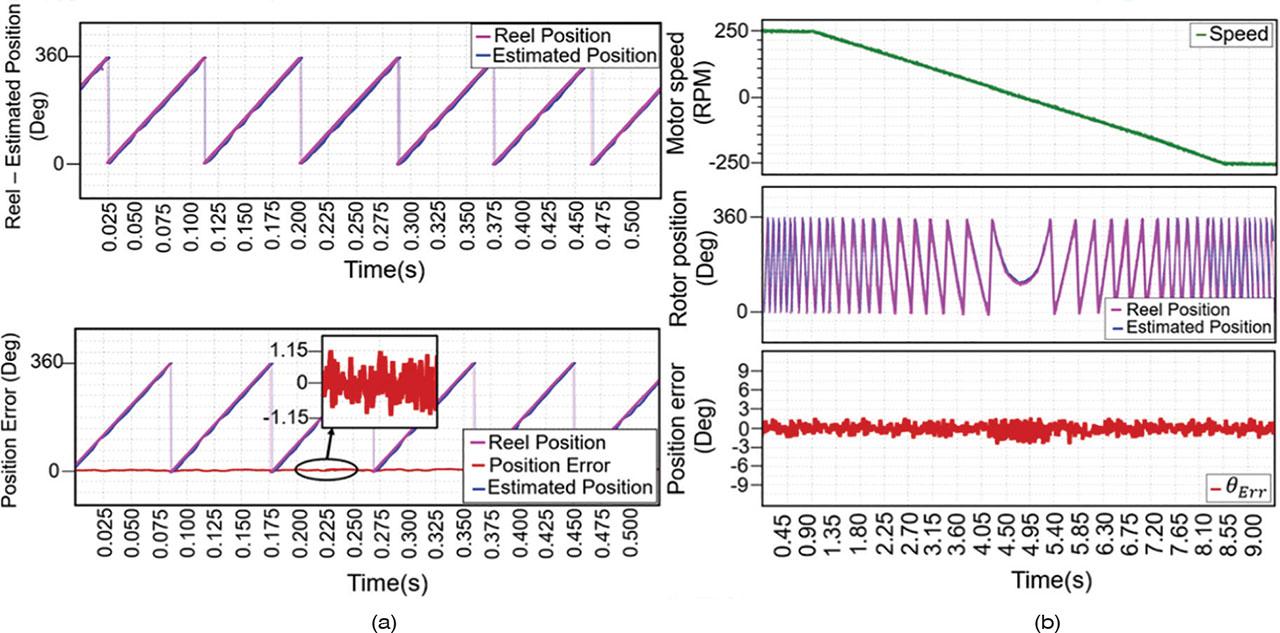
Rotor position estimation results: (a) Estimated rotor position compared with the real position and (b) rotor position estimation and corresponding error profiles under varying speed conditions.
Table 5.
RMS position error under different operating conditions.
| Test condition | Motor speed (RPM) | Load torque (Nm) | RMS error (°electrical) | Standard deviation (°electrical) | Max error (°electrical) |
|---|---|---|---|---|---|
| Low speed, light load | 150 | ≈5.7 | 1.10 | ±0.02 | 1.23 |
| Medium speed, nominal load | 450 | ≈11.5 | 1.12 | ±0.02 | 1.28 |
| High speed, high load | 750 | ≈17.2 | 1.15 | ±0.03 | 1.35 |

Figure 23.
Impact of the proposed voltage limiting method on rotor position estimation.
Table 6.
Comparison of rotor position estimation errors reported in various studies.
| Study | Motor type | Control method | Estimation method | Average RMS error (electrical degrees) |
|---|---|---|---|---|
| Method in Chen et al. (2024a) | PMSM | FOC | Adaptive BPF + HFI | ≈1.2° |
| Method in Tap et al. (2023) | PmaSynRM | FOC | Adaptive HFI + modified PLL | ≈1°–1.5° |
| Method in Lu et al. (2018) | IPMSM | FOC | Adaptive frequency & amplitude HFI | <3° |
| Method in Chen and Liu (2012) | IPMSM | FOC | HFI | ≈±2° |
| Method in Tongxing et al. (2019) | PMSM | FOC | Frequency self-optimized HFI + PLL | ≈±14.4° |
| Method in Kumar et al. (2019) | IPMSM | FOC | HFI + Self-adaptive PLL + adaptive amplitude | ≈1.5° |
| My work | OR-PmaSynRM | FOC | HFI + adaptive frequency + adaptive amplitude + proposed voltage limiting | ±1.15° |